In a 6/15/21 post, I had a grim outlook for longfin smelt for the summer of critical drought year 2021. My concern has proven warranted.
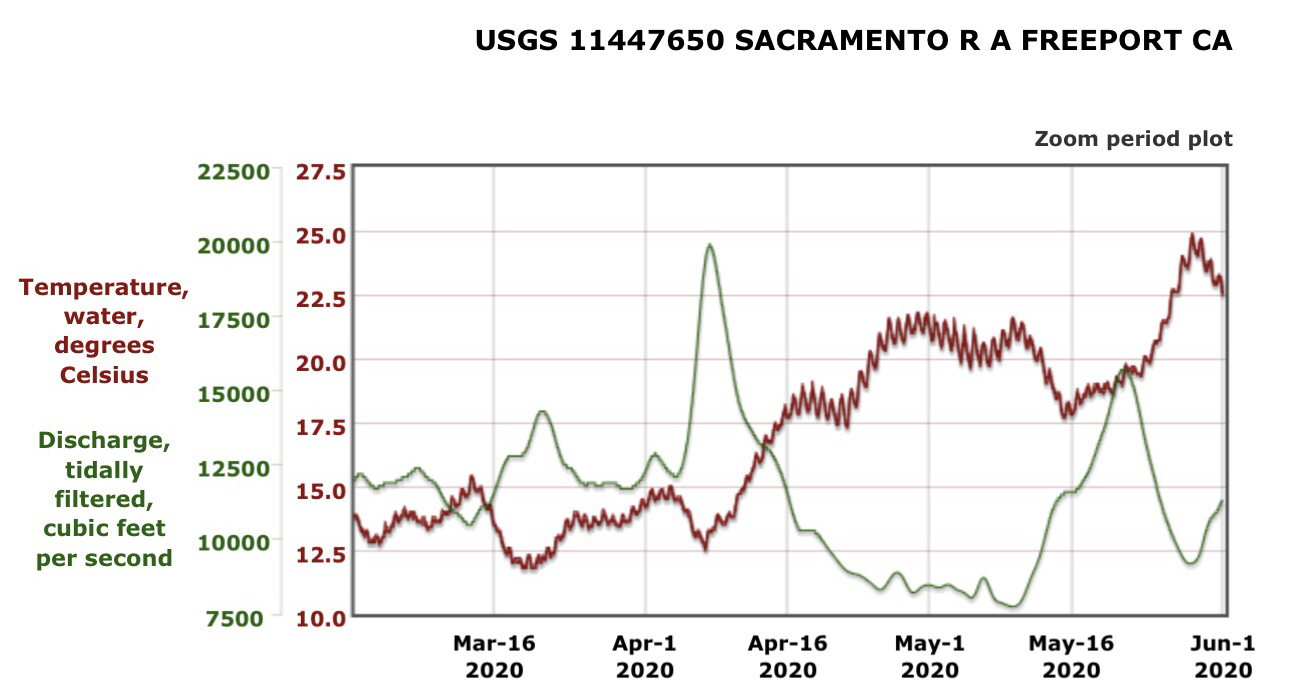
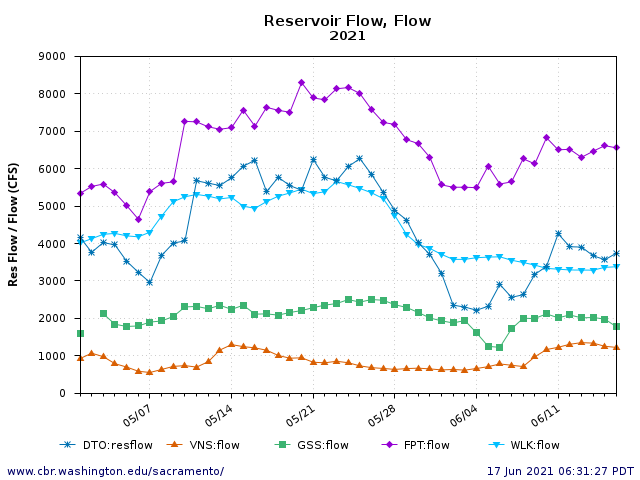
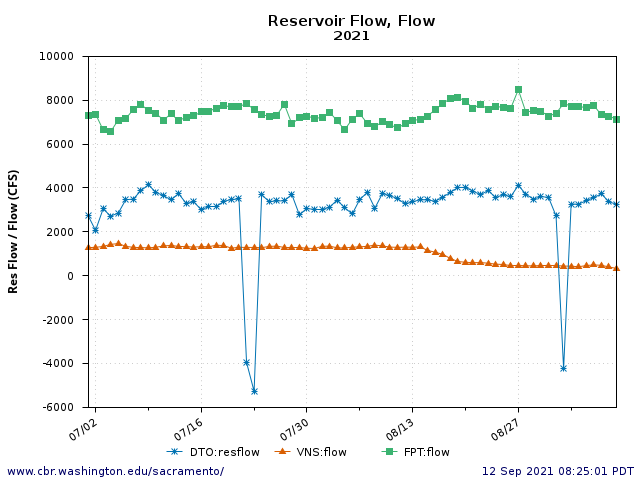
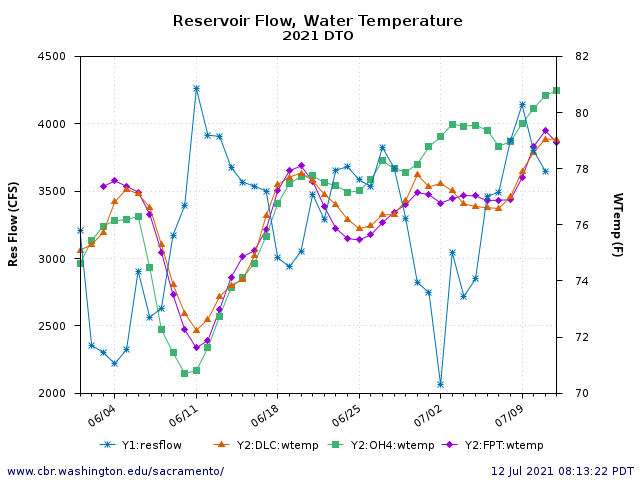
The June Townet Survey (6/7-6/10) found longfin juveniles concentrated in the Sacramento River channel of the western Delta (Figure 1) in water temperatures of 19-21ºC (Figure 2), very close to stressful, low growth, poor survival conditions for longfin (>20ºC). The area was within the low salinity zone, where juvenile smelt concentrate in spring. In conditions of low Delta outflow in drought years like 2021, the low salinity zone encroaches into the western Delta, where the zone is prone to warming without the cooler Bay air temperatures. The zone remained in the western Delta through the summer of 2021, with sustained water temperatures of 21-23ºC.
The September Midwater Trawl Survey collected only one longfin smelt, a minimum catch for that survey (Figure 3). This catch total was similar to those observed in late summer of other drought years (07-08, 15, and 20).
A 2017 paper by UC Davis scientists concluded that extinction of Delta smelt and longfin smelt was not inevitable if the necessary recovery actions were soon implemented. The paper’s recommended actions have as yet not been implemented, and conditions have even become worse in recent years, especially in the 2021 drought. Delta smelt are now virtually extinct in the wild, with longfin smelt likely to follow soon.
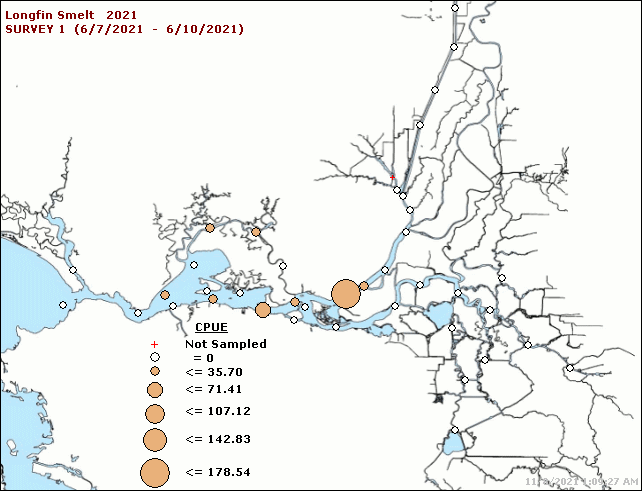
Figure 1. Catch per unit effort of longfin smelt in survey #1 of CDFW/IEP Townet Survey in June 2021.
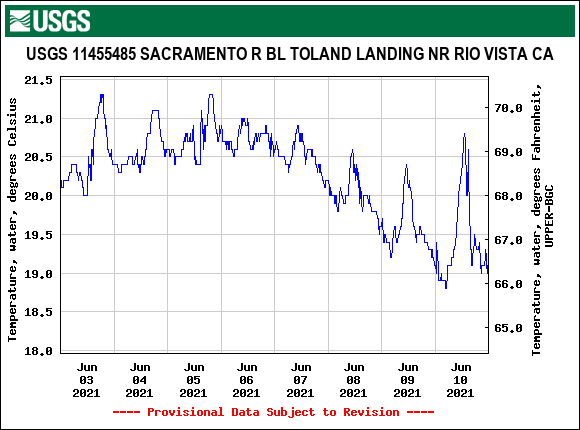
Figure 2. Water temperature in lower Sacramento River channel in western Delta in early June 2021.