The March 29, 2016 Delta smelt symposium, part 4 (“Panel Discussion of the Path Forward”) offered some hope but few specific strategies for Bay-Delta smelt recovery. My own presentation and other presentations earlier in Part 2, focused on how smelt got to the brink of extinction. In Part 4, the panel of experts was asked to offer ways to bring smelt back from the brink. Reading the transcript and watching the video of the discussion, there did not appear to be any specific array of actions or coherent strategy offered by the panel. But on further review, I did find some nuggets that when put together sketch a reasonable course of action.
First, though, it is important to point out that over the past two decades there were two episodes that stopped extinction and brought some (albeit modest and short-lived) recovery with the help of Mother Nature. The D-1641 water quality standards and the actions required by the Delta Smelt Biological Opinion actions did help. The symposium should have focused more on those actions that helped, in order to see what further is needed. Admittedly, the fact that recovery episodes were not more frequent makes this difficult. It also does not speak well for 20 years of Bay-Delta adaptive management, which in large measure was a test to see how far the Bay-Delta ecosystem could be stressed by taking more and more water without breaking it. Now that the ecosystem is broken, it is harder to see what helps and what does not.
Here is what I assembled from the panel’s discussion as a reasonable strategy to put the smelt and the Bay-Delta ecosystem back on a recovery course again.
Yolo Bypass – Cache Slough Complex
Simply putting more Sacramento River water down the Bypass might improve the Complex and transfer more of its nutrients, turbidity, and plankton (and smelt) to the north Delta and eastern Bay low salinity zone. Available water sources include the Colusa Basin Drain and Fremont Weir. The large Sacramento River agricultural diversions that feed the Drain are minimally used outside the April-October irrigation season. Present mandates and plans to notch the Fremont Weir would provide a direct source of Sacramento River water to the Bypass. A long-mandated relocation of the North Bay Aqueduct intake from the Cache Slough Complex to the Sacramento River would also help.
Sacramento Deep Water Ship Channel
Mentioned several times as the last refuge of Delta smelt, the Ship Channel from the Port in West Sacramento to the lower end of Cache Slough offers potential in improving conditions for smelt. The closed gate at the upper end of the Ship Channel could be opened at key times to pass Sacramento River water into the upper channel to help flush smelt and nutrients into the north Delta, or simply to enhance smelt survival in the channel itself and in the lower Cache Slough Complex. A panelist suggested dredging the channel. Opening it in summer would cool the channel and possibly the lower Complex because the opening is near the mouth of the American River with its cool outflow.
Nutrients
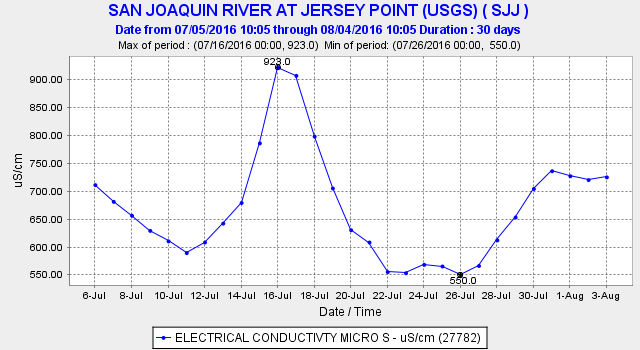
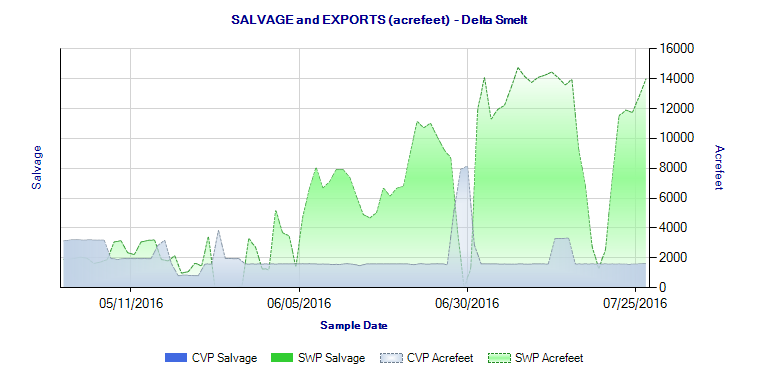
The Panel suggested Increasing nutrients, specifically nitrogen, as a means of boosting plankton productivity and smelt survival in the Delta. Ironically, the Sac Regional Treatment Plant is being forced to reduce its ammonia and nitrogen inputs to the Delta. But the suggestion holds much promise because plankton blooms and turbidity from them are necessary staples of smelt critical habitat. A recent spring plankton bloom coincident with a San Joaquin River flow pulse and low Delta exports suggests one option for increasing nutrients and plankton blooms. Another option is the above-mentioned flow through the Bypass and Ship Channel. Not exporting higher nutrient low salinity zone water is another. Employing the Head of Old River Barrier would force more of the high nutrient San Joaquin water into the Central Delta and away from the south Delta export pumps.
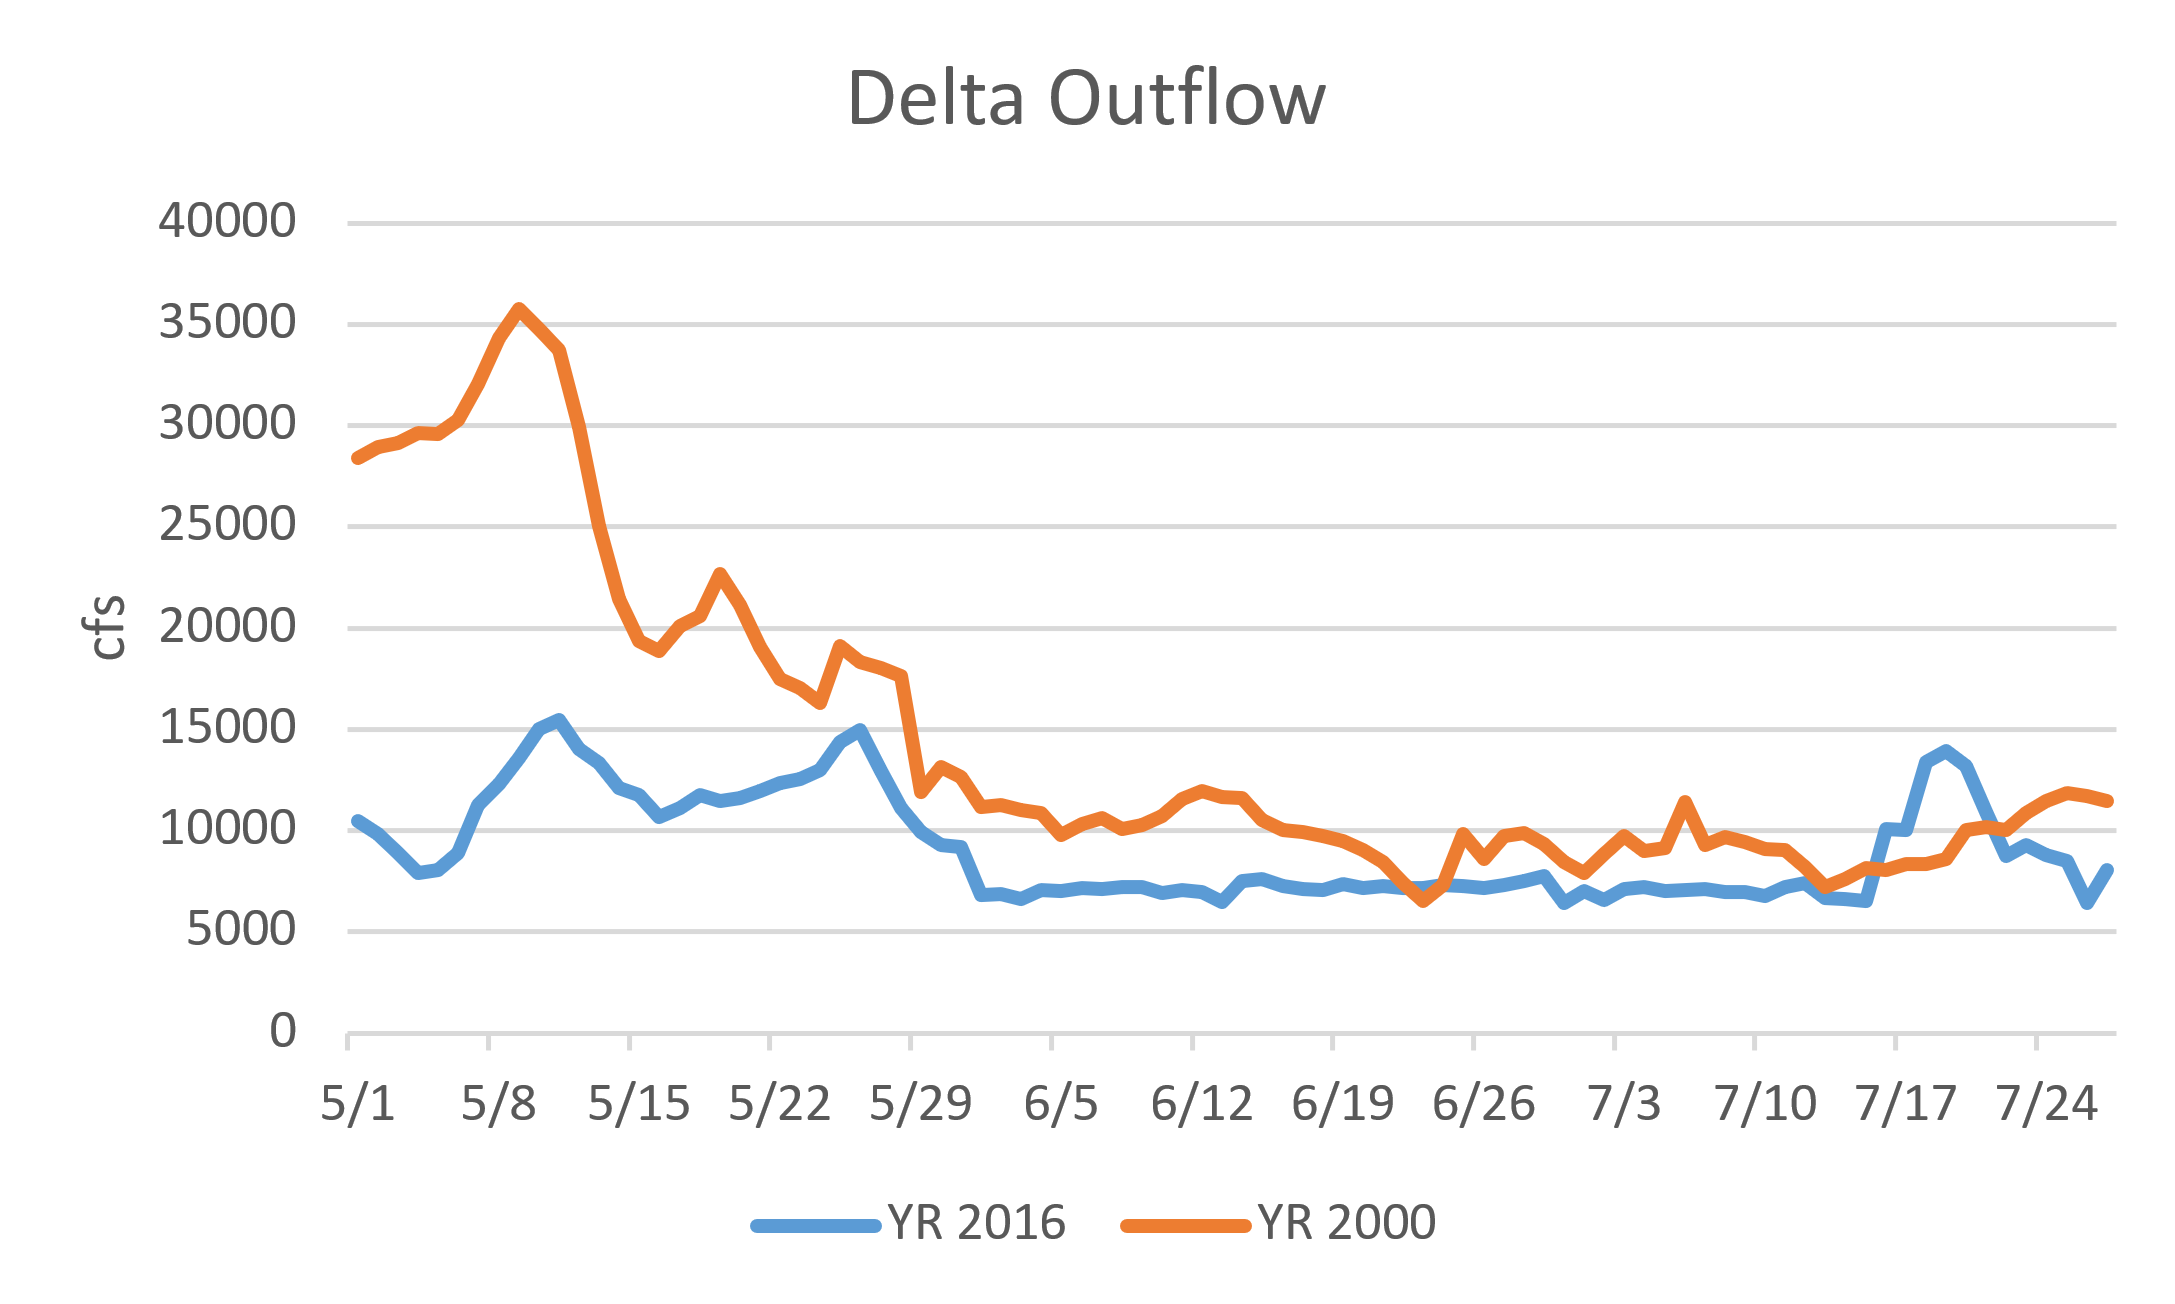
More Delta Outflow to the Bay
Almost everyone on the panel suggested the need for more flow to the Bay to help the smelt. The smelt are simply far better off in wet years. But no one on the panel suggested upgrading the Delta Outflow requirements in the Bay-Delta D-1641 water quality standards, a process that has been ongoing for nearly a decade. Relaxation of the outflow requirements in the past four years of drought proved disastrous for smelt, the kind of adaptive management experiment we could do without. More outflow moves smelt into better habitat in Suisun Bay and Marsh. It also keeps them away from the export pumps, Delta agricultural diversions, and the warmer lower-turbidity confines of the Delta channels with their profusion of warm water competitors and predators. A panel member noted the difficulty of “finding” more water for outflow. The water is there; the need to is export less of it.
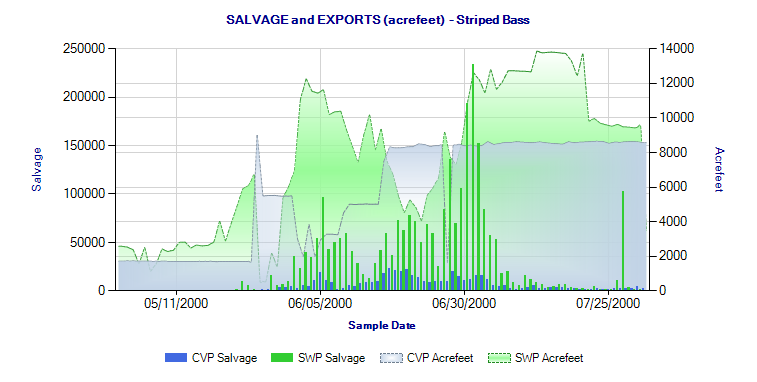
Exports
Several panelists suggested there has been too much emphasis on Delta exports, and that we should be focusing more on other solutions like improving habitats. While physical habitat improvements could help, the fact is that Delta pelagic habitat so essential to smelt and other Delta fishes has been severely degraded by exports (and lower outflows) at an ever increasing rate over the past four decades. Global warming is further adding to the stress. None of the panelists mentioned the benefits of export restrictions in the D-1641 standards or biological opinions. The agricultural community screams to weaken these restrictions, in part from the lack of recognition of their benefits.
Hatchery
Several panelists expressed the opinion that the species is protected from extinction by holding them in captivity in two conservation hatcheries. While that may be noble, it is not going to save the Delta or smelt. The option of expansion to production hatcheries was barely discussed, because of an underlying concern of where to put the hatchery fish given the poor existing habitat. But one panelist suggested stocking may be necessary to provide enough natural spawners to allow them to find one another during the spring spawn. Regardless, there are times and places where better habitat occurs such that if more smelt were added, it would benefit the population (e.g., when X2 is downstream of the Delta in the fall).
Predators
The panel mentioned predators, but only as one of the negative changes that have occurred over the past several decades. The panel discussed habitat enhancements as a means of reducing predators or their access to smelt. There was mention of increasing nutrients to increase phytoplankton food and turbidity, to shade out aquatic plants that shield non-native predator fishes. This holds promise if export operations do not replace good spatial habitat with incoming warm low turbidity river and reservoir water. The panel thankfully did not speak of directly removing Delta predators as a solution to the problem, a suggestion fostered by the ag community.
The Solution Package
As a group, the strategies mentioned above offer a reasonable short-term solution package to save the Delta smelt. Nearly all the actions can be immediately implemented, or at least started. As a followup to the symposium, I suggest a workshop to develop a plan for such a solution package to guide recovery during the coming years of water battles over the WaterFix (Delta Tunnels), the update of the Bay-Delta Water Quality Control Plan, and the revision of the biological opinions for the long-term operation of the CVP and SWP.