The Symposium on the possible extinction of smelt held on March 29, 2016 offered no real solutions or solid recommendations for recovery of the two smelt species on the brink of extinction. My own presentation focused on the cause of the population crash of Delta Smelt, not prescriptions for recovery, which had been a topic of some of my previous posts on smelt in this blog. The panel discussion at the end of the day of presentations brought out mostly old ideas and restoration strategies that have been unsuccessful over the past 40 years. There was little hope and a lot of pessimism from the panel. Some panelists recalled that estuary flows and exports are likely important factors, but also lamented that these are hard to change. Specific panelists held out hope that restoring wetlands and marshes, increasing aquatic food abundance, and reducing toxins might bring the smelt back under present water management. With that background, I thought I should add my own suggestions for how to proceed during the year that may be our last opportunity to help smelt (Figure 1).
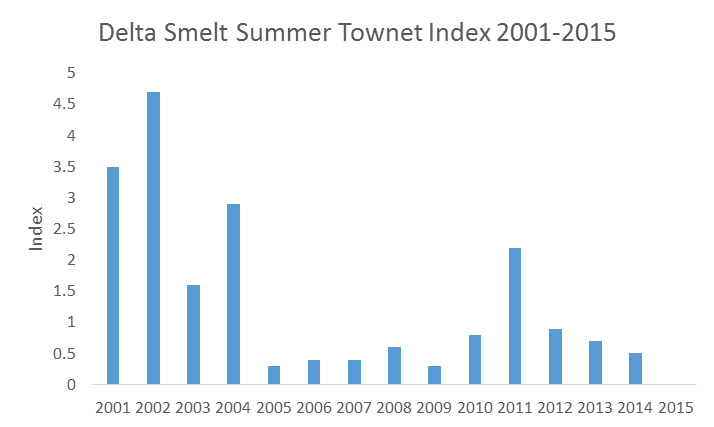
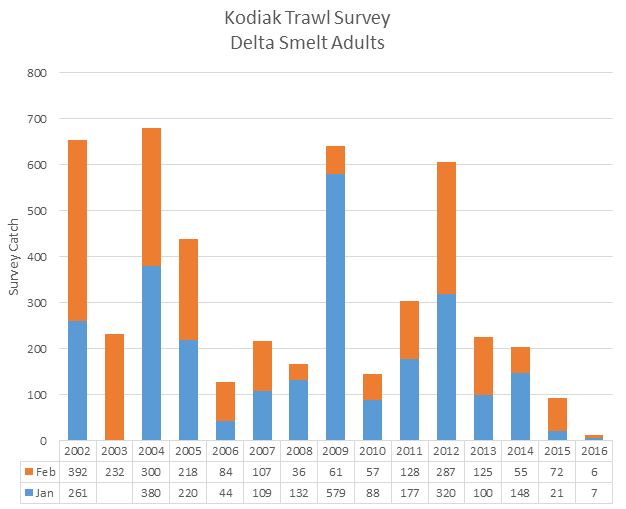
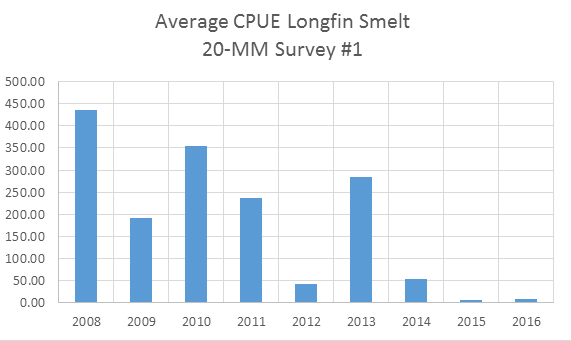
Figure 1. Summer Townet Survey indices 2002-2015. (2015 was zero.)
This year is a wetter year, not unlike the recovery year 2010 (Figure 1). So if there is the same level of protection as in 2010, smelt might show signs of recovery with a positive response to good conditions. However, if they do not respond favorably, it would suggest that Delta smelt need more drastic actions to prevent extinction. Below I describe the basic protections provided in 2010, recommend added actions, suggest several still more drastic prescriptions, and recall planned long-term actions that need to get moving.
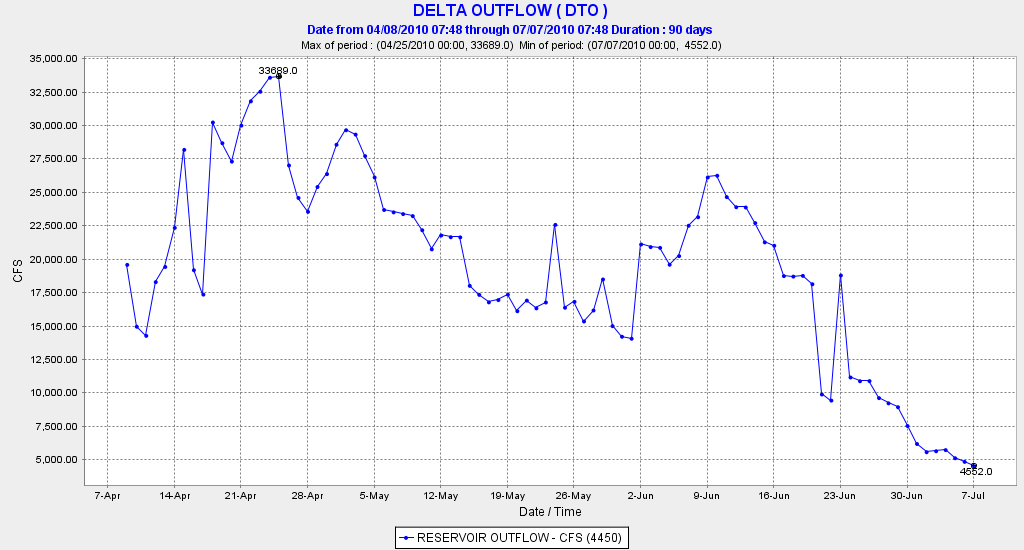
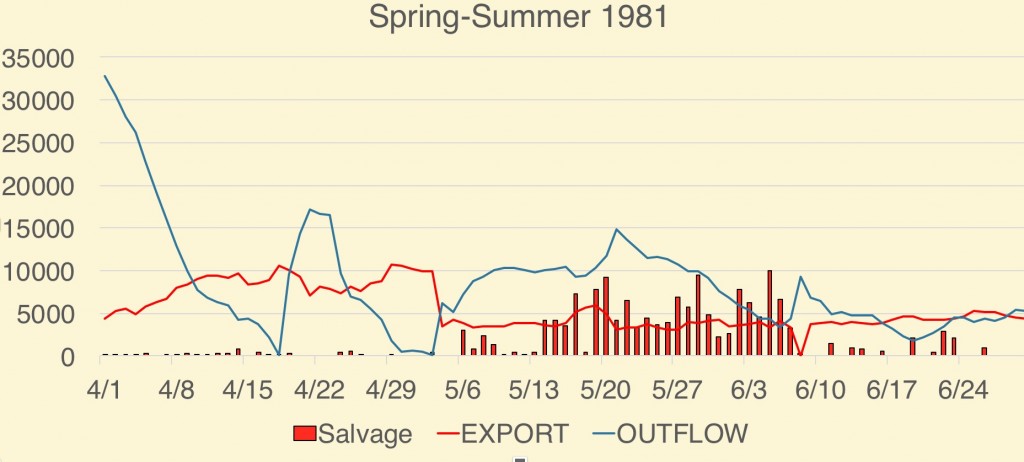
Figure 2. Daily average Delta outflow spring 2010. Source: CDEC.
Prescription 1 – Limit Spring Exports as in 2010
Year 2010 had relatively good spring Delta outflows (Figure 2). So far, April, 2016 has also started modestly not unlike 2010, with Delta outflows between 20,000 and 40,000 cfs.. Unless there is more rain, we can expect a sharp drop in outflow later in April this year as reservoir flood control releases cease. This would create flow conditions similar to those of 2010. Given the likely releases from storage combined with declining runoff, it would be reasonable to consider the actions prescribed in 2010 to protect smelt as a place to start this year: limit exports to about 1500 cfs. There will be strong pressure soon to increase exports to the maximum allowed under the biological opinions (5000-6000 cfs) unless the US Fish and Wildlife Service accepts the recommendation of the Smelt Working Group and limits exports. The Service limited exports in 2010. It has also largely done so in March and early April, 2016, to protect larval Delta Smelt that were observed in surveys in the lower San Joaquin River. A low level of export of 1500 cfs and -1800 cfs OMR would be consistent with actions in April in 2010 (Table 1). A low level of export may also be prescribed by NMFS to protect salmon and steelhead in April and May.
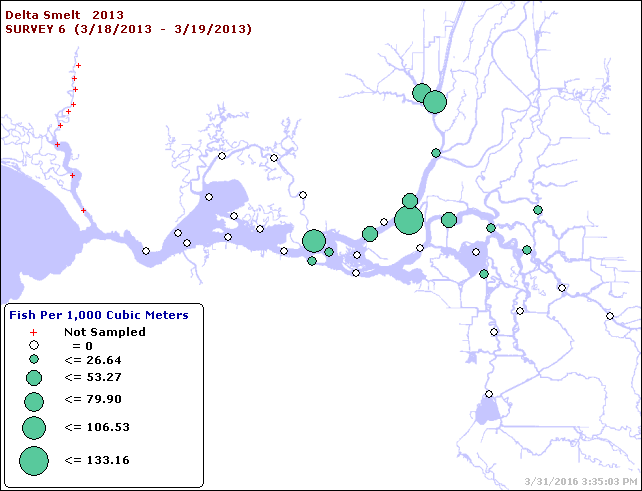
A continued low export prescription of a 2500 cfs limit through May 2010 was likely protective until such time as young smelt were able to transport downstream from Delta spawning grounds to the low salinity zone rearing area located in Suisun Bay under the 15,000-20,000 Delta outflows. Figure 3 shows the continued presence of Delta smelt in the Delta during May 2010.
By June many smelt had reached the eastern Bay out of the influence of the export pumps (Figures 4 and 5). Exports of 6300 cfs and -5000 OMR1 allowed under the Smelt Biological Opinion appeared to be protective in June 2010 as long as outflows were above 10,000 cfs.
Table 1. Monthly average export rates and OMRs in spring 2010, the year following the drought years of 2007-2009 which exhibited some smelt recovery.
| Month | 2010 Exports | 2010 OMRs |
| April | 1500 | -4600 to +1200 |
| May | 2400 | -1100 to +1250 |
| June | 6300 | -4800 to -1200 |
Prescription 2 – Sustain Delta Outflows through July
Delta outflows are necessary to move smelt west to Suisun Bay through the spring. A minimum daily average outflow of 15,000 cfs in April and May would simulate 2010 outflows (Figure 2), and would be consistent with historical relatively wet year outflows. These outflows are necessary to maintain the Low Salinity Zone west of the Delta in Suisun Bay, outside the influence of the South Delta export pumps. In June and July, a daily average outflow of at least 10,000 cfs would sustain smelt and the Low Salinity Zone west of the Delta away from the influence of the South Delta export pumps, and would be consistent with outflows in 2010 and 2011. The existing minimum monthly average outflow allowed in June of a wet or normal year under the Delta standards is 7100 cfs. The minimum outflow allowed in July of a wet or normal year (2010) is a monthly average of 8000 cfs. Daily averages could be adjusted to accommodate spring and neap tides as long as a minimum monthly average of 8,000-10,000 cfs is maintained. Note near maximum exports (11,400 cfs) were maintained in July in both recovery years 2010 and 2011 with June-July Delta outflows at or above 8000 cfs, because an outflow of 8000 cfs for the most part keeps smelt west of the Delta, outside the influence of the pumps.
More Protective Prescriptions
- Maintain -5000 OMR limit in July. Though maximum exports were maintained in July 2010 and 2011, some smelt remained in the north Delta into the summer (Figure 6) and were vulnerable to such higher exports. Lowering exports would save smelt (and pelagic habitat), water in storage, and reduce Delta water temperatures.
- Provide Delta daily minimum outflows of 15,000 cfs in June, 10,000 cfs in July, and 6,000 cfs in August. These outflows would be more consistent with June 2010 and July-August 2011, and would ensure that smelt and the Low Salinity Zone are maintained in Suisun Bay (Figure 7).
- Employ Fall X2 Wet-Year Prescription. Maintains X2 and Low Salinity Zone in Suisun Bay in fall.
Additional Prescriptions
- Open Delta Cross Channel in May and June. Opening the Cross Channel Gates will increase westward flow at Jersey Point (“QWEST”) and reduce the entrainment of smelt, the Low Salinity Zone, and Delta pelagic habitat by the export pumps.
- Install False River Barrier. Closing False River will reduce the entrainment of smelt and pelagic habitat into Franks Tract on flood tides from the lower San Joaquin River near Jersey Point.
- Increase spring and summer flow down Yolo Bypass into Cache Slough. Increasing inflows from Knights Landing Ridge Cut and the Sacramento Deepwater Ship Channel, and reducing diversions from the lower Yolo Bypass and Cache Slough, will increase net flows out of Yolo Bypass-Cache Slough complex into Sacramento River in west Delta.
Expedite Future Actions
- Divert water from the Sacramento River at Fremont Weir into Yolo Bypass in April and May. A proposed notch in the Fremont Weir would flood the Yolo Bypass in the spring of more water years and would increase the magnitude and duration of flood flows in years when the existing weir level allows flooding.
- Operate gate at upper end of Sacramento Deepwater Ship Channel. This will allow added inflow into the Ship Channel and lower Cache Slough Complex from the Sacramento River at the northern end of the Delta.
- Move the North Bay Aqueduct intake from the Cache Slough complex to the Sacramento River.
- Stock hatchery-reared Delta smelt into Low Salinity Zone in Suisun Bay in summer of wet years, or in late fall/early winter of drier years.
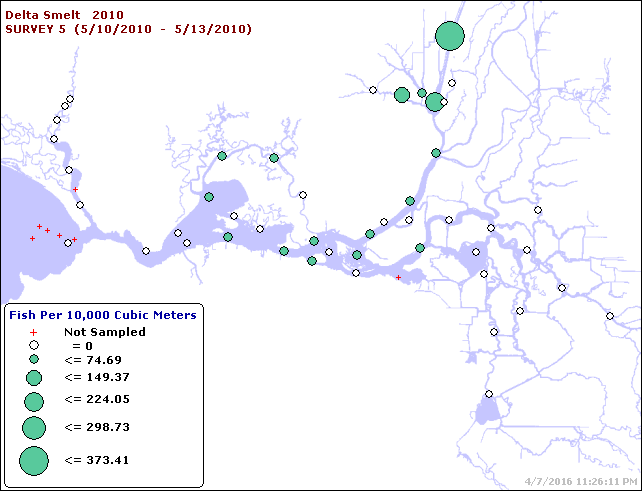
Figure 3. May 2010 Delta smelt distribution from 20-mm Survey.
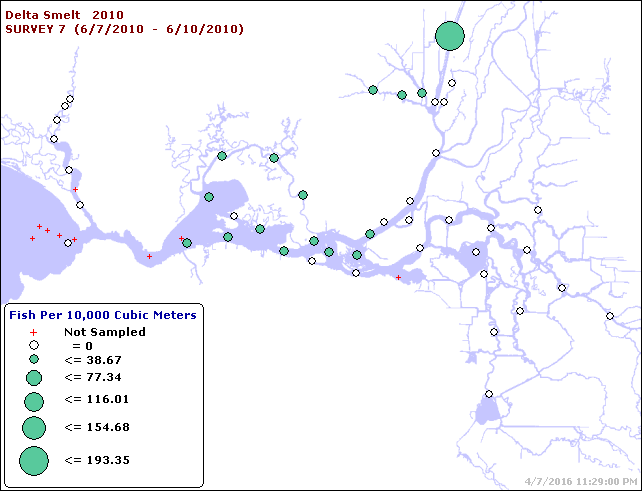
Figure 4. Early June 2010 Delta smelt distribution from 20-mm Survey.
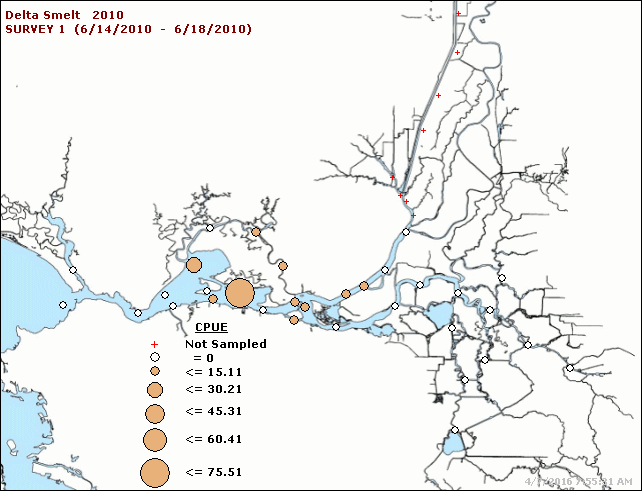
Figure 5. June 2010 Delta smelt distribution from Summer Townet Survey.
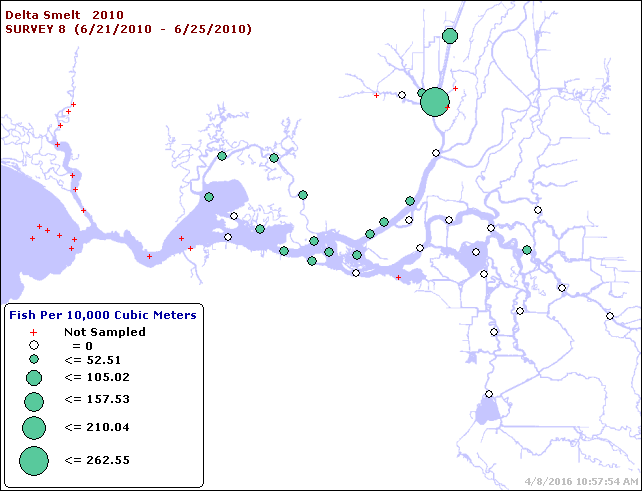
Figure 6. Late June 2010 Delta smelt distribution from 20-mm Survey.
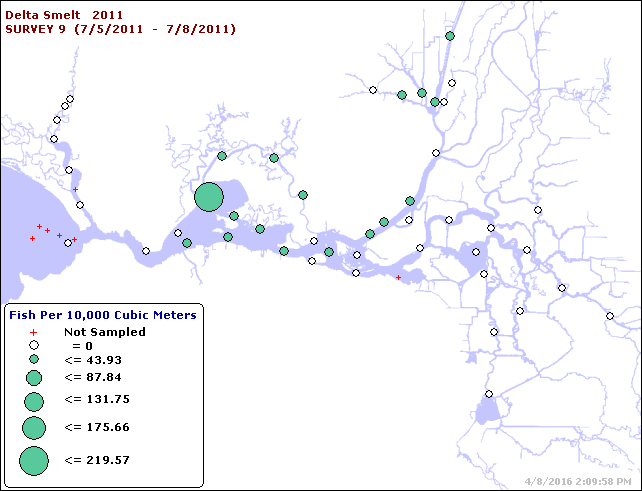
Figure 7. Early July 2011 Delta smelt distribution from 20-mm Survey.
- OMR is Old and Middle River flows in South Delta showing influence of South Delta export pumps when negative. For example: exports near 6000 cfs create OMRS about -5000 cfs, the limit prescribed through June in the Smelt Biological Opinion. ↩