Don Beyer and many others are concerned with the recent movement to limit hatchery production and mark-selective fisheries of Steelhead in the Puget Sound and Columbia River regions in Washington State. At the center of the debate have been proposals to eliminate hatchery programs on rivers with wild Steelhead.1 Typically, WA Steelhead fisheries focused on winter hatchery fish (adipose fin clipped), with catch-and-release of wild non-clipped fish in winter and spring. In recent years, popular mark-selective and wild catch-and-release fisheries have been shut down on rivers in WA with seemingly healthy populations of wild Steelhead.2 Will NMFS extend these strategies to California?
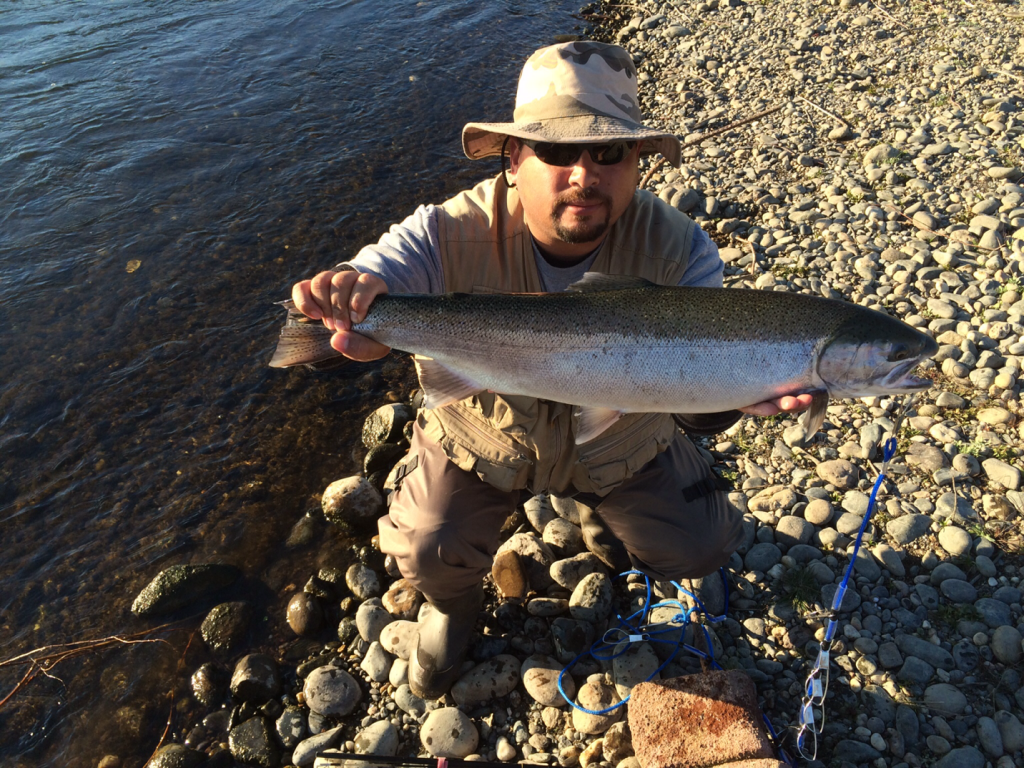
Recent catch of a hatchery Steelhead in the lower American River in Sacramento. (Photo by T. Cannon)
Marking of Hatchery Fish for Selective Fisheries
by Don Beyer
Salmon and steelhead hatcheries have been in existence for decades along the Pacific coast. The purpose of these hatcheries has been to maintain or improve fisheries for sport, commercial, and tribal interests. They are also a key factor in providing mitigation for habitat losses due to water resource projects such as dams, urbanization, land use alterations, and pollution which have negatively impacted wild fish populations.
Hatchery fish are utilized for food consumption by not only humans, but by marine mammals (e.g., Orcas, seals/sea lions, porpoise/dolphins), birds (bald eagles/ospreys/herons), and other fish (e.g., bull trout), many of which are protected under the Endangered Species Act (ESA), Marine Mammal Act, or other similar Federal acts. The sport fishing industry that has developed over decades around fish resulting from hatchery programs also has a very large economic impact involving millions of dollars.
As a result of the ESA and its efforts to protect non-hatchery raised salmon or steelhead, it was difficult for fishermen to distinguish between hatchery and non-hatchery fish and it appeared that harvest would need to be strictly curtailed or eliminated. To resolve this challenge, hatchery fish were required to be clearly “marked” so that they could be differentiated from non-hatchery fish. The most widely adopted approach has been to remove the adipose fin (a small non-functional fin near the tail of the fish) in juvenile fish before they leave the hatchery to migrate to the ocean. In this manner, if a fisherman caught a salmon or steelhead with an intact adipose fin, they were required to carefully release the fish (even if the season was open for that species). This approach (termed “selective fishery”) was to allow fishermen to continue fishing while protecting ESA-listed salmon or steelhead. Without this approach, the sport, commercial, and likely tribal fisheries would have ceased to exist. It took many years in all Pacific coast states, along with the efforts of many people, to get the selective fishery approved and implemented.
Other approaches are also being undertaken to minimize or eliminate interactions of ESA and non-ESA listed fish. For example, in the past, steelhead from Washington state hatcheries were released at the hatchery and often at other locations either upstream, downstream, or even other river systems. To minimize potential interactions with ESA-listed steelhead, this practice has been minimized to releases only at the hatchery. This takes advantage of the exceptional homing abilities of adult hatchery fish to return to their place of origin (i.e., the hatchery), thus reducing the interactions with non-hatchery fish.
Without the adipose-marking of fish, current fisheries would not be able to continue because fish protected under ESA could not be differentiated from hatchery fish. As such, a major food source for humans and other ecosystem components (e.g., those mentioned above) would cease to exist along with the loss of a major industry dependent on hatchery production. Without selective fishing, the only possibility for a return to a harvestable level of fish would be for ESA-listed species to recover to a level of sustainability that includes harvest. This is a long-term undertaking and may not be possible in some areas where the habitat would not sustain recovery. However, in some situations such as the Columbia River system, progress is being made through recovery of habitat, improvements in hydroelectric and hatchery programs, and harvest restrictions. On the latter, the selective fishery approach has allowed a very viable sport, commercial, and tribal harvest to continue.