Another Salmon Hit for 2017

Shasta Dam releases were cut by a third during the first week of November, dropping water levels in the Redding salmon spawning reach by one to two feet (Figures 1 and 2). Delta CVP export demands declined, water temperatures dropped, and rain contributed modest flows from lower Sacramento tributaries, thus minimizing need for Shasta releases. Fall X2 flows are no longer are needed in the Delta. Might as well cut Shasta flows to save water for next year!

But somebody forgot that tens of thousands of spring-run and fall-run salmon that just finished spawning in the 50 miles of river below Shasta around Redding, Anderson, and Red Bluff! Will the water level drop hurt the fresh spawning redds? Yes, most certainly!

Figures 3 and 4 show depth use and optimum suitability for fall run Sacramento River spawners. The most used depth and optimum suitability for salmon spawning is between one and two feet. A one to two foot drop in water levels after spawning is not likely to create a good outcome. It would dewater many redds. It would lower flows and provide less oxygen, and more siltation in the redds that remained in the water, causing significant egg/embryo mortality of the eggs that survive the initial drop in the water level. These conditions could lead to a major loss of wild salmon production.

There is no valid reason for cutting the flows. Shasta storage is 3.15 million acre-ft, 120% of normal, near the all-time record of 3.25 maf for November. Who is guarding the henhouse? Where is that wonderful adaptive management federal and state agencies brag about?

Figure 1. River stage below Keswick Dam, Oct-Nov 2017.

Figure 2. River stage at Bend Bridge near Red Bluff, Oct-Nov 2017.

Figure 3. Habitat suitability and use of fall run salmon by water depth for spawning. (USFWS)

Figure 4. Habitat suitability and use of fall run salmon for spawning. (USFWS)

Further Thoughts on the California WaterFix

The Metropolitan Water District of Southern California, commonly known as MWD, recently released a series of information papers on the California WaterFix (Delta Tunnels).  In this post, I further address MWD’s “assessment” of what will happen to the Bay-Delta environment and fish community if the WaterFix is built and operated.  Excerpts from MWD’s papers and my comments follow.

WaterFix Objectives

California WaterFix proposes a strong operations plan based on sound, collaborative science and adaptive management to meet the following objectives:

  • Improve water supply reliability
  • Enhance ecosystem fishery habitat throughout the Delta
  • Allow flexible pumping operations in a dynamic fishery environment
  • Improve export water quality
  • Respond to climate change risks
  • Reduce seismic risks

Comment:  The proposed plan is unsound, not science-based, with no operations or adaptive management plan.  The WaterFix will wreak havoc on the Central Valley, Bay-Delta ecosystem.  That havoc will further water wars, not reliability.  Fishery habitat that depends on freshwater input will get less of it.  This will make the Bay-Delta warmer, saltier, more polluted, and more subject to the rigors of climate change.  Southern California will take the fresh clean Sierra water, leaving behind new burdens on the Bay-Delta.

Record Exports

State Water Project and Central Valley Project operations have been, and continue to be, affected by regulations that seek to change flow regimes in the Delta by setting rules for outflow variables. This has decreased operational flexibility and reduced exports to 25 million Californians who receive water from the SWP and CVP south of the Delta and millions of acres of irrigated farmland.

Comment:  Woe be it to saving some water for the rivers, Delta, and Bay.  Exports have increased each decade since the 60’s, when the SWP was built.  Delta export records were set in the 2000’s, reaching above 6 million acre-feet, only to be further eclipsed in 2011 and nearly so in 2017.  Relaxed outflow and salinity regulations in the 2012-2015 drought decimated fisheries and brought salt levels to the Delta not seen in four decades.  Such low flow and higher salinity conditions would be the new norm under the WaterFix.

Protecting Flows in the Delta

A more natural flow direction in the Delta during critical fish protection periods will increase water supply reliability and minimize reverse flows. North Delta diversions, fish screen designs, bypass flow criteria and real time operations will be managed to limit effects on listed fish species.

Comment:  Flow direction will not change – continued South Delta exports will still cause negative Old and Middle River, Jersey Point, False River, Threemile Slough, and Prisoners Point flows, but with less inflow from the North Delta.  There are no non-critical fish protection periods.  Adding more diversion will not protect fish.  The new North Delta fish screens will not protect fish1.  Bypass flow criteria will not repel salt or protect young fish from increasing diversions and greater tidal reverse flows when they migrate through the Delta.  Real-time operations have been around for a long time, and while they have protected water supply quantity and quality, they rarely have protected fish.

New Fish Habitat Benefits

Some of the benefits of the fishery habitat that will be created and restored include:

  • Improved habitat conditions along important juvenile salmon migration routes
  • Restored tidal and non-tidal wetlands, and native riparian forest habitat
  • Increased food production, spawning and rearing areas
  • Natural refuge from predators and changing climate conditions
  • Improved connectivity between existing areas of natural habitat

Comment:  The only changes in habitat that were not already required and planned are (1) the over two miles of perforated steel walls along the banks of the Sacramento River in the North Delta, and (2) the considerable reductions in freshwater flow into the Delta and Bay.  Most of the habitat improvements in the now defunct Bay Delta Conservation Plan or BDCP are not included in the WaterFix.

Changes in Delta Export Regulations

The SWP and CVP facilities have long been impacted by changing regulations governing both projects’ diversion facilities in the south Delta. On average, D-1641 has reduced SWP and CVP diversions and increased Delta outflows to the San Francisco Bay by about 300,000 acre-feet a year as compared to the SWRCB’s prior requirements.

Comment:  Since D-1641 rules came online in the mid-1990’s, exports have continually increased, including record levels above 6 maf in 2005, 2006, 2011, and 2017.  Water year 2012, a below-normal water year, was not far behind at 5.8 maf.  Even below-normal 2010, after three critical water years, saw 4.8 maf of exports, equivalent to wet year exports in 1998 and 1999.  Yes, exports were down in the 2007-2009 and 2013-2015 droughts, but were not unlike the 1977 and 1990-1992 drought levels.

Compounding the impacts, the biological opinions have decreased diversions and increased outflows by about another 1 MAF a year (Source: MBK Engineers and HDR “Retrospective Analysis of Changed Central Valley Project and State Water Project Conditions Due to Changes in Delta Regulations,” January 2013). 

Comment:  If this were the case, how is it that a record 6.7 maf of Delta exports in wet year 2011, and 5.8 maf in below-normal 2012 were possible under the 2008-2009 biological opinions?  The new restrictions, though real on paper, did not restrict actual exports, only the future capacity of exports.  The WaterFix plan would eliminate such constraints on total exports.  Though MWD, DWR and the Bureau of Reclamation say they would not increase exports, can we really take them at their word with WaterFix’s 40% increase in export capacity?

The increased Delta requirements and export constraints have further affected SWP and CVP operations by decreasing operational flexibility and increasing water supply vulnerabilities during dry conditions. This, in turn, reduces project reservoir storage, water deliveries, and supply reliability. Figure 1 illustrates the decrease in average SWP and CVP delivery capability over time due to additional regulatory requirements. As shown in the figure, over a period of a little more than 25 years, the export capability of the two projects has been reduced by over 3 MAF per year. California WaterFix is intended to reverse this downward trend.

Comment:  Again, real exports have increased year after year as new capacities south-of-Delta have come online.  Reservoir storage has been more aggressively used to the detriment of long-term water supply.  Restrictions applied have done more to deter future exports; thus the need for the WaterFix.

North Delta diversions, fish screen designs, bypass flow criteria and real time operations will be managed to limit effects on listed fish species.

Comment:  The permitting agencies have set low, unattainable, and arbitrary limits on effects (e.g., 5% loss of fish passing north Delta intake screens).  They contend that all the Valley flow and export “valves/knobs” and infrastructure operational options (e.g., gate opening/closure, air bubble screens, etc.) can be “managed” to protect listed fish.  Even if that were possible, this does not account for all the unlisted fish including striped bass, American shad, splittail, lamprey, threadfin shad, fall run salmon, native minnows, and pelagic habitat.

Adaptive Management

An Adaptive Management Program would be implemented through a collaborative process with regulatory agencies, project operators, and water contractors. This would provide a structured science process to develop adaptive means of improving conditions for both the ecosystem and water supply. Project operations that respond to real-time Delta conditions would also advance these objectives and provide greater certainty for water deliveries.

Comment:  The foxes, wolves, and hawks will be there to ensure a continuous supply of chickens from the henhouse.  Past adaptive management has focused on protecting water deliveries.

Biological Opinions

These biological opinions determined that California WaterFix as proposed would neither jeopardize the continued existence of species listed under the federal Endangered Species Act (ESA) nor destroy or adversely modify critical habitat for those species.

Comment:  What happened between the draft and final Opinions?  The agencies responsible for the application of federal and state Endangered Species Acts have taken out their false teeth and set them on that beautiful nightstand called adaptive management.

Exporting Water from North Delta

Over a period of a little more than 25 years, the export capability of the two projects has been reduced by over 3 MAF per year. California WaterFix is intended to reverse this downward trend.

Comment:  Again, export records have been achieved in all water year types in the decades of the 2000’s.  Yes, D-1641 water quality standards, listed fish biological opinions, and operation permits have placed new rules on “capability” but have done little to appease the appetite for water that the two projects have no right to.  Now they want new rights to further wet their thirst.

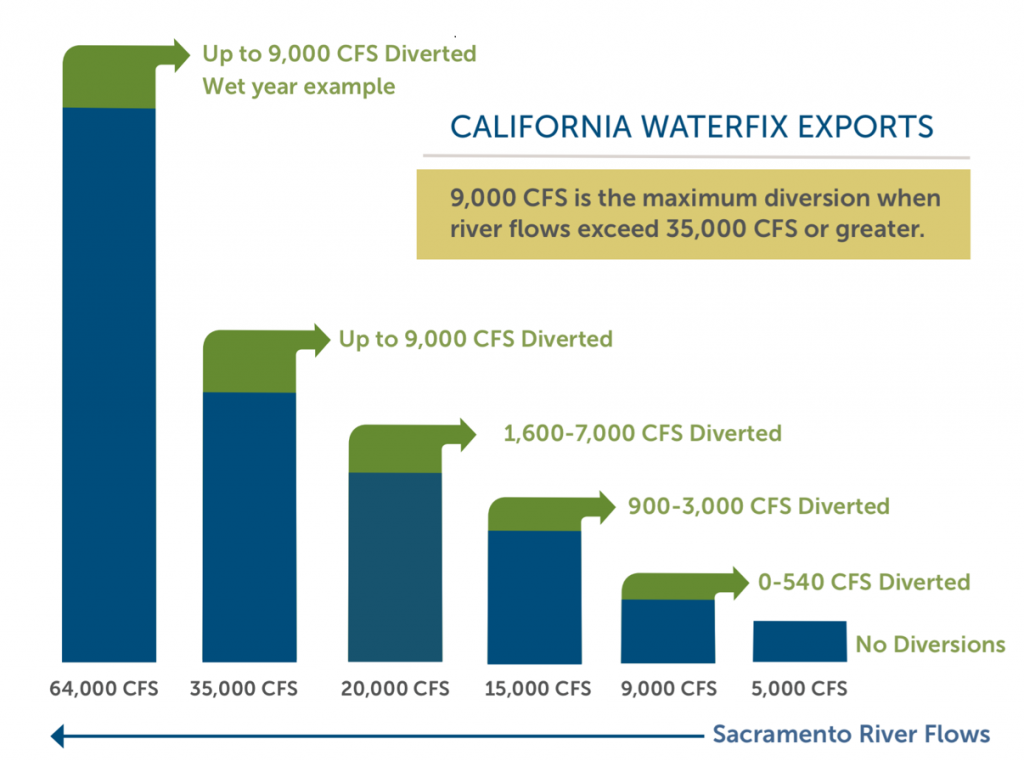
Comment:  This figure shows a commitment to constraint (subject to change under “adaptive management”) at the proposed north Delta diversion.  What it does not show is the ability to increase north Delta exports by increasing reservoir releases or the ability to export water from the south Delta.

Operating Rules

The initial operating criteria for California WaterFix includes regulatory requirements that were established through D-1641, the 2008 and 2009 biological opinions for existing water project operations, and new criteria developed through California WaterFix’s environmental permitting process.

Existing regulatory requirements in the assumed initial operating criteria include:

  • Salinity standards;
  • Spring and fall outflow to manage the overall salinity gradient (known as “X2”);
  • Cross Channel Gate, Suisun Marsh Gate, and temporary agricultural barrier operations;
  • Limits on SWP and CVP diversions to manage flows in Old and Middle Rivers and entrainment;
  • Rio Vista flow.

New regulatory requirements in the assumed initial operation include additional limits on SWP and CVP diversions (i.e., Old and Middle River flow reversals) and flow (i.e., spring outflow, North Delta Diversion Bypass flow). California WaterFix also includes a permanent operable gate at the Head of Old River for fish migration protection and criteria for its operation.

Comment:  All of these rules have been weakened in recent years to maintain water diversions.  All the “rules” for the existing projects operations are in the process of review and face possible change because the ecosystem and listed fish have not been adequately protected.  The proponents of WaterFix have not proposed or evaluated new rules for existing infrastructure and operations or for new infrastructure and operations if WaterFix were constructed.

Water Transfers

The flexibility provided by California WaterFix also improves the capability of moving water transfer supplies across the Delta. The increased conveyance and operational flexibility would significantly increase the amount of available capacity to accommodate the movement of water transfers across the Delta and the SWP and CVP system.

Comment:  Water transfers have significant potential impacts.  Existing constraints would be removed.

Water Quality Standards

The variable split between north and south diversions would allow a flexible and improved approach toward compliance with flow and salinity standards. For example, if salinity increased on the lower Sacramento River, the SWP and CVP could opt to increase diversions in the south Delta and thereby allow greater flow down the lower Sacramento River. In contrast, if salinity increased on the lower San Joaquin River, the SWP and CVP could decrease water diverted in the south Delta and increase diversions in the north Delta, thereby increasing flow in the lower San Joaquin River and south Delta. The flexibility offered by this example would limit reverse flows in the central Delta near Jersey Point, which in the past have drawn saltier water from the San Francisco Bay into the central Delta.

Comment:  None of these assumptions are true.  Lower Sacramento River flows are affected by south Delta diversions.  North Delta diversions would affect Jersey Point reverse flows on the lower San Joaquin River because less water would pass through Georgiana Slough and the Delta Cross Channel. The Delta Outflow Index would remain the same whatever the split.

With California WaterFix, the SWP and CVP would continue to meet existing Delta water quality, fishery objectives, and any future regulatory requirements. Increased diversion flexibility afforded through the approval of California WaterFix would only enhance the capabilities of SWP and CVP projects to meet existing Bay-Delta requirements. Because California WaterFix can take advantage of opportunities to divert and store wet-period storm flows and allow for south Delta diversions in drier periods, in-Delta water quality can be better managed. As a result, the proposed California WaterFix operations would continue to be as protective, if not more, of existing beneficial uses.

Comment:  How does MWD know what future requirements will be, let alone whether the Projects can  meet them or the water supply cost of meeting them?  Allowing continued south Delta exports in dry periods has been the heart of Bay-Delta problems for many decades.  Most wet-period storm flow is stored in Valley reservoirs; that remaining has been allocated for the Bay.  There are no proposed changes in infrastructure or operations that would make WaterFix more protective of existing beneficial uses.

Record Low Spring Chinook Salmon Run

Recent reports1 speak to record low salmon runs in the Sacramento River Valley, including spring-run Chinook in the Feather River. In May, I described the Feather spring-run population dynamics.2 The run is primarily a hatchery run that benefits from trucking to the Bay. The 2017 Feather spring-run stands out as poor in the long term patterns (Figures 1 and 2). A lot happened this past year in the Feather with many ramifications to the spring run. Poor flows and water temperatures in late spring likely contributed to the poor run compared to wet year 2011 (Figures 3 and 4). High water temperatures (>20oC; 68oF) in 2017 likely hindered the late spring component of the adult spring-run migration and subsequent over-summer survival. Poor conditions in drought years 2014 and 2015 during the winter-spring rearing season likely also contributed by reducing survival of hatchery smolts released in 2014 to the river (0.16%3) compared to those trucked to the Bay (0.24%).

So how might future runs be improved?

  1. Improve lower river flows and water temperatures when hatchery smolts are released into the river in April. Under wet conditions in 2010 and 2011, contributions from river smolt releases were 2 to 3 percent, 10 to 20 times the contribution in drier years.4
  2. If dry conditions cannot be avoided, then truck smolts to the Bay. In addition, barging smolts to the Golden Gate should be considered – barged fall run hatchery smolt contribution in drier year 2012 was 3.5% compared to 0.3% for the 1.2 million river-released smolts and 1.2% for 1 million trucked smolts. 5
  3. Maintain water temperature during the spring adult migration within the 20oC water quality standard. Often, Verona through lower Feather River water temperatures exceed 20oC in spring, putting adult spring-run at risk. Water temperatures should not be above 18oC (65oF).

Finally, given the poor conditions from 2015 to 2017, and thus expected poor runs in 2018-2020, every effort need be made in these coming years to turn around the downward trend if the Feather spring run is to remain viable. The run remains an essential component of the Central Valley ESA-listed spring-run Chinook salmon ESU (Evolutionary Significant Unit).

Figure 1. Feather River spring-run Chinook salmon escapement (run size) from 1975-2017.

Figure 2. Recruit-per-spawner relationship for Feather River spring-run salmon (log10-2 transformed) for years 1978-2017. Note that 2017 represents recruits from 2014 spawners.

Figure 3. Water temperature and river flow in lower Sacramento River at Verona just downstream of mouth of Feather River in spring 2017. Source: USGS.

Figure 4. Water temperature and river flow in lower Sacramento River at Verona just downstream of mouth of Feather River in spring 2011. Source: USGS.

Enhancing Oroville Hatchery Salmon Contribution

In a recent post, I discussed ways to increase returns/survival of the Coleman (Battle Creek) Hatchery produced smolts released to the Sacramento River and the Bay. In this post I focus on ways to improve returns/survival of young salmon produced at the Oroville (Feather River) Hatchery. Trucking smolts to the Bay in drier water years and releasing spring flow pulses in wetter years remain the key management actions for increasing the contribution of hatchery salmon to coastal and river fisheries. Timing of releases is also critical. While overall returns are highly influenced by ocean conditions, active management by hatchery managers (trucking, barging, and timing of releases) and water managers (flow pulses) are important tools in maximizing the contribution of hatchery smolts to salmon populations.

In a prior post, I discussed general means of increasing hatchery contributions. In that post, I presented a summary of Oroville (Feather River) Hatchery returns for brood years 2008-2012 (Figure 1). Return rates were highest for brood years 2009-2011, with winter-spring normal-wet year designations (water years 2010-2012). Brood year 2008 and 2012 smolts were released in winter-spring of drought years.

In this post I provide information from earlier brood years. This information supports a more specific strategy to increase the Feather River hatchery program’s contribution to California fisheries. Below, I add a summary of returns from selected brood years (2002-2007).

Figure 1. Feather River hatchery fall-run salmon return rates by release method for brood years 2008-2012 (release years 2009-2013). Source of data: http://www.rmpc.org/

Brood Year 2002

Hatchery smolt returns for brood year 2002 were good, with hatchery releases in the above-normal water year 2003. The good adult return performance is generally attributed to good river and ocean conditions in 2003. A closer look at release return rates (Figure 2) shows generally good returns (>1%) reflecting the good river and Delta conditions in 2003 and good ocean conditions, at least in 2003. Some return rates were very good (>2%), including late April to mid-May returns for Delta and Bay (non-pen) releases. The higher return rates occurred coincident with a late-April through mid-May flow pulse (Figure 3). During the flow pulse, releases to the Delta had return rates in the same high range as Bay releases. Most of the river releases had low rates of return (<1.0%) before the flow pulse; while during the pulse, most rates were 1.0-1.7%.

Figure 2. Feather River hatchery fall-run salmon return rates by release method for brood year 2002 (release year 2003). Source of data: http://www.rmpc.org/

Figure 3. Water temperature and mean daily river flow in the lower Sacramento River channel of the Delta at Freeport in spring 2003. (USGS chart)

Brood Year 2003

Hatchery smolt returns for brood year 2003 were mediocre. The juvenile salmon were released in the below-normal water year 2004. The poor performance is generally attributed to poor river conditions in 2004 and poor ocean conditions in 2004-2006. A closer look at release return rates (Figure 4) shows few good returns (>1%); this reflects the poor river and ocean conditions. Some Bay-release return rates were good (>1%). The higher Delta-release and Bay-release return rates occurred with higher early-to-mid April flows (Figure 5). May river releases had near-zero rates of return. Overall, Bay-release return rates (all with net pens) far outperformed Delta and river releases, reflecting the advantage of bypassing poor river and Delta conditions after mid-April in 2004.

Figure 4. Feather River hatchery fall-run salmon return rates by release method for brood year 2003 (release year 2004).

Figure 5. Water temperature and mean daily river flow in the lower Sacramento River channel of the Delta at Freeport in spring 2004. (USGS chart)

Brood Year 2004

Hatchery smolt returns for brood year 2004 were poor despite the fact that juvenile releases took place in the above-normal water year 2005. The poor performance is generally attributed to poor ocean conditions in 2005-06. A closer look at release return rates (Figure 6) shows poor returns (<1%) reflecting the poor ocean conditions. Some return rates were extremely poor (<0.01%). Compared to good return rates of 1-4% in other years (see Figure 1), these rates are extremely low. For example, a normal annual release of 4 million smolts from the Oroville Hatchery would return 40,000 adults at 1% and only 400 at 0.01%. A closer look at Figure 6 release rates and water conditions in spring 2005 (Figure 7) indicates higher survival of releases into the Feather River and Bay during the May flow pulse, although Bay release rates (all net pens) averaged twice those of river releases.

Figure 6. Feather River hatchery fall-run salmon return rates by release method for brood year 2004 (release year 2005).

Figure 7. Water temperature and mean daily river flow in the lower Sacramento River channel of the Delta at Freeport in spring 2005. (USGS chart)

Brood Year 2005

Brood Year 2005 releases in the very wet year 2006 had return rates that were very poor for both Delta and Bay releases, reflecting very poor ocean conditions (no chart shown). Delta releases averaged 0.1 % return, with Bay releases (no pens) only slightly higher at 0.2 %. These low rates, along with similar low rates from other Central Valley hatcheries, contributed to the salmon fishery collapse of 2008.

Brood Year 2006

Hatchery smolt returns for brood year 2006 were poor (Figure 8). The poor performance is generally attributed to poor river, Delta, and Bay conditions in the 2007-2009 drought, and mediocre ocean conditions. Many return rates were very poor (<0.1%). Some of the higher returns came from earlier releases (April), when Delta inflow was higher and water temperatures were lower (Figure 9).

Figure 8. Feather River hatchery fall-run salmon return rates by release method for brood year 2006 (release year 2007).

Figure 9. Water temperature and mean daily river flow in the lower Sacramento River channel of the Delta at Freeport in spring 2007. (USGS chart)

Brood Year 2007

Hatchery smolt returns for brood year 2007 were generally poor (Figure 10). The poor performance is generally attributed to poor river, Delta, and Bay conditions in the 2008-2009 drought, and relatively poor ocean conditions, except in 2010. Many return rates were very poor (<0.1%). Some Bay pen release return rates were good (>1.0%). Most of the lower return rates came from May river releases under poor conditions (Figure 11). Bay pen release return rates were generally substantially higher than non-pen Bay releases during May.

Figure 10. Feather River hatchery fall-run salmon return rates by release method for brood year 2007 (release year 2008).

Figure 11. Water temperature and mean daily river flow in the lower Sacramento River channel of the Delta at Freeport in spring 2008. (USGS chart)

Summary and Conclusions

In summary, return rates from Oroville Hatchery fall-run salmon smolt releases vary greatly with ocean, river, Delta, and Bay conditions, within and among years. With up to 6 to 8 million fall-run smolts released each year, highly variable return rates result in highly variable catches of adult fish in coastal and river fisheries and spawner escapement to rivers and hatcheries. Good years can yield 1 or 2 percent total returns – producing 60,000-160,000 adult salmon returns. Poor years may yield only 0.1% or less – just 6,000-16,000 adult returns. Factors affecting the return rate include:

  1. Ocean conditions.
  2. River, Delta, and Bay conditions.
  3. Release location – Feather River, lower Sacramento River below mouth of Feather, north Delta, San Pablo/North Bay, and coastal bays north and south of San Francisco.
  4. Release method – trucked to river, Delta, or Bay boat ramps for direct release, trucked to acclimation pens in Delta or Bay, or trucked to feeding pens in coastal bays.
  5. Age/size of released smolts – February through July: early spring smolts, normal spring smolts (mid-April to mid-May), and advanced late spring smolts (mid-May to mid-June). Late spring releases are limited to the Bay because the rivers and Delta are too warm.
  6. Date of release – winter release of hatchery fry and fingerlings, spring release of smolts, late spring and summer release of advanced smolts.

The following actions by hatchery and resource managers can enhance returns to a limited extent, depending on conditions.

  1. Trucking to lower Sacramento River, Delta, Bay, or coastal bays.
  2. Acclimating trucked fish in pens prior to release.
  3. Timing releases to best available release conditions.
  4. Enhancing release conditions (e.g., flow pulses).
  5. Barging smolts to the Bay from the lower Feather River.

The most problematic situation for managers is improving returns in years with very poor ocean conditions (e.g., 2006). Under such conditions, trucking to Bay pens appears to be the best option and is the present management scheme. Barging smolts to the Bay may provide an added benefit. Under good ocean, Bay-Delta, and river conditions, releases to river and Delta locations with a supplemental flow pulse may provide good returns. Releases to lower Feather River locations generally provide poor returns regardless of conditions.

A further enhancement option is rearing hatchery fry in floodplain rice fields adjacent to the lower Feather River. Besides the obvious benefit of “natural” rearing, high growth would allow smolt release at least a month earlier than hatchery smolts. Such natural smolts could be trucked or barged to the Bay from near the rearing sites. A return rate of 5-10% from such smolts is conceivable, with the potential of contributing substantially to coastal and inland salmon fisheries.

Delta Smelt Population Dynamics

Introduction

The population dynamics of the San Francisco Bay-Delta estuary’s endangered Delta smelt can be viewed using patterns in annual indices of their abundance published by the California Department of Fish and Wildlife (CDFW). Indices of abundance are available from the Fall Midwater Trawl and Summer Townet surveys over the past five decades. Since Delta smelt have a short one to two year lifespan, they readily lend themselves to spawner-recruitment (S/R) analyses that help define the population dynamics of the species.

This report employs S/R analyses to review long-term trends in the population indices of the Delta smelt. The analyses support the hypotheses that abundance (adult numbers) and recruitment into the adult population are primarily controlled by the numbers of adult spawners, adjusted by wet-dry year differences in production of juveniles. In other words, the population abundance from year to year is determined by the number of eggs laid each year and the survival of each egg cohort to adults a year later.

Annual Indices of Delta Smelt Abundance and Recruitment

The long-term trends in Delta smelt reflected in the CDFW annual indices of summer and fall survey catch show dramatic declines over the past five decades (Figures 1 and 2). In the Summer Townet (STN) Index (Figure 1), the most obvious population declines are in the early 1980’s and the mid-2000’s. The Fall Midwater Trawl (FMWT) Index (Figure 2) highlights several key periods of population change: 80-83, 88-91, 00-05, and 09-13.

Figure 1. Delta smelt Summer Townet Index (1959-2016). Data source: CDFW

Figure 2. Delta smelt Fall Midwater Trawl Index (1967-2016). Source: CDFW

Spawner-Recruit Analyses

In this report I break down these indices by depicting three relationships: fall adults to the following summer recruits, summer recruits to following fall adults, and fall adults to following fall adults.

The relationship between the fall index of adult spawners to the index of juveniles the following summer is shown in Figure 3. Note the strong positive and highly significant relationship between the numbers of fall adult spawners and the numbers of juveniles that survive to the following summer. This relationship is indicative of the strong role the number of adult spawners (egg production) has on recruitment into the population. Note also the generally lower recruitment-per-spawner in drier years (red years), which is likely the result of a complex of factors related to Delta inflow/outflow and the export of water from the Delta. The population tends to expand (up to 10-fold, one log10 level) with the higher recruitment-per-spawner in wet years and tends to contract with the lower recruitment-per-spawner in dry years. There is also a strong pattern of reduced abundance in the past three decades, starting with a sharp decline in recruits per spawner in the 80’s and 90’s often attributed to the proliferation of exotic clams, the 2001-05 period often referred to as the Pelagic Organism Decline (POD), and the drought periods of 2007-09 and 2012-15.

A closer look at these patterns in Figure 3 indicates possible explanations for the overall 50-year pattern of trending lower numbers of spawners and recruits, and recruits per spawner, over time. In the 70’s, the population expanded initially with the abundant 1970 year-class that featured a high number of recruits-per-spawner, followed by another increase with the strong 1978 year-class. The population was sustained by high recruits per spawner through the wet and dry years of the 70’s. In the 80’s and 90’s, recruits per spawner dropped sharply in drier years, while remaining relatively high in wetter years. A sharp drop in the spawning population occurred after the 1980 fall peak (red 81). In the 80’s and 90’s, the population had matching upward (Group B) and downward (Group A) movements that maintained the population into the early 2000’s (00, 01, and 02). Despite low recruits per spawner in the 87-92 drought, the population rebounded in the wet years from 93 to 99. The population then took a sharp drop from the high fall level in 99 to the much lower level in 04 and the very low recruit-per-spawner year 05. Again, that latter period corresponds to the POD and a drier 00-05 period with four normal and two dry years. There was a sharp uptick in recruitment per spawner in wetter 10-11 (Group C) following the dry years of 07-09, but the population collapsed again with very poor recruitment per spawner in 2012.

The lower recruits-per spawner in drier years can be explained by low Delta outflows and high exports in winter and spring of drier years. This is best exemplified by comparing Groups A and B in Figure 3. The low recruits per spawner in 05, followed by the drought of 07-09, defined the late 2000’s (Group D). A short recovery period in 10-11 (Group C) was crushed by the poor recruits per spawner in the drought period of 12-16. The poor number of recruits in 15-16 (Group E) is simply a lack of spawners (low eggs) and continuing drought conditions.

Figure 3. Groupings A to E in Log vs Log plot (Figure 3) of Summer Index of Delta smelt as related to the previous Fall Index of abundance, by year of summer index. Blue years are wet water years (Oct-Sept). Green years are normal water years. Red years are dry and critical water years. Year types are as determined by the California Department of Water Resources for the Sacramento Eight-River Index.

The relationship between summer juvenile production as reflected in the STN index for the year and survival as reflected in the following fall adult FMWT index is shown in Figure 4. The comparison represents the relative survival between summer and fall, most likely reflecting July-September conditions in the Bay-Delta. The strong positive relationship indicates that the number of juvenile smelt in summer determines in large part the population in the fall, adjusted by summer-fall environmental conditions that can significantly affect survival to the fall. Again, Delta inflow/outflow and exports are likely factors in defining the survival relationship, over and beyond the beginning summer numbers of smelt. As in the previous fall to summer relationship described earlier, summer to fall survival is generally higher in wetter years, with notable exceptions. These exceptions are due mainly to the fact that conditions in the Bay-Delta in many summers, regardless of water-year type, are drought-like: there is often little difference between wet and dry year summer-fall conditions. Note the pattern of falling indices over the five decades of the surveys.

A closer look at the pattern in Figure 5 indicates possible explanations for the overall 50 year pattern of trending lower numbers of fall survivors from summer juveniles, and fall production per summer juvenile production level index over time. In the 70’s, the population was high and remained so through 1982. Reduced summer to fall production from 1976-81 led to a lower 1982 population. The subsequent declines from 1982 to 1985 have been attributed to the 80s clam invasion, although there was no apparent decline in summer to fall survival. Poor summer to fall survival in 2004 led to a sharp downward population shift. Group A is indicative of poor over-summer survival in high-export dry years. Group B represents very wet years when part of the population is distributed below the survey area. Group C represents moderately wet years under low to moderate Delta exports. Group D includes wet years and three dry years with low summer exports. Near zero 2015-16 summer indices led to near zero fall indices, a pattern indicative of recruitment failure, where summer production is so low that only low numbers remain in the fall.

Figure 4. Log vs Log plot of fall FMWT Index of Delta smelt as related to the prior summer STN Index of abundance for that year. Blue years are wet water years (Oct-Sept). Green years are normal water years. Red years are dry and critical water years. Year types are as determined by the California Department of Water Resources for the Sacramento River runoff to the Bay-Delta Estuary (http://cdec.water.ca.gov/cgi-progs/iodir/WSIHIST ).

The plot of LogFall to following LogFall indices (Figure 5) indicates strong recruitment in wet years and poor recruitment in dry years. While the prior year or starting abundance remains the dominant factor as in the above relationships, generally higher recruits-per-spawner occur in wet years and lower recruits-per-spawner occur in drier years. The poor recruitment years (81, 05, and 12) led to sharply negative population shifts. Multi-year droughts 07-09 and 12-15 also led to declining year-to-year population levels. Good recruitment years (e.g., 70, 93, 95, and 11) led to strong positive population recruitment.

Figure 5. Log vs Log plot of fall FMWT Index of Delta smelt (recruits) vs previous fall index (spawners). Blue years are wet water years. Green years are normal water years. Red years are dry and critical water years. Year types are as determined by the California Department of Water Resources for the Sacramento River runoff to the Bay-Delta Estuary (http://cdec.water.ca.gov/cgi-progs/iodir/WSIHIST ).

Summary

The population dynamics of Delta smelt are characterized by a strong positive spawner-recruit relationship, modified by wet-dry year conditions. Dry year sequences drive population abundance down, hindering future abundance levels. Wet years generally lead to higher recruitment per spawner. The number of spawners remaining in 2017 may be too low to sustain the population and bring about recovery without extraordinary positive measures such as improved flow conditions, reduced exports, and/or stocking of hatchery-reared Delta smelt.