Revised Delta Smelt Take Permit

The Interior Department’s US Fish and Wildlife Service (USFWS) issued a memo1 on January 30, 2019 that revised the federal take permit for Delta smelt for the combined operation of the Central Valley Project and the State Water Project. The memo stated:

“It has become clear over the past several years that surveys are reaching their detection limits given the declining population of delta smelt, and in 2018, the FMWT [fall midwater trawl] Index was zero, indicating that the FMWT Index may no longer provide an accurate predictor of incidental take.”

The new take criteria are now the old action criteria of limiting Old and Middle River (OMR) reverse flows during the winter and spring under certain conditions. When smelt would normally be expected to be present, OMR flows would be restricted to being no more negative than -2000 or -5000 cfs. The new “surrogate” criteria essentially keep the south Delta pumping plant operations at status quo until such time as the ongoing reinitiated Endangered Species Act (ESA) consultation is completed and new take permits are issued.

The importance of the rule change is diminished by the fact that Interior (combined action of US Bureau of Reclamation and USFWS) has not enforced the rules to protect Delta smelt. The state of California has also failed to protect Delta smelt as well as California ESA-listed longfin smelt. One only has to review recent early winter information to see this is the case. After the first Delta outflow pulse at the beginning of December 2018, outflow fell to only 4000 through mid-December (Figure 1). High exports (Figure 2) contributed to the low outflow and exceptionally low (negative) OMR flows (Figure 3).

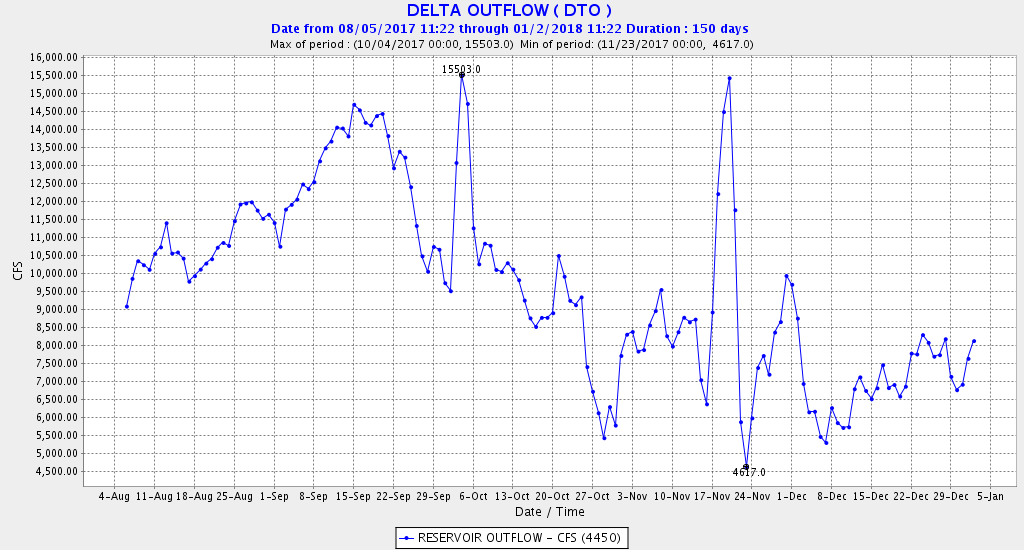
These low outflows and high exports created very high risk conditions for the two smelt species. What few Delta smelt remained were observed in the west Delta (Figure 4). Longfin smelt were spawning in Suisun Bay and the west Delta (Figures 5 and 6).

Smelt are not being protected. The Smelt Working Group mandated under the Federal and State take permits has been inactive and has not provided mandatory guidance. New take permits are needed immediately to protect the two listed smelts. The State Water Board, in revisiting water right permits and water quality standards for the Delta, should also adequately protect the listed smelts. To protect the smelts, the OMR limit for December should have been no more negative than -2000 cfs. The export-to-inflow limit criteria for December should be 35%, not the present 65%. December outflow minimums should be 6000-8000 cfs, not the present 3500-4500 cfs.
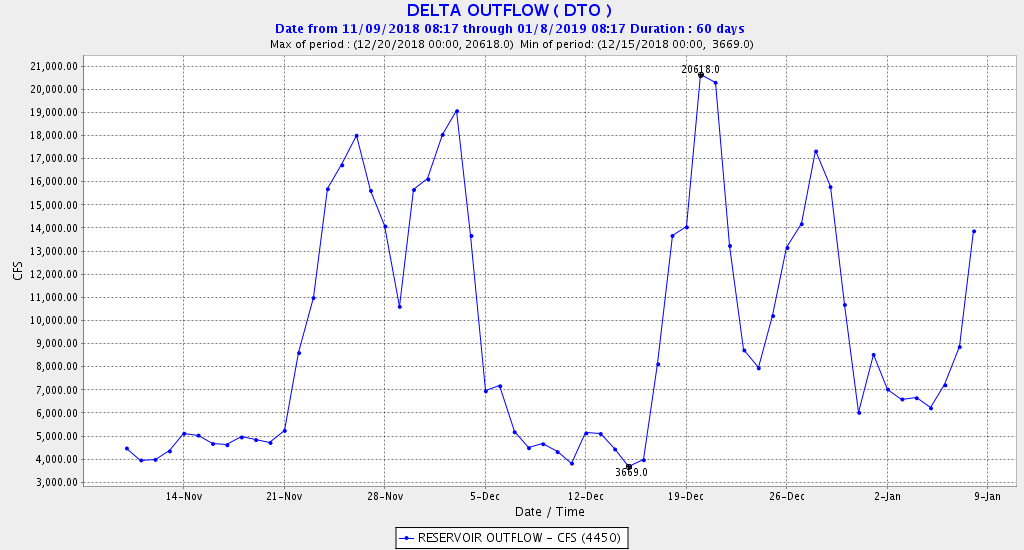
Figure 1. Delta outflow 11/10/18 to 1/8/19. Note very low outflow in early December after initial rainfall pulse.
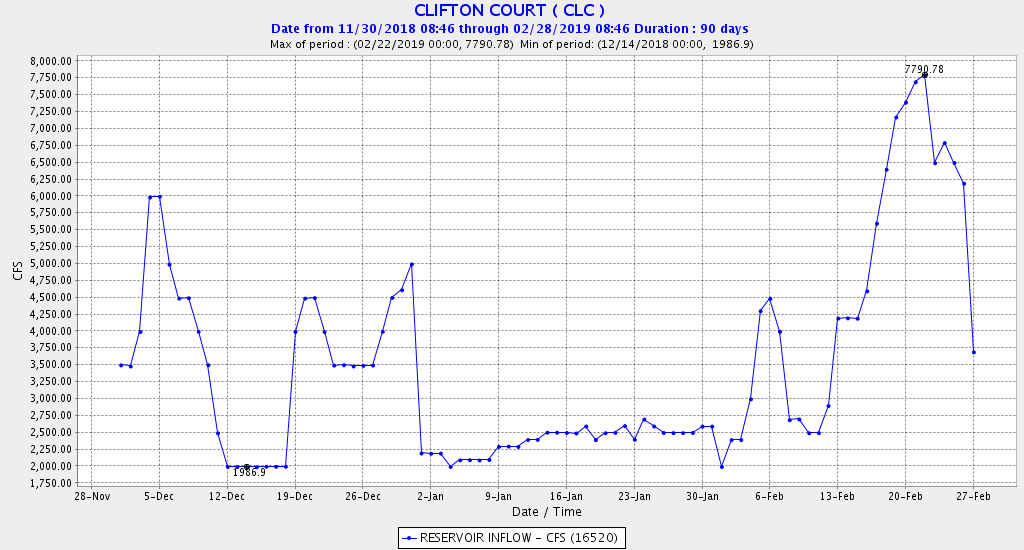
Figure 2. State project exports at Clifton Court December 2018 to February 2019. Federal exports were near maximum (3500-4200 cfs) for most of period.
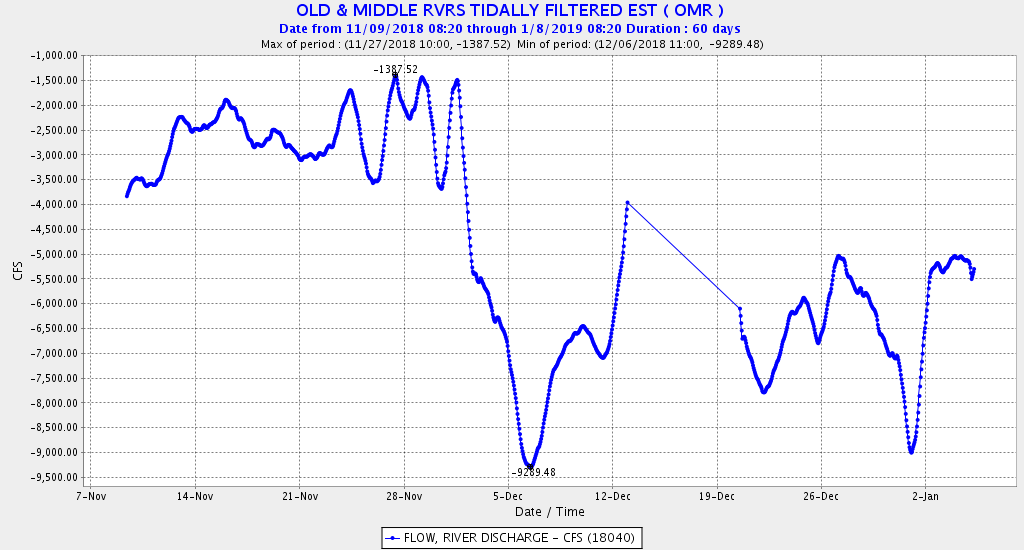
Figure 3. OMR flows November 2018 to January 2019.
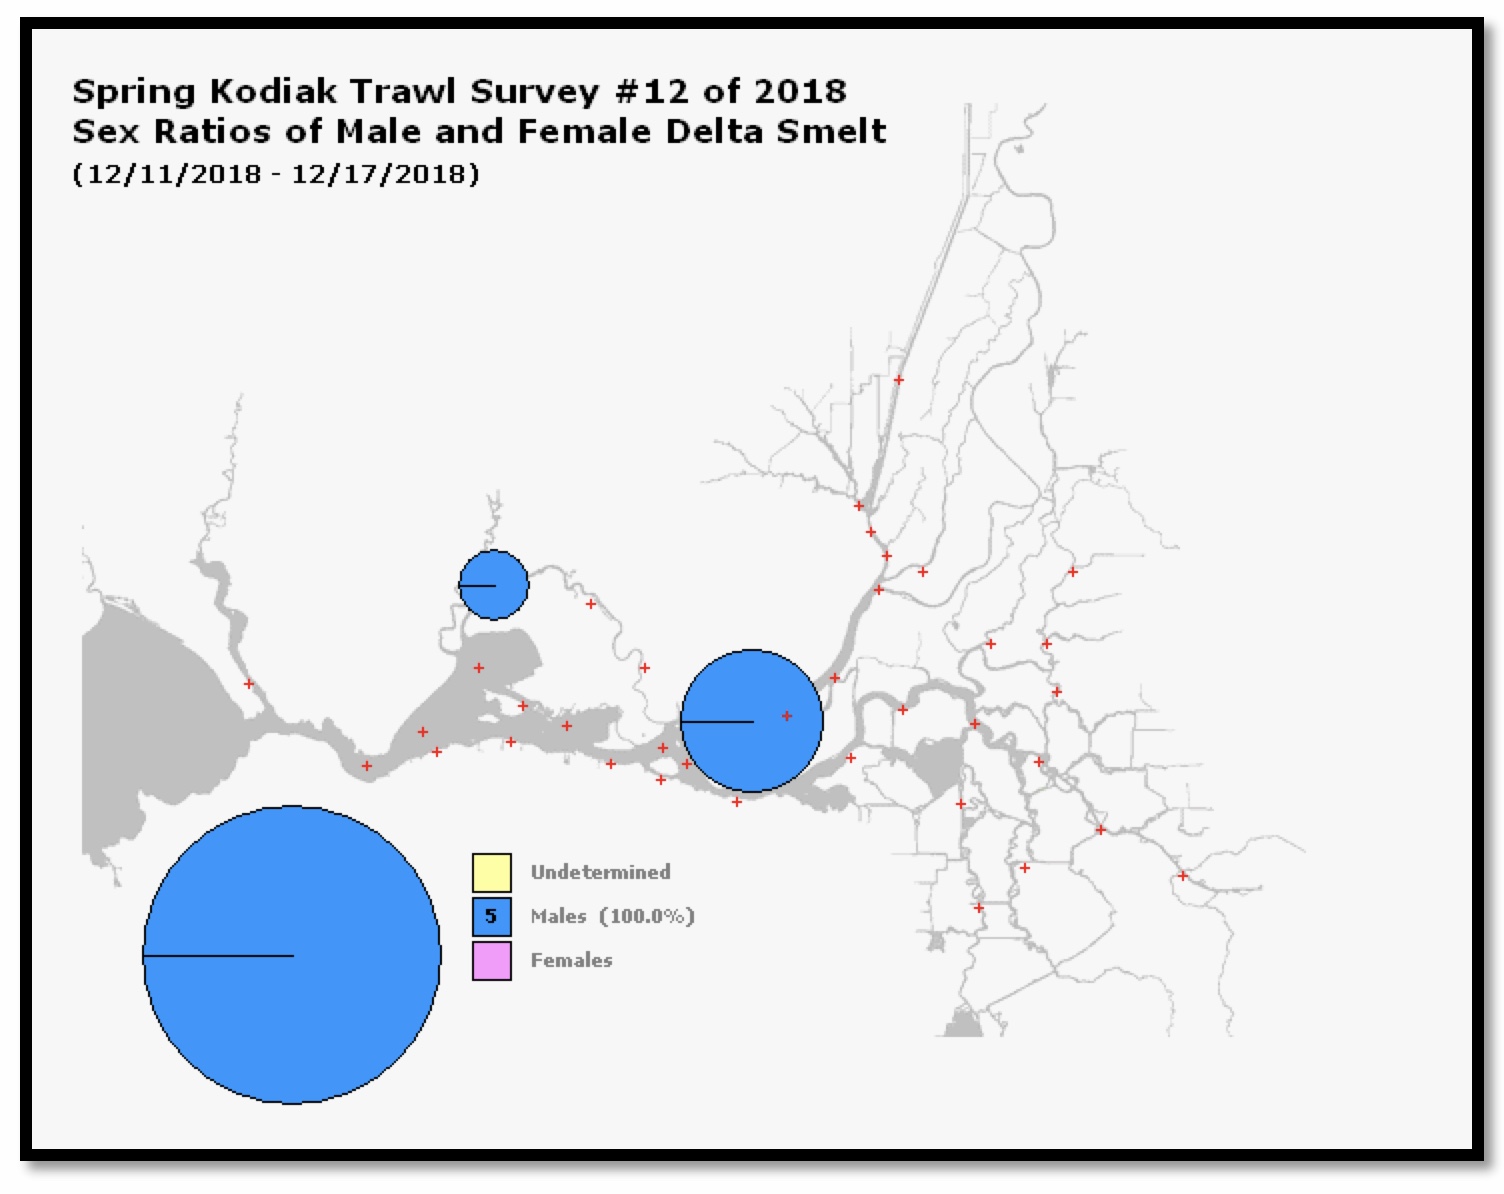
Figure 4. December 2018 Kodiak trawl survey catch of Delta smelt.
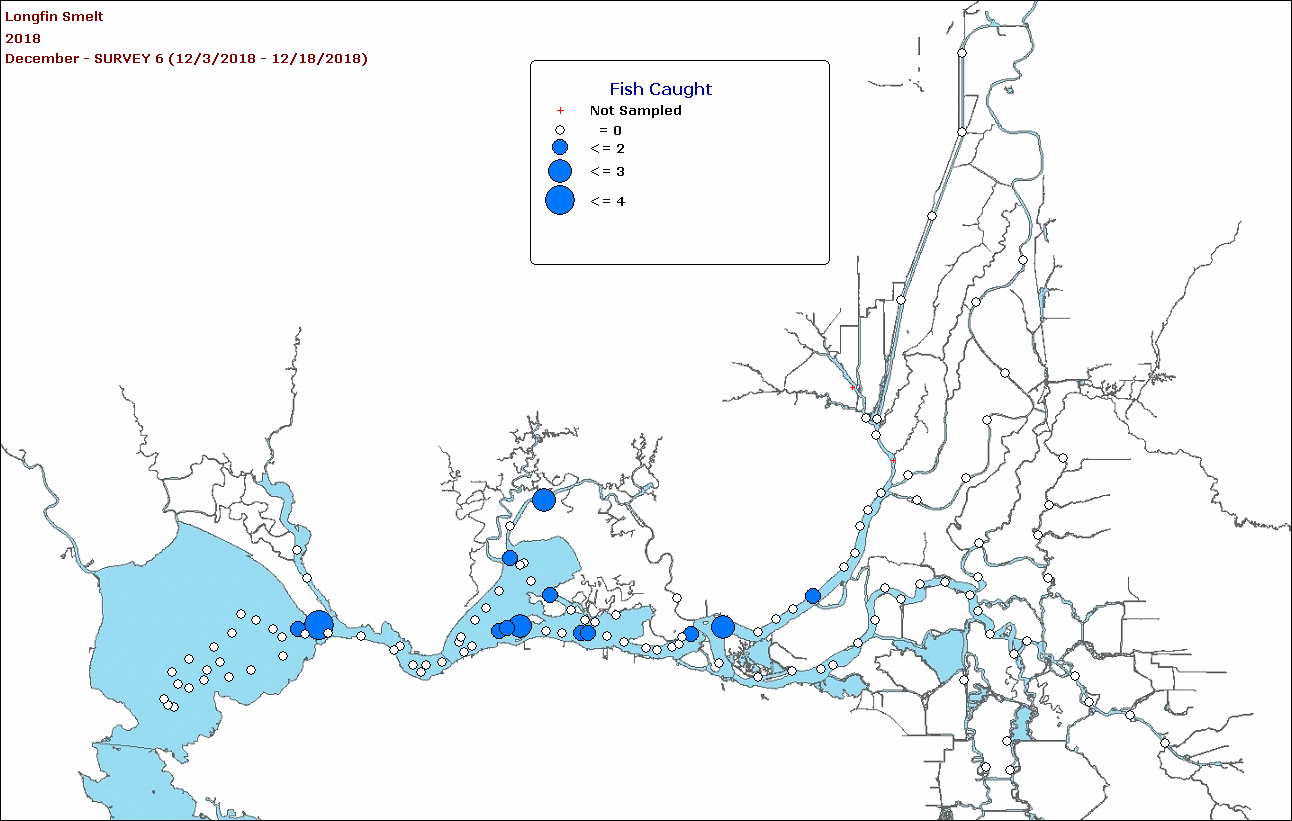
Figure 5. December 2018 midwater trawl longfin smelt catch.
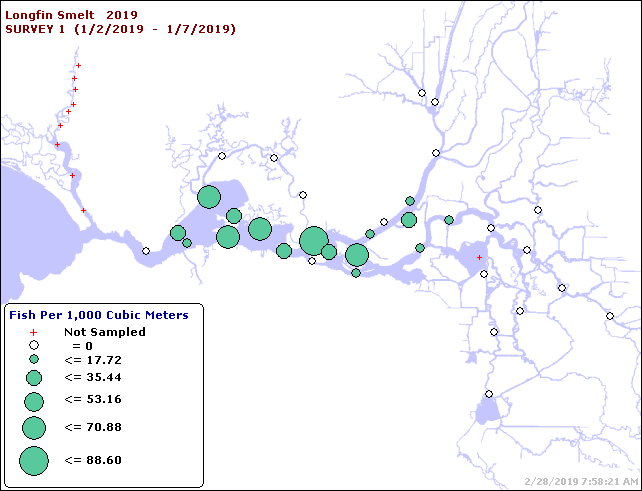
Figure 6. Smelt Larvae Survey #1 for 2019 catch of newly hatched longfin smelt.
Longfin Smelt End of 2018 A Case for Higher Delta Outflow Standards in June

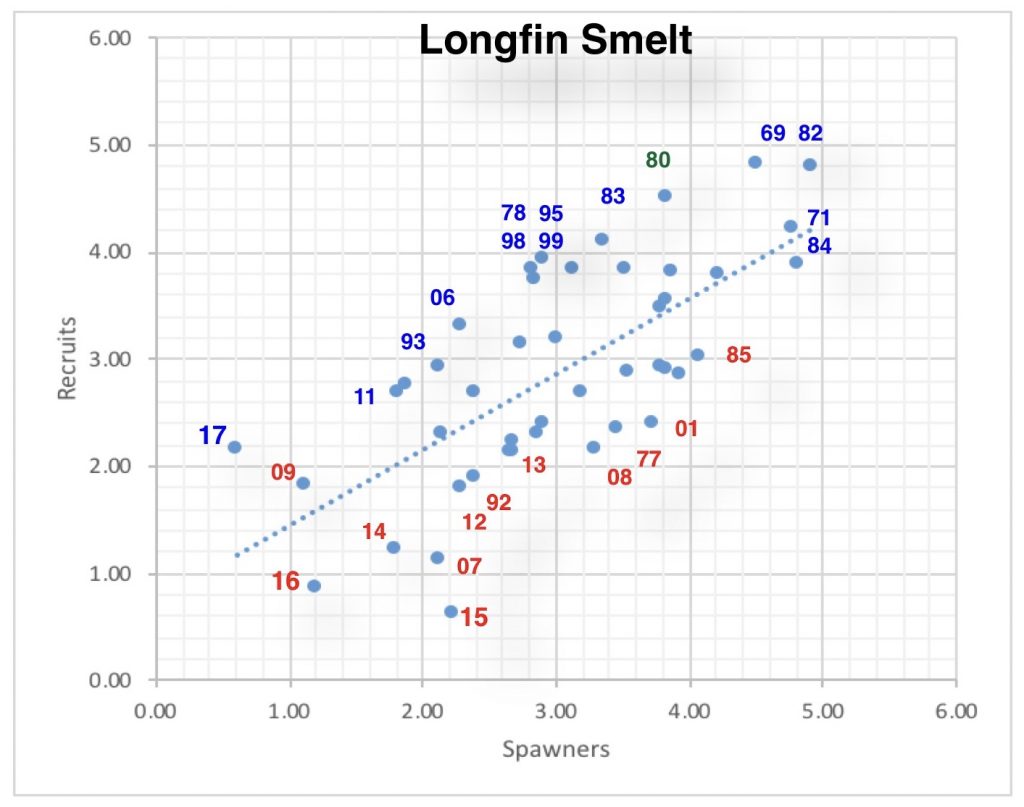
In a February 2018 post I last updated the status of longfin smelt in the Bay-Delta. I showed that longfin smelt have a strong spawner-recruit or stock-recruitment relationship wherein new recruits into the population depend on the abundance of spawning parents (Figure 1). The relationship also indicated a strong influence of water–year type.

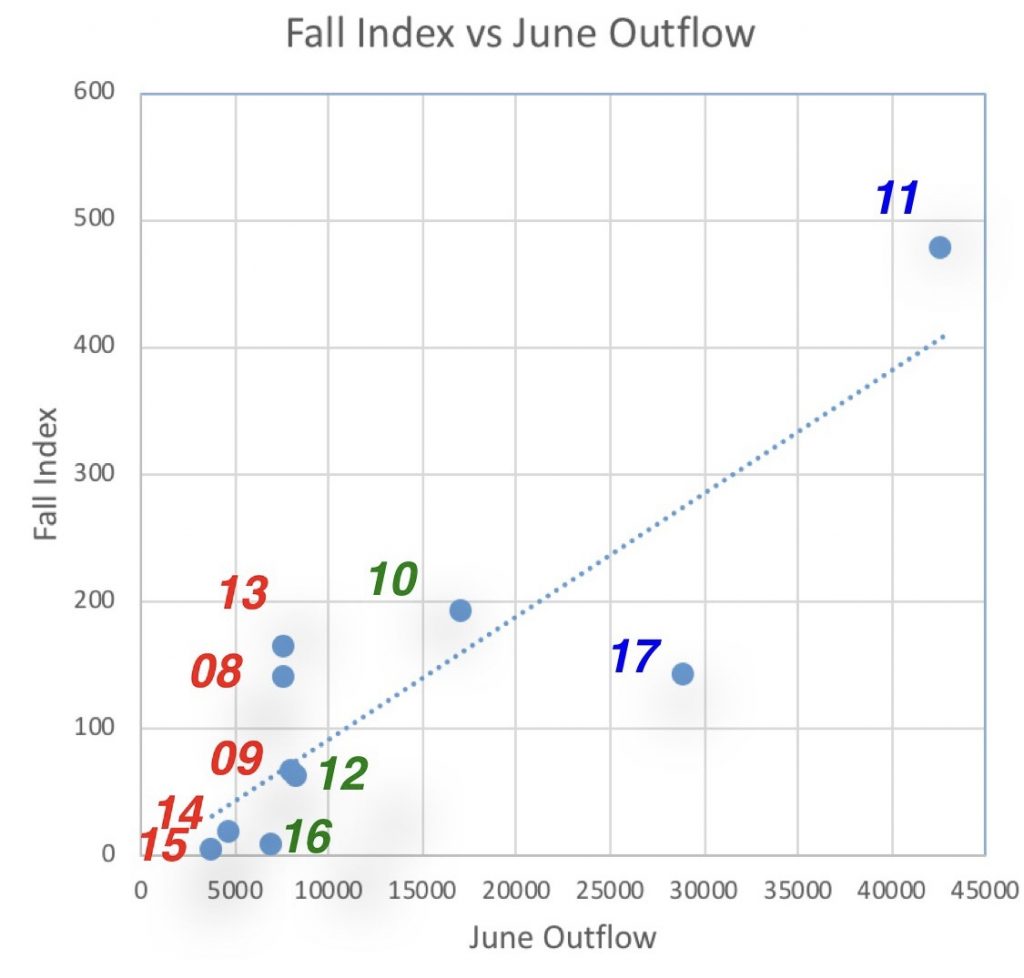
What is it in wetter years that improves survival? What is it about wet years that is important to longfin survival? My analysis is it is the spring Delta outflow, with June likely being important. The fall longfin index is significantly correlated with June outflow (Figure 2). It requires Delta outflows in the 8000-10,000 cfs range to keep the low salinity zone and young longfin in the Bay, west of the Delta and away from the south Delta export pumps and warm low-productivity pelagic habitats.

Present standards (see link, pdf pages 26-27) for June require outflow of 7100 cfs on a 30-day running average. This contrasts sharply with previous June standards under Water Rights Decision 1485 (see link, pdf page 43) which required an average monthly flow of 9500 cfs in some below normal years, 10,700 cfs in Above Normal years, and 14,000 cfs in Wet years. In its ongoing update of the Bay-Delta Plan, the State Water Resources Control Board must account for the importance of the outflow standard for June in protecting Bay-Delta ecological resources.

Figure 1. Longfin Recruits (Fall Midwater Trawl Index) vs Spawners (Index from two years prior) in Log10 scale. Wet years in blue. Dry years in red. Note the progressive decline in recruits in the last three wet years (06, 11, 17). The relationship is very strong and highly statistically significant. Taking into account Delta outflow in winter-spring makes the relationship even stronger. Recruits per spawner are dramatically lower in drier, low-outflow years (red years). Source: http://calsport.org/fisheriesblog/?p=1360.

Figure 2. Fall midwater trawl index for longfin smelt versus average June outflow (cfs) 2008-2017. Wet years in blue. Normal years in green. Dry years in red. Source of data: http://www.dfg.ca.gov/delta/data/fmwt/indices.asp?view=single.


Summer Delta Salinity Standards: 2018 Example

In a July 2016 post I recommended a 500 EC (electroconductivity) salinity standard from July-to-mid-August for the western Delta. The longstanding Water Rights Decision 1641 standard includes this only in Wet years. It should apply in all year types unless south Delta exports are at minimum levels.

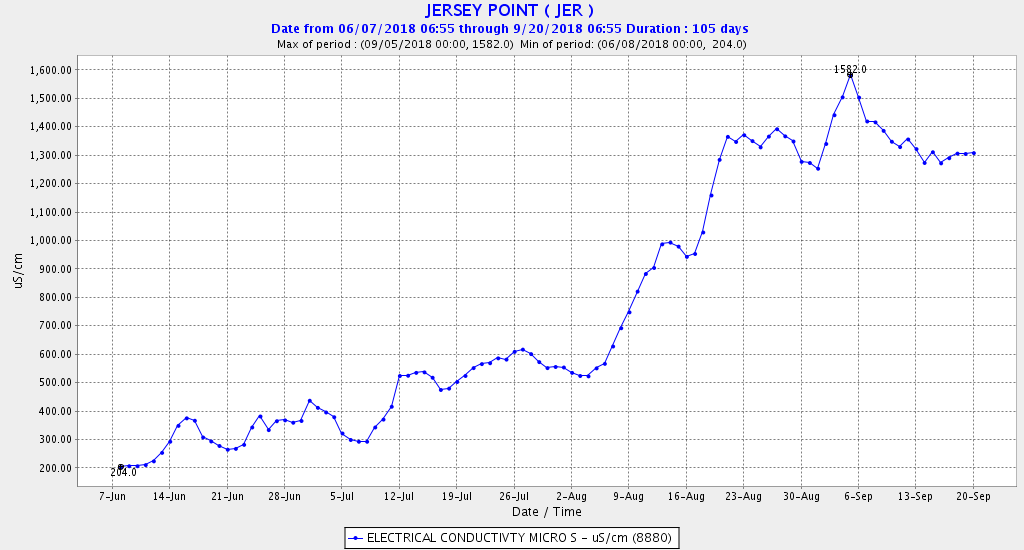
In summer 2018, a Below Normal, subnormal snowmelt year, Jersey Point salinity was kept near 500 EC through early August (Figure 1) instead of the allowed 740 EC. Was this an adaptive management experiment? If so what benefits were derived from the experiment?

Figure 1. Jersey Point salinity (EC) remained near 500 EC in early summer 2018. The applicable standard was 740 EC 14-day average through August 15.

Benefit #1:
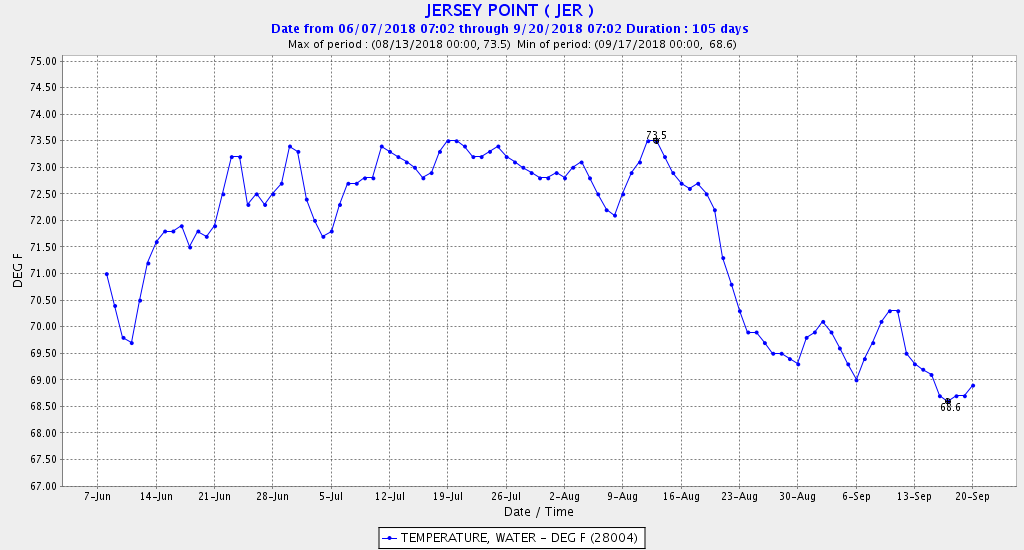
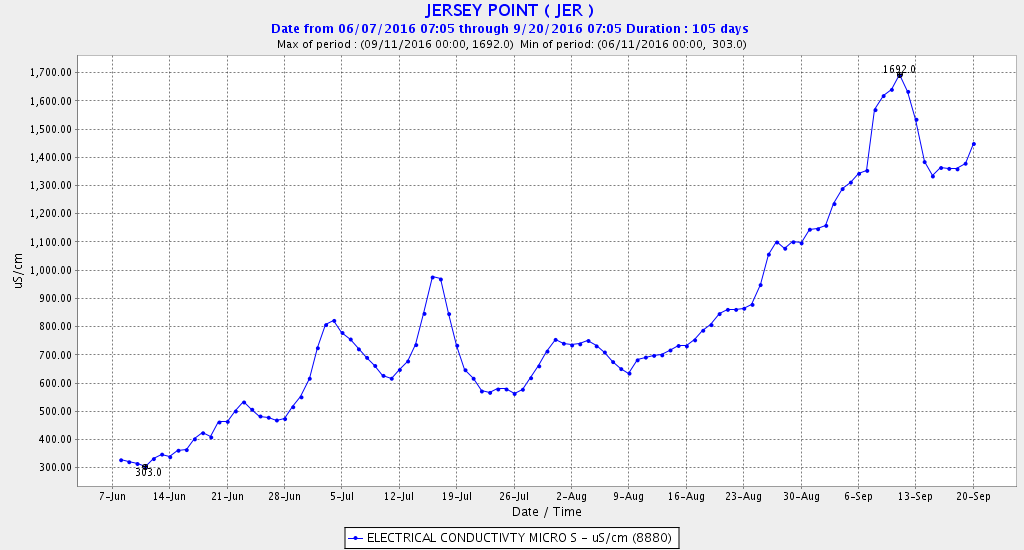
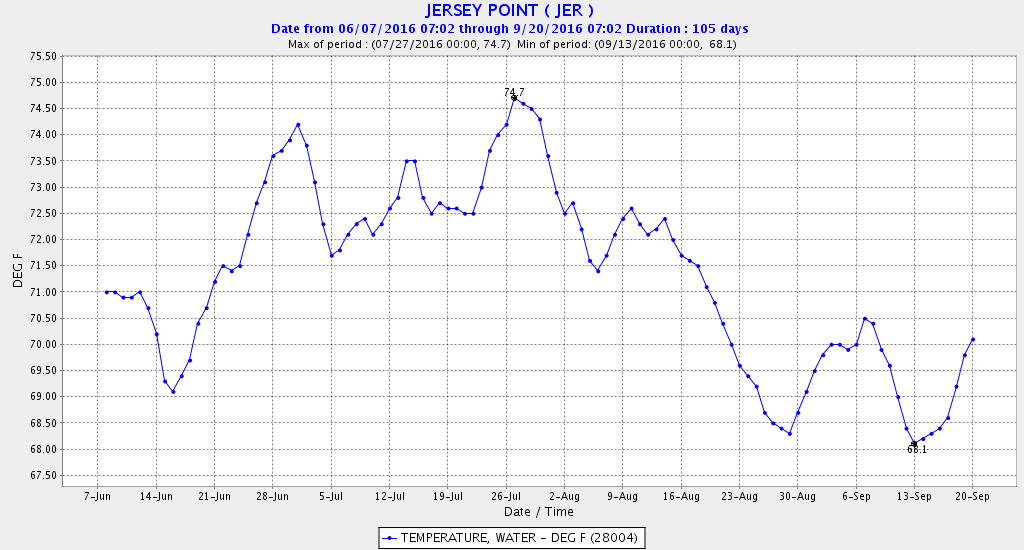
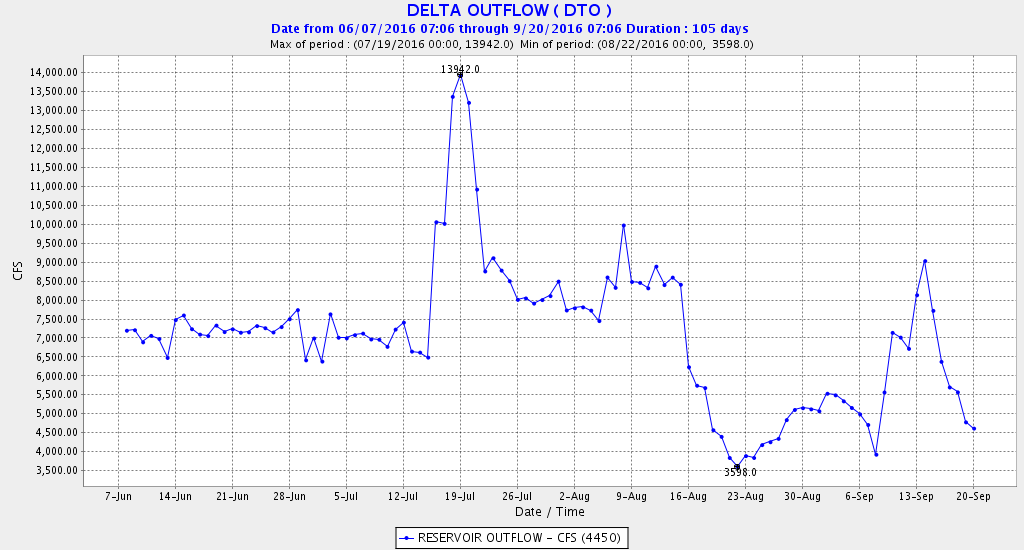
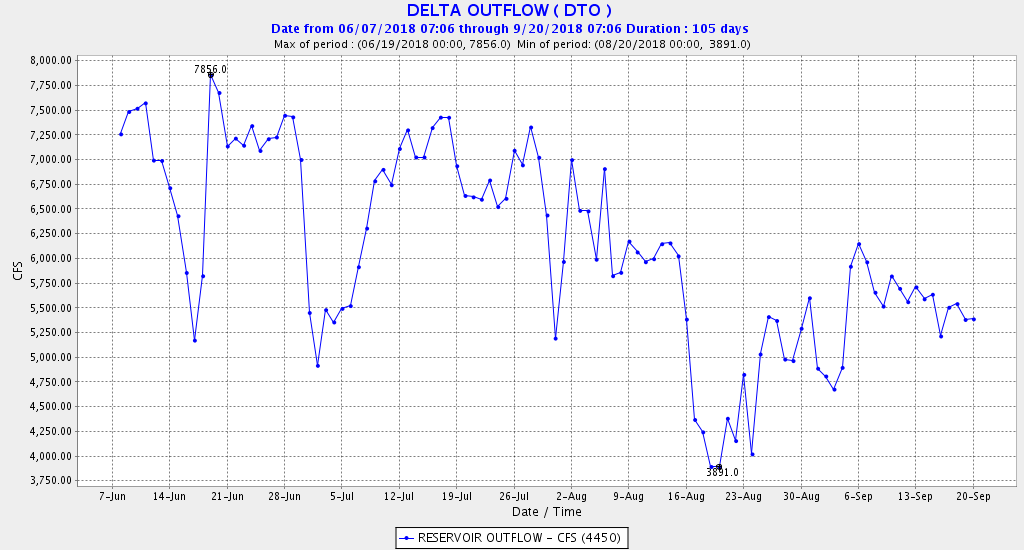
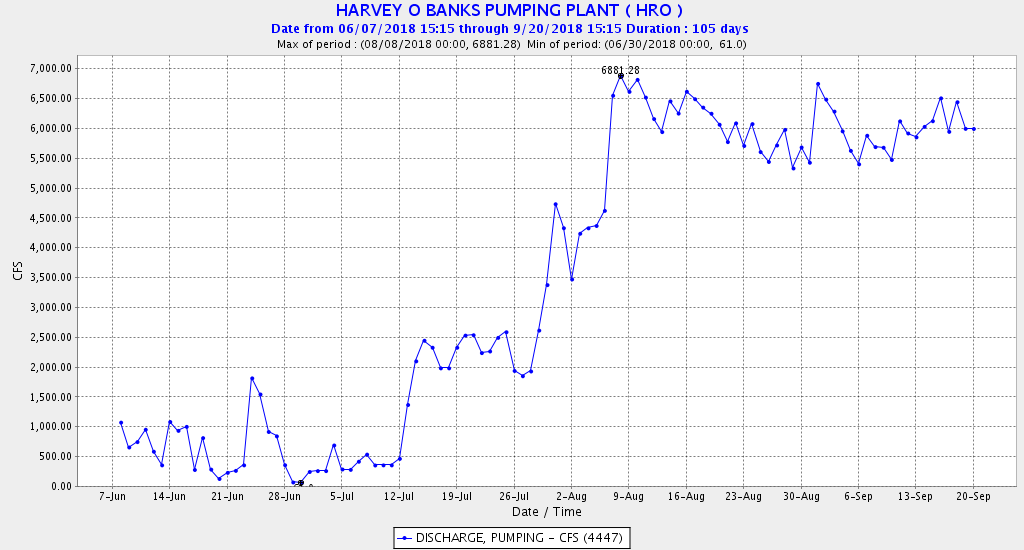
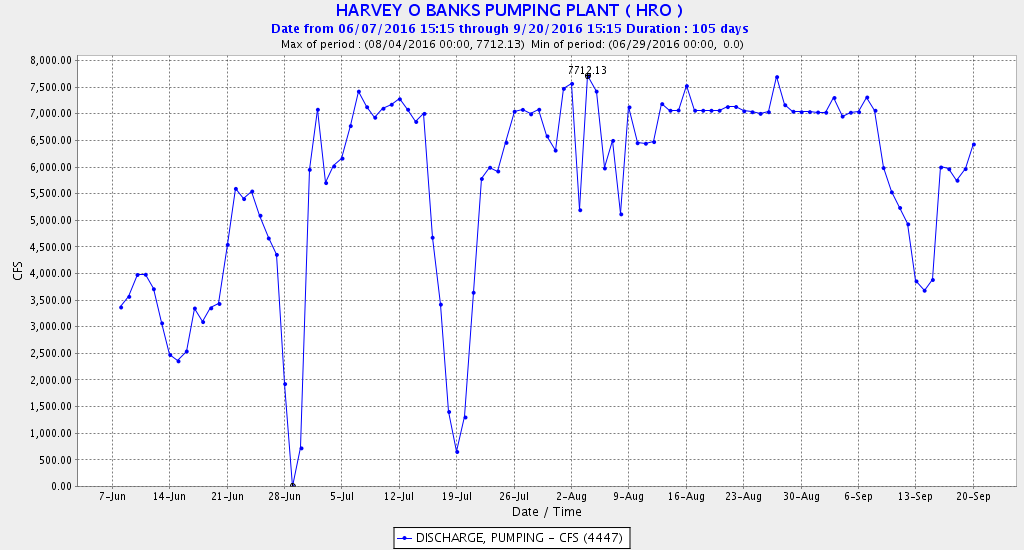
The water temperature in the west Delta in 2018 was kept near 73°F or below (Figure 2), a good thing. In 2016, the previous Below Normal year, EC was allowed above 500 EC (Figure 3) per the existing standard. Water temperature exceeded 73°F to near 75°F (Figure 4), a bad thing, when EC exceeded 500. The reason for the higher early summer 2016 EC and warmer water temperatures was low Delta outflow (Figure 5). Outflow in 2016 was about 7000 cfs, but needed to be near 8000-9000 cfs. In 2018, outflow in late June was 7500-7900 cfs (Figure 6), in part due to relatively low early summer Delta exports (Figure 7) compared with 2016 (Figure 8).

Other Benefits:
It is really too bad that we can no longer look to Delta smelt for response to adaptive management. But I suspect positive response to the 2018 “experiment” occurred in survival of other juvenile Delta fish (e.g., striped bass), shrimp, zooplankton, and phytoplankton. When 2018 data become available, the comparison with 2016 and prior years can be made.

Conclusion:
The salinity standard for the west Delta at Jersey Point and Emmaton should be 500 EC daily average unless south Delta exports are restricted to minimum health and safety levels. The standard should be year-round in all year types. Delta exports should be restricted to the minimum unless the salinity standard is met.

Figure 2. Water temperature at Jersey Point in west Delta summer 2018.

Figure 3. Jersey Point salinity EC summer 2016. Standard was 740 EC 14-day average through August 15.

Figure 4. Water temperature at Jersey Point in west Delta summer 2016.

Figure 5. Delta outflow in summer 2016.

Figure 6. Delta outflow in summer 2018.

Figure 7. State exports from south Delta summer 2018.

Figure 8. State exports from south Delta summer 2016.


Fall Pulsed Flow Protections for Winter Run Salmon Not in 2017 and 2018

It is well known that juvenile winter-run salmon migrate downstream to the Delta from their upper Sacramento River rearing area near Redding/Red Bluff with the first fall-winter flow pulses.1 Protection of this critical migration of winter-run has been recommended in recent Delta proceedings. In the WaterFix petitions process at the State Water Resources Control Board, such protection is referred to as “pulse protection.” So based on the importance of protecting winter-run during this key life-history stage, one would think such protection would have been applied in the fall of our most recent wet year 2017 and below-normal 2018. A quick check of the facts indicates otherwise.

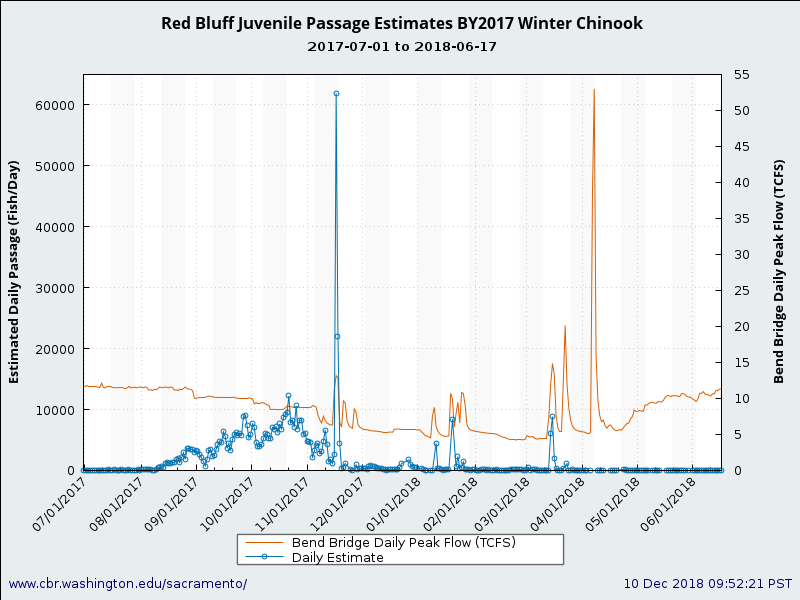
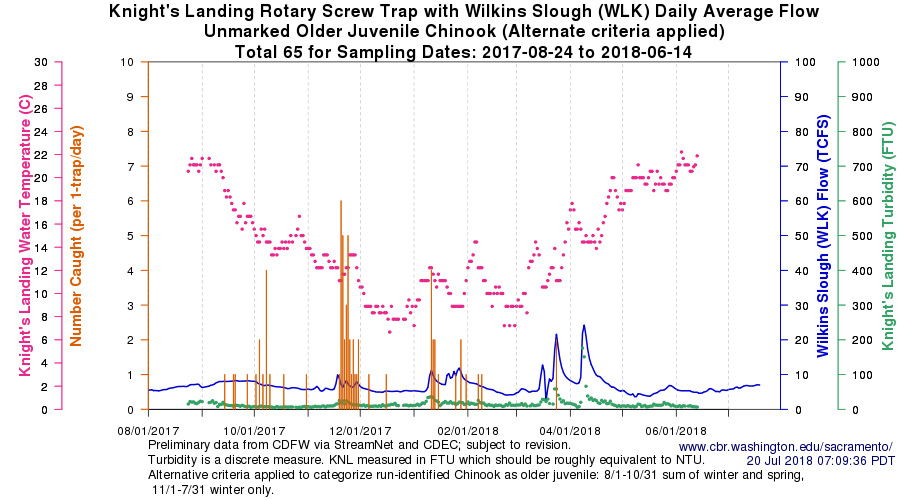
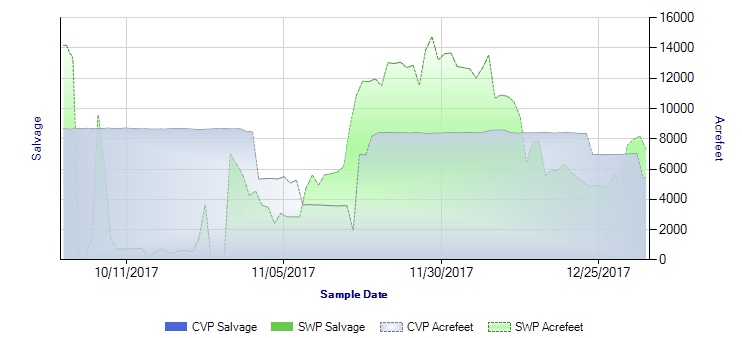
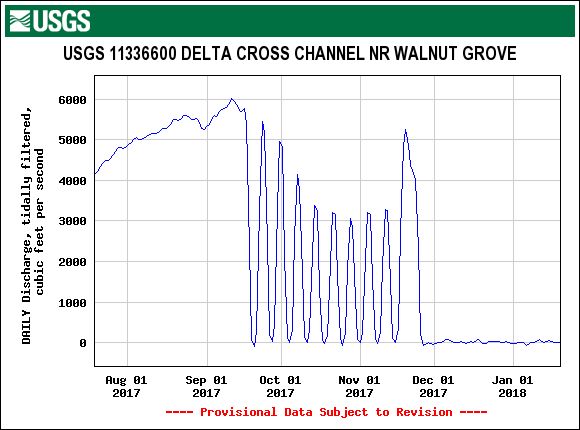
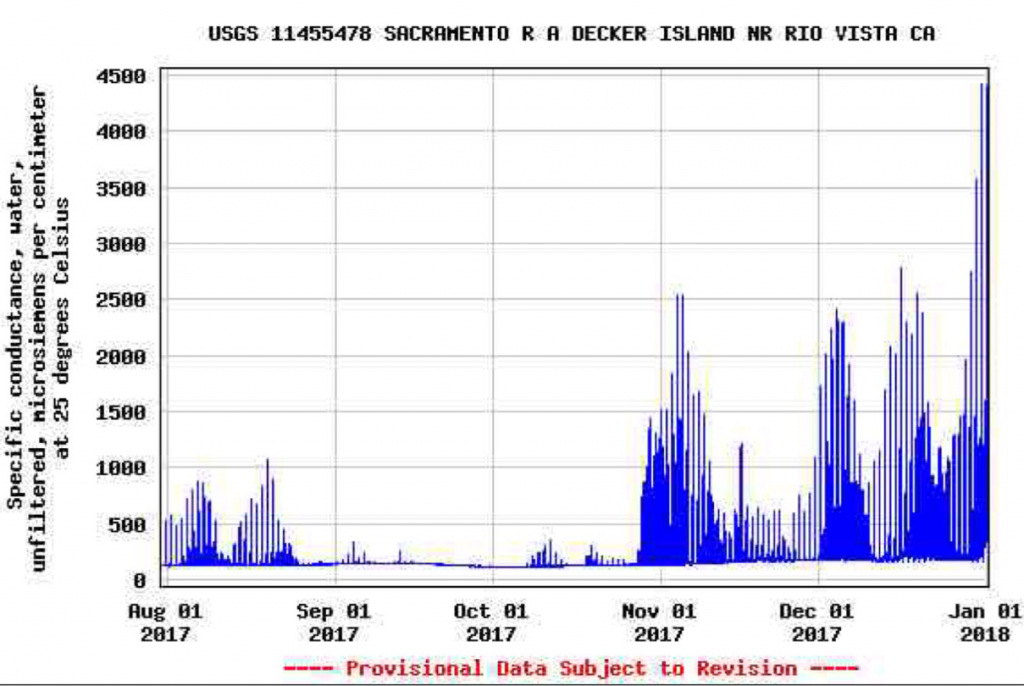
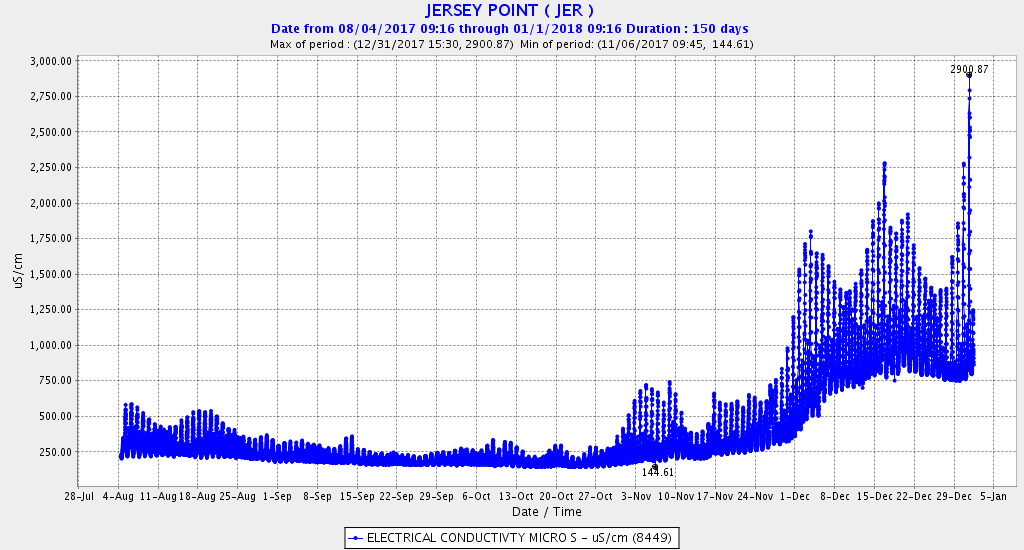
In 2017, the initial pulse of juvenile winter-run salmon passed Red Bluff (rivermile 240) during September and October, prior to any flow pulses (Figure 1). The first major pulses of flow occurred in the latter half of November 2017. A migration spike of winter-run-sized smolts at Knights Landing screw traps (rivermile 90) did occur during the flow pulse (Figures 1 and 2). Instead of protecting these winter run as they were entering the Delta, south Delta exports were increased to take advantage of the available inflow (Figure 3). The increase occurred with the Delta Cross Channel partially open (Figure 4), increasing the risks of migrating salmon to south Delta exports. Other than a four-day pulse, Delta outflow generally declined before and after the flow pulse (Figure 5). Salinity in the lower Sacramento and San Joaquin Delta channel generally increased with the higher exports and lower outflows (Figures 6 and 7).

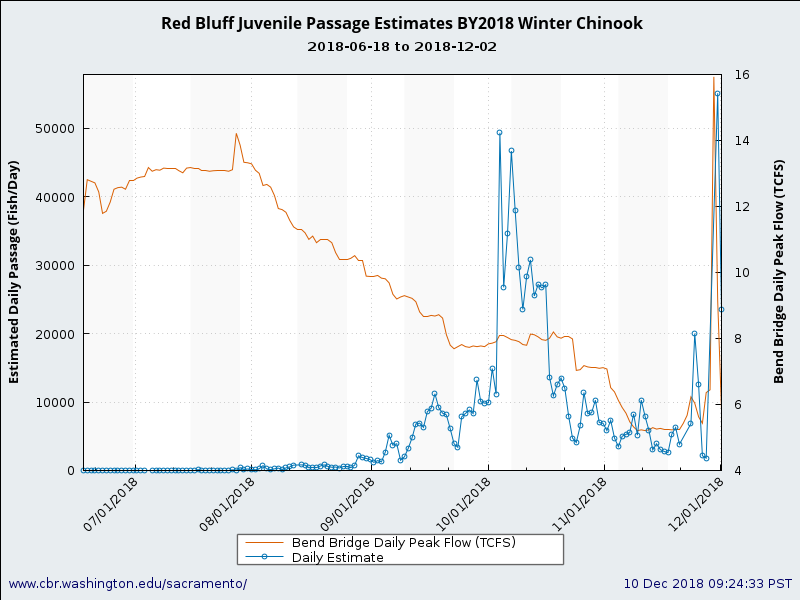
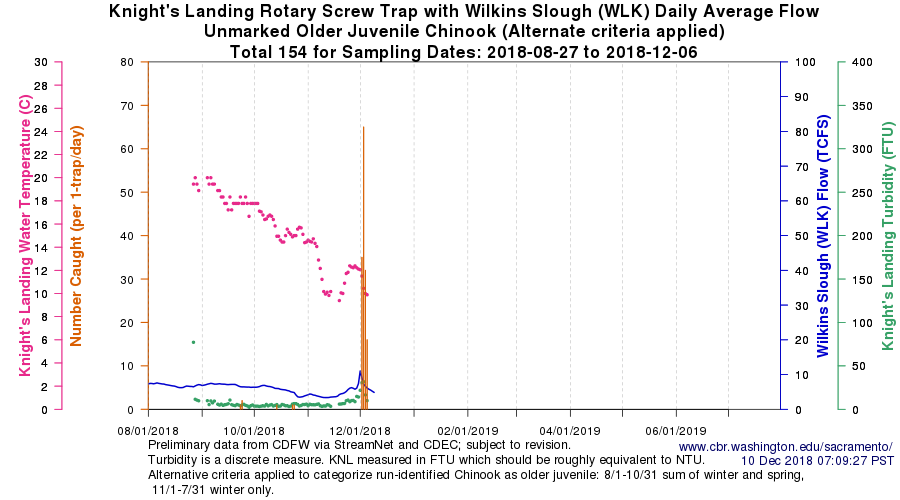
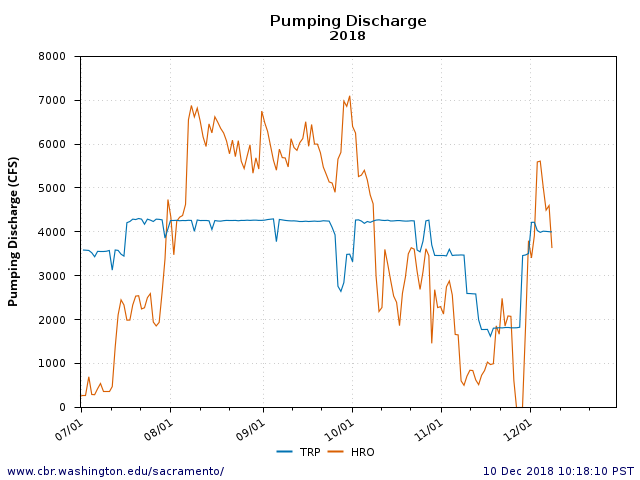
In 2018, the initial pulse of juvenile winter-run passed Red Bluff in September and October prior to flow pulses (Figure 7). The first major pulse of flow occurred at the end of November. A migration spike of winter-run-sized smolts at Knights Landing screw traps occurred during this flow pulse (Figures 7 and 8). Instead of protecting these juvenile winter run as they were entering the Delta, south Delta exports were increased to take advantage of the available inflow, with nearly two-thirds of the Delta inflow being exported (Figure 9).

The lack of protection is likely a consequence of the young salmon not showing up in salvage (Figure 2). For me, the high risk factors are clear.

  1. The lack of salvage simply indicates that few of the migrating salmon survive upon entering the Delta under high exports. High late-November and early-December south Delta exports are a high risk to the juvenile winter-run survival. Traditional high December exports of up to 65% of Delta inflow allowed under D1641 water quality standards are a major risk factor for winter-run salmon that must be changed.
  2. Declining flows below Keswick Dam (rivermile 300) during the fall, combined with the lack of flow pulses, are also a real concern. Juvenile salmon that pass Red Bluff (river mile 240) in September and October are sustained in low flow conditions for nearly 200 miles of modified river channel until the first rains in late November or early December. And the spawning reach directly downstream of Keswick gets no added flow even when it rains, because inflows to Shasta Reservoir are all captured.

For additional information, see agency discussions and data presentations in: http://www.westcoast.fisheries.noaa.gov/publications/Central_Valley/Water%20Operations/Delta%20Operations%20for%20Salmonids%20and%20Sturgeon/DOSS%20WY%202018/winter-run_juvenile_production_estimate__jpe__for_brood_year_2017_-_january_29__2018__1_.pdf

Figure 1. Juvenile winter-run salmon estimated passage and stream flow at Red Bluff (rivermile 240) from late summer 2017 to June 2018.

Figure 2. Lower Sacramento River screw trap collections at Knights Landing (rm 90) since August 2017 along with flow, turbidity, and water temperature. Note late November catch event during flow pulse.

Figure 3. South Delta exports in fall 2017. Note peak exports mid-November through early December – total 10,000-11,000 cfs (22,000 acre-ft per day). Chinook salvage is shown as zero.

Figure 4. Flow through Delta Cross Channel August through December 2017. Note sporadic opening late September through November 2017, and closure at end of November.

Figure 5. Delta outflow August through December 2017.

Figure 6. Salinity (EC) near Rio Vista on lower Sacramento River channel in the Delta, August through December 2017.

Figure 7. Salinity (EC) near Jersey Pt on lower San Joaquin River channel in the Delta, August through December 2017.

Figure 8. Juvenile winter-run salmon estimated passage and stream flow at Red Bluff (rm 240) from late summer 2017 to June 2018.

Figure 9. Juvenile winter-run salmon estimated passage at Knights Landing (rivermile 90) and stream flow at Wilkins Slough (rivermile 125) from late summer to fall 2018. Note early December pulse of fish, flow, and turbidity.

Figure 10. Export rates from two south Delta pumping plants (Tracy TRP and Banks HRO) summer and fall 2018.

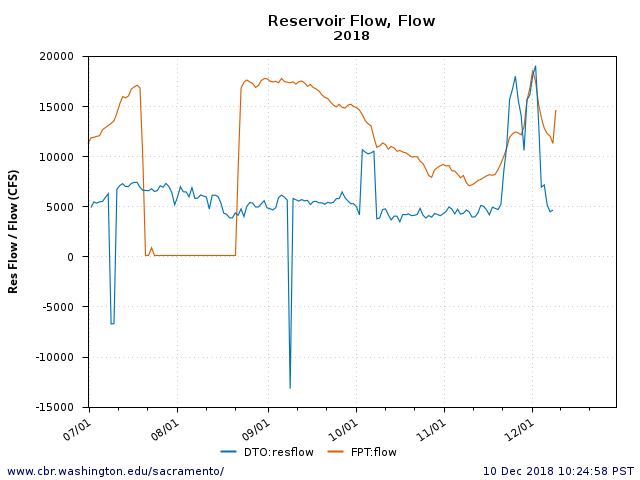
Figure 11. Lower Sacramento River flow at Freeport (FPT, rm 55) and Delta outflow (DTO) summer and fall 2018.

Delta Smelt Resiliency Strategy – Update Fall 2018

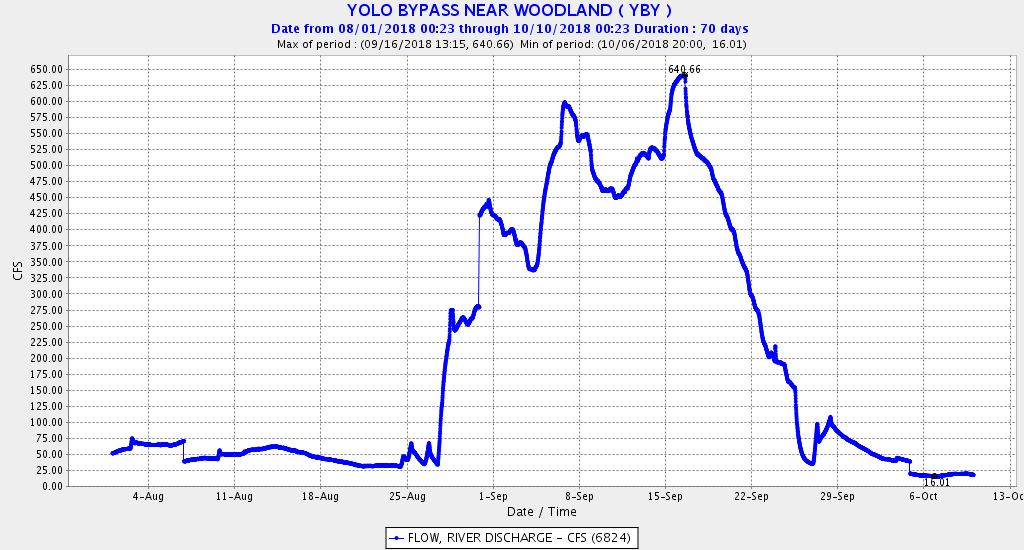
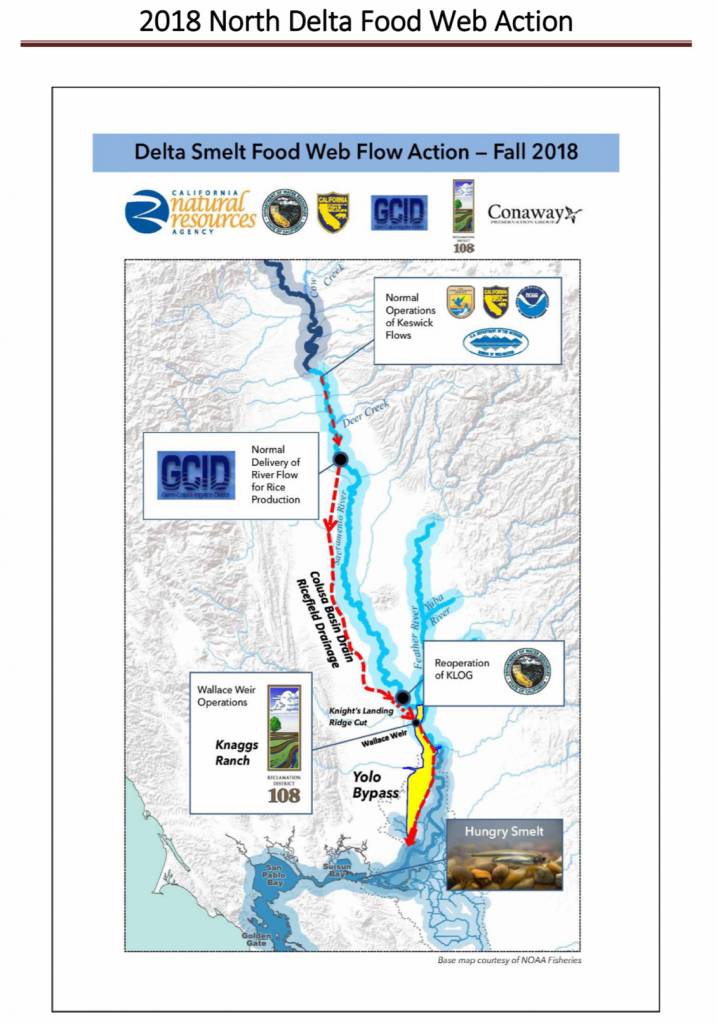
A summer pulse flow through the Yolo Bypass via the Colusa Basin Drain (Figure 1) was implemented in September per the Delta Smelt Resilience Strategy’s North Delta Food Web Action (Figure 2). I reviewed the initial application of the action in July 2016, concluding then there was no evidence that the action would meet its overall goals, but that the approach had potential.

The basic concept is this:

By routing agricultural drain water through Yolo Bypass instead of the Sacramento River, DWR scientists predicted that a flush of plankton-rich water would provide a “seed” for the downstream Delta, enhancing food resources for Smelt. (Note: Historically, summer drain water from Colusa Basin rice fields was discharged into the Sacramento River at Knights Landing.)

A similar managed flow pulse was generated in July 2016 with the help of Sacramento Valley water users, which helped transport plankton to the Delta. (Note: additional Sacramento River water was diverted near Red Bluff to the Colusa Basin Drain to supplement rice field drainage. There was no evidence that plankton blooms in the Yolo Bypass reach the Delta in meaningful amounts.)

The action is designed to maximize the environmental benefits of water. Water isn’t “consumed” by the action–it is directed down a different and more productive path to the Delta. (Note: The basic concept is simple. The nutrient-laden drain water stimulates Yolo Bypass productivity, and the added river water flushes it through to the north Delta. Taking some of the Sacramento River at Red Bluff and routing it through the Colusa Basin irrigation and drainage system, then on to the Yolo Bypass tidal channels, should stimulate biological productivity and flush it, along with excess nutrients and organic debris from rice fields into the Delta at the end of the Bypass (Cache Slough – Rio Vista area). The Delta (and smelt) would benefit from the added biological productivity (phyto-zoo plankton) and nutrients (nitrogen, phosphorous, and organic carbon).

Does the concept work, and does it come without complications?

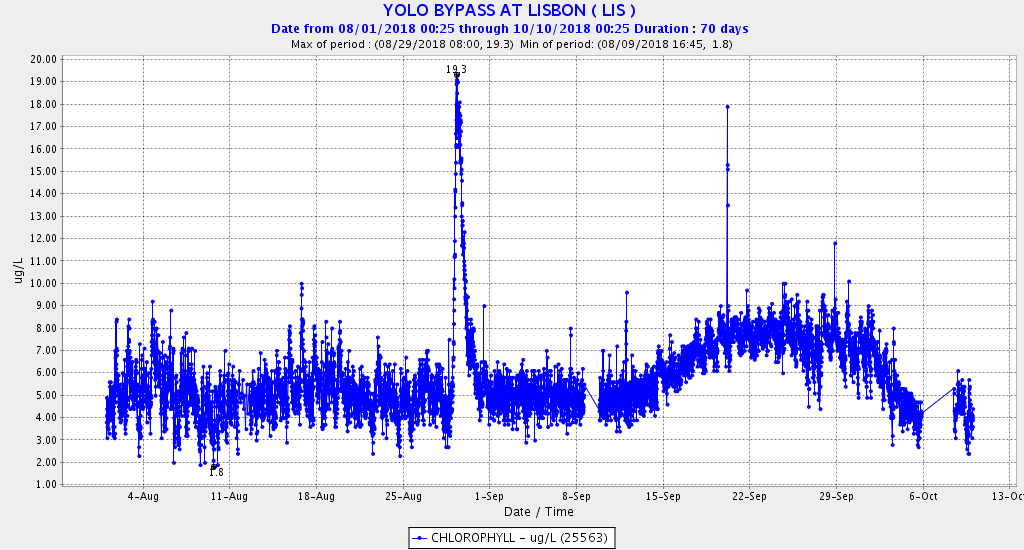
  • During implementation in 2018, there was an 60% uptick in aquatic plant productivity in the lower Yolo Bypass (Figure 3).
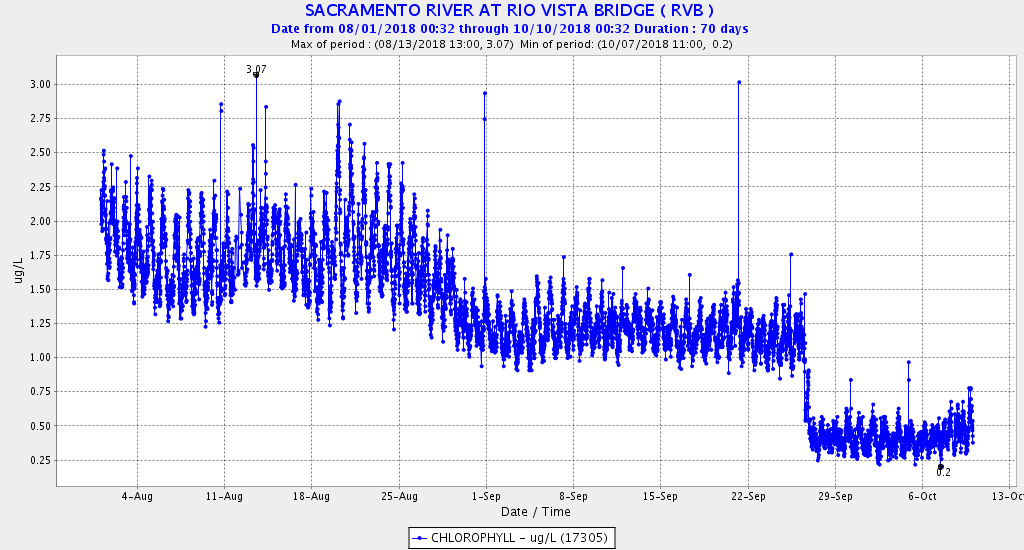
  • There was no increase in productivity as of early October in the north Delta at Rio Vista (Figure 4).
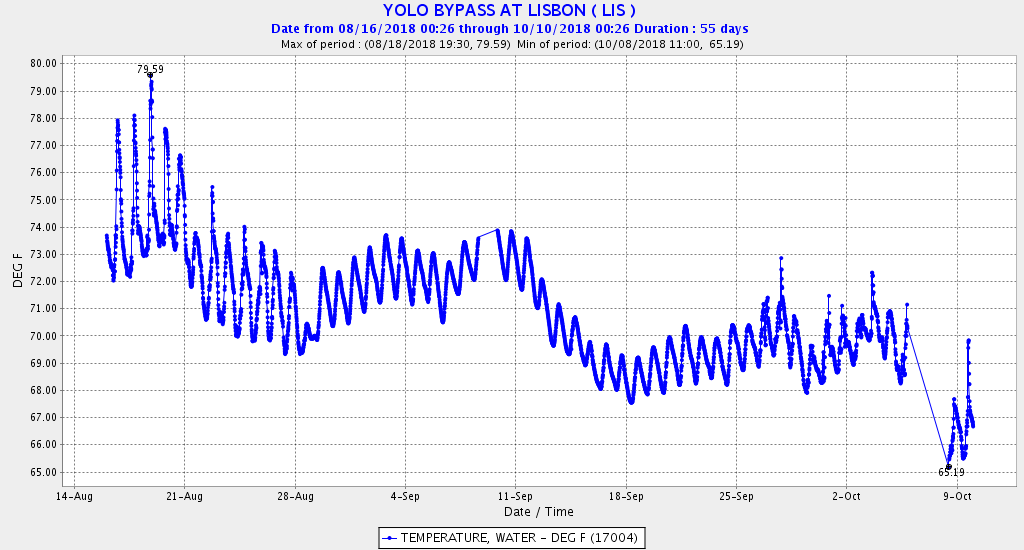
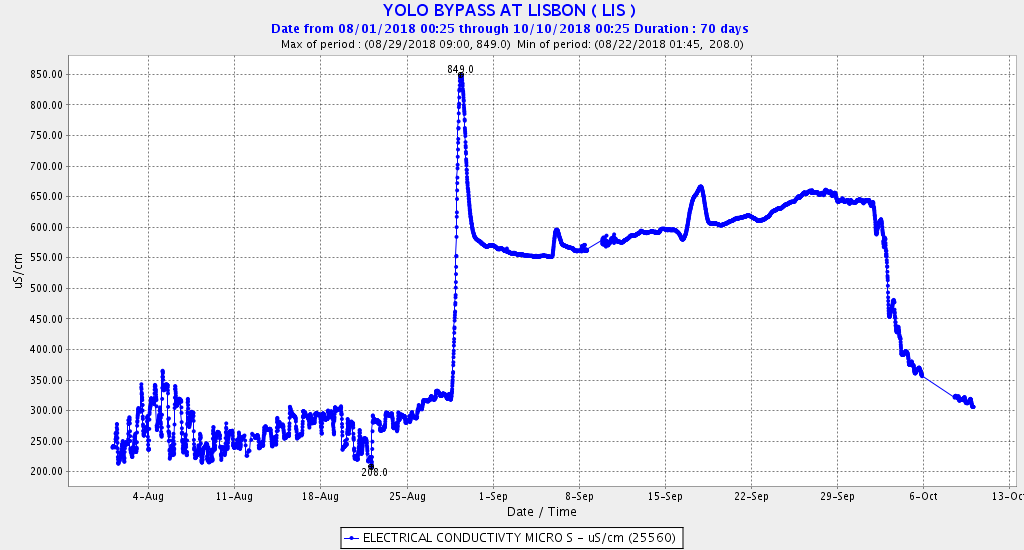
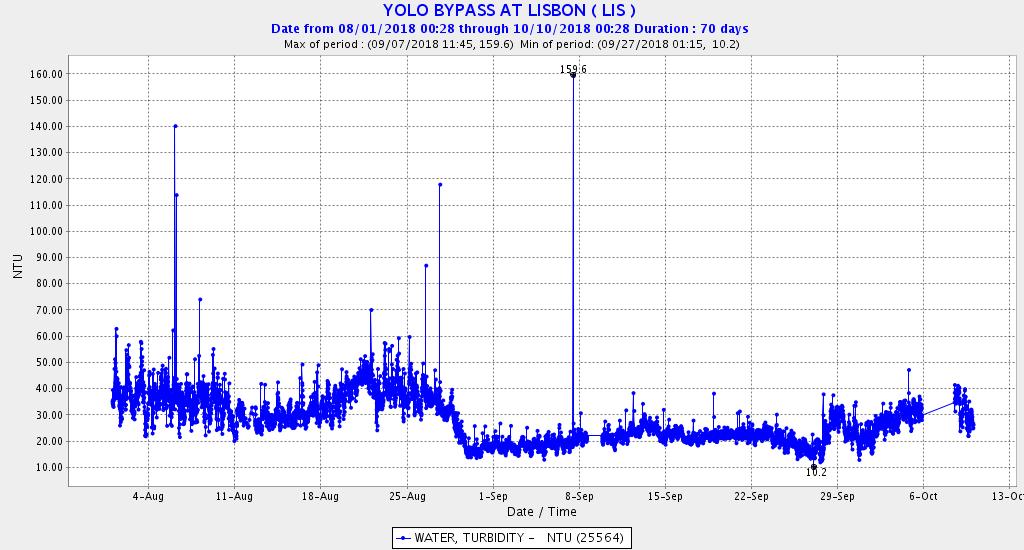
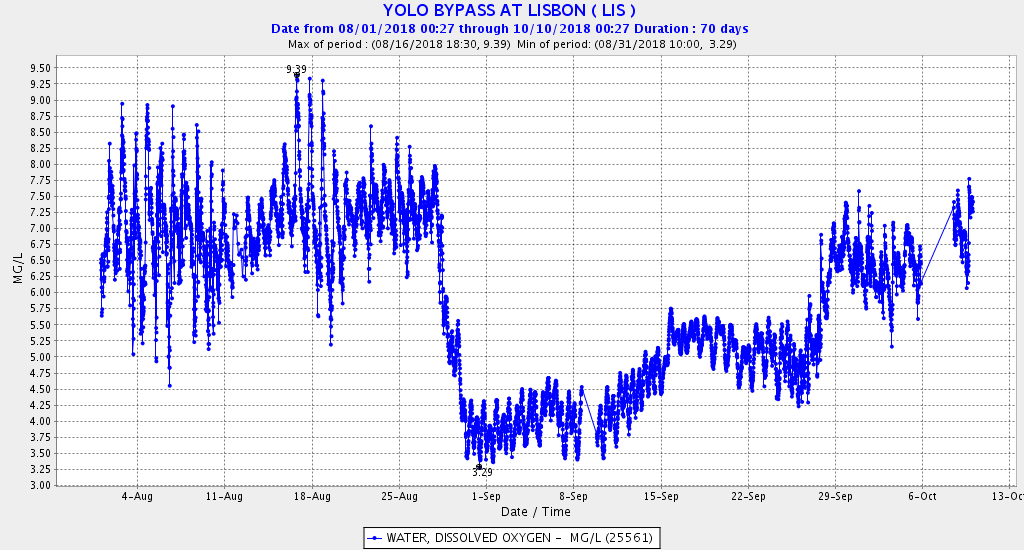
  • The water routed through the Bypass was initially warm (>70oF, Figure 5), high in salts (Figure 6), lower in turbidity (Figure 7), and low in dissolved oxygen (Figure 8).
  • Warm water and the high organic load resulted in poor dissolved oxygen levels (3-5 milligrams-per-liter) that violate state standards and are potentially lethal to salmon migrating through the Bypass1.

On a positive note, routing drain water to the Bypass does keep the poor quality drain water out of the Sacramento River below Knights Landing.

In sum, the benefits of the action remain questionable. Waiting to conduct the action until fall when waters are cooler could alleviate high water temperatures and low dissolved oxygen in the water. It might also create more Delta benefits by delaying nutrient use until nutrients reach the Delta. Further research is warranted into the water quality of the drain water, especially its oxygen-depriving, high-organic load and its chemical constituents (salts, herbicides, and pesticides). Otherwise, it may be that the action is little more than an augmentation of the current practice of dumping what might be described as polluted agricultural drain water into Central Valley rivers and the Delta.

Figure 1. Stream flow (cfs) in Yolo Bypass below Colusa Basin Drain outlet. The pulse flow reached the Yolo Bypass on or about August 28 and ended on September 25.

Figure 2. Project scheme and map of key features.

Figure 3. Chlorophyll concentration in lower Yolo Bypass at Lisbon in late summer 2018. There was a 50% increase in late September to about 8 micrograms per liter, although below the target of 10 or higher.

Figure 4. Chlorophyll concentration in north Delta at Rio Vista in late summer 2018. There was a slight decline after September 1 to about 1.25 micrograms per liter, well below the target of 10 or higher.

Figure 5. Water temperature in lower Yolo Bypass at Lisbon in late summer 2018.

Figure 6. Salt concentration (EC) in lower Yolo Bypass at Lisbon in late summer 2018. The drain water entering at the end of August had a high salt concentration.

Figure 7. Turbidity (NTUs) in lower Yolo Bypass at Lisbon in late summer 2018.

Figure 8. Dissolved oxygen (mg/l) in lower Yolo Bypass at Lisbon in late summer 2018. The drop in DO at the end of August reflects the high organic load of the drain water.

  1. Migrating adult salmon are common in the Bypass in September, possibly being attracted to rice drainage flows with the chemical signal of the upper Sacramento River.