Tuolumne River Salmon Runs in Decline – End-of-Year 2020 Status

After decades of dominating the overall salmon run in the San Joaquin River watershed, the salmon run in the Tuolumne River now lags behind the runs in her sister rivers.  The Tuolumne River is a San Joaquin River tributary with no hatchery.  Its salmon runs are declining (Figure 1).  Unlike her sister rivers the Stanislaus and the Merced, the Tuolumne salmon run did not rebound as well after the 1987-1992, 2007-2009, and 2013-2015 droughts (Figure 2).

The Tuolumne run has had difficulty recovering from droughts because spawner numbers in subsequent years are too low.  There is a positive spawner-recruit relationship, heavily influenced by water year conditions (Figure 3).  Recruitment (run size) is influenced by the number of parent spawners (three years earlier), poor rearing year conditions (two years earlier), and poor conditions in the year adults return.. Runs from 1990-1992 had all three of these adverse conditions, which led to a 99% loss of their potential (two log levels).  The third years of the two recent droughts (2009 and 2015) had similar reduced potential, though with only two of the adverse conditions (poor rearing conditions and poor adult returns).

In a recent post, I related near-record-low salmon runs over the past several years in the Yuba River, a Sacramento River tributary that is similar to the Tuolumne in that it has no hatchery.  Like the Yuba, the Tuolumne salmon run is also markedly influenced by hatchery strays from other Central Valley rivers.  Hatchery strays from other rivers (Figure 4) dominate otherwise poor runs in the Tuolumne River in the years following droughts.  Many Battle Creek and Mokelumne River hatchery smolts trucked to the Bay in 2014-15 later strayed to the Tuolumne River to spawn.

Lack of returning wild salmon that are of Tuolumne River origin, and the dominance of hatchery strays after droughts, do not bode well for the native Tuolumne salmon run.  Resource agencies and other science experts have recommended maintaining a run of at least 500 native spawners for the run to remain “viable” (McClain 2010).  While recent runs since the 2013-15 drought have averaged near 1000 spawners, the fact that 60-70% are hatchery strays indicates that this goal has not been met over the past 15 years.  To increase wild salmon production, the State Water Board needs to adjust the allocation of Tuolumne River water, a process the State Water Board began in 2018.  Changes in the operation of the Delta pumps to reduce pumping during the emigration season would improve the success of all San Joaquin watershed salmon runs.  As native populations improve, river managers could reduce the influence of hatchery strays by ‘sorting out’ strays at the adult counting weir in the lower Tuolumne River; however, this would necessitate marking all Central Valley hatchery smolts.

Figure 1. Fall run Chinook escapement to the Tuolumne River 1975-2019. Data Source.

Figure 2. Fall-Run Chinook salmon escapement in San Joaquin River tributaries 1975-2019. Data Source.

Figure 3. Spawner-recruit relationship for Tuolumne River fall-run Chinook salmon. Numbers are log transformed minus 1 (2.00 = 1000). Numbers are recruits in their spawning return year. Red number is dry water year two years earlier when rearing as young. Red circle is dry year adult return year. Blue is wet year. Green is normal water year.

Figure 4. Source of hatchery strays in Tuolumne River spawning ground surveys in 2016 and 2017. Note only 25% of hatchery smolts are marked. Source.

Winter Pulsed Flow for Salmon Needed Now!

Winter pulse flows benefit fall-run salmon fry by helping them emigrate to the Delta and Bay nursery areas (see discussion in February 2019 post). The tailwater spawning reaches of dams need reservoir releases to stimulate emigration of fry (Figure 1). Such releases piggy-back on stormwater flows in downstream tributaries, such as those in late January 2021 (Figure 2).

Nearly all Central Valley reservoirs are capturing recent high precipitation from their upper watersheds. With forecasts of further substantial rainfall into mid-February 2021, modest reservoir releases would provide substantial potential benefits to Central Valley salmon populations.

Figure 1. Sacramento River fall-run salmon fry catch near Red Bluff (river-mile 240) in winter 2020. Note that flow pulses stimulated winter fry emigration.

Figure 2. Flows from Shasta/Keswick reservoirs (river-mile 300, brown) and at downstream sites Bend Bridge (river-mile 250, green) and Wilkins Slough (river-mile 125, blue) in winter 2021. Note that tributary inflows created flow pulses in lower reaches of the Sacramento River.

Scott River Chinook Salmon Update

The Scott River Chinook salmon, a key contributor to the overall Klamath River salmon run, are in major trouble.  In a November post, I had a “mixed” prognosis for this year’s fall run.  Well the numbers are now in – a record low, bleak run of 117 spawners observed (Figure 1) at the weir downstream of Fort Jones.

Figure 1. Scott River fall run salmon escapement 1978-2020. Source: CDFW unpublished data.

The poor run can be directly attributed to lack of fall river flow, a fact that I had addressed in a 2017 post.  Salmon simply cannot ascend the lower Scott River into Scott Valley spawning grounds from the Klamath River because of lack of streamflow.  Some may spawn in the steep canyon below the Valley (and counting weir), but poor spawning habitat and low flows in the canyon offer little solace for the salmon.

Poor fall flows (Figure 2) can be directly attributed to fall groundwater extraction and surface water diversions for hay-pasture irrigation.  The State Water Board should stop crop irrigation after October 1.  This irrigation practice has been getting worse over the past several decades, aided by improved well extraction and sprinkler technology and greater demand and higher revenues.  Present water use permits allow irrigation into December, which ranchers have been taking advantage of to get an extra crop of hay (with the help of climate change).

Unlike 2020 (Figure 2), water use in past drought years tapered off earlier and flows increased during October (Figures 3-5).  This allowed fall-run salmon access to the Valley.  In contrast, recent wet and normal years see a combination of precipitation and reduced water use, which enhances fall flows (Figures 6 and 7).

In conclusion, the State Board should limit fall water irrigation in Scott Valley to save the salmon.  The Sustainable Groundwater Management Act (SGMA), passed in September 2014, requires local agencies to develop Groundwater Sustainability Plans (GSP) that will assess and project future groundwater conditions, and provide management and monitoring activities.  The Scott River basin is a priority basin.  Siskiyou County is required to develop and submit a GSP for the Scott River basin by January 31, 2022.  A preliminary plan recently developed by the advisory group suggests reducing irrigation acreage (Figure 8) to increase streamflow (Figure 9).  That would help, but what salmon need is a cutoff of irrigation by October 1.  An option for further augmentation is to employ unused groundwater extraction wells in the fall to add water to the river  for short periods.  Stored water in the tailings ponds (red area in Figure 8) could also be gravity-fed or pumped into the river at critical times.

Figure 2. Scott River flow fall 2020. Water year 2000 was a drought year.

Figure 3. Scott River flow fall 2000 and winter-spring 2001. Water year 2001 was a drought year.

Figure 4. Scott River flow fall 2013 and winter-spring 2014. Water year 2014 was a dry year.

Figure 5. Scott River flow fall 2014 and winter-spring 2015. Water year 2015 was a normal year.

Figure 6. Scott River flow fall 2016 and winter-spring 2017. Water year 2017 was a wet year.

Figure 7. Scott River flow fall 2017 and winter-spring 2018. Water year 2018 was a below normal water year.

Figure 8. Baseline (present) and preliminary action alternative for Scott Valley irrigation. Source: preliminary plan.


Figure 9. Analysis of preliminary action alternative. Source: preliminary plan.


Yuba River Salmon 2020

In a 2017 post and a 2018 post, I related the status of Yuba River Chinook salmon runs. The 2017 spawning escapement estimate was a record low. The 2018 and 2019 runs were not much better (Figure 1). While the record low 2017 can be blamed predominately on the 2013-2015 drought, the poor 2018 and 2019 runs cannot. Water year 2016 was a normal water year and 2017 was a wet year.

The likely culprit in the decline in Yuba escapement is the continuing persistent decline of wild spawners and increase in hatchery strays (greater than 90% of the run), leading to the erosion of the locally adapted Yuba River salmon population. This was the diagnosis for the overall Feather River population by Willmes et al., 2018.

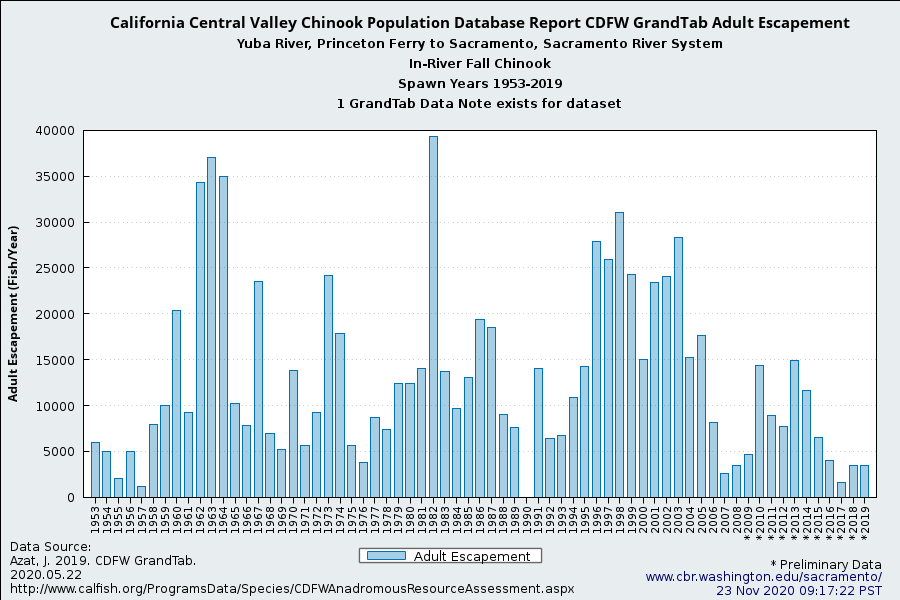
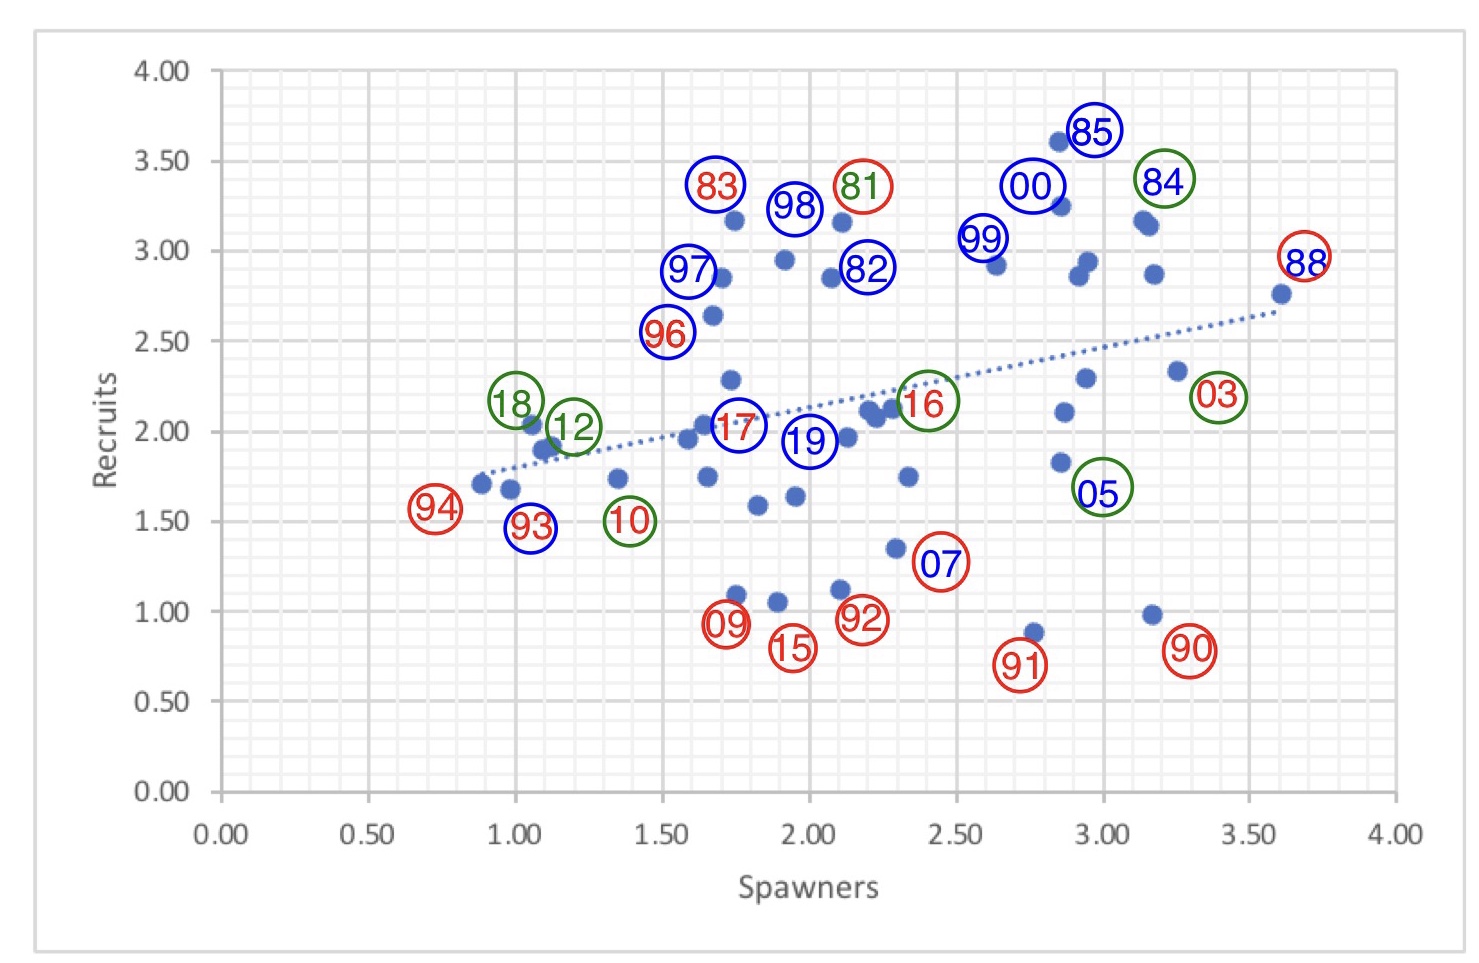
Figure 1. Yuba River fall run salmon escapement 1953-2019.

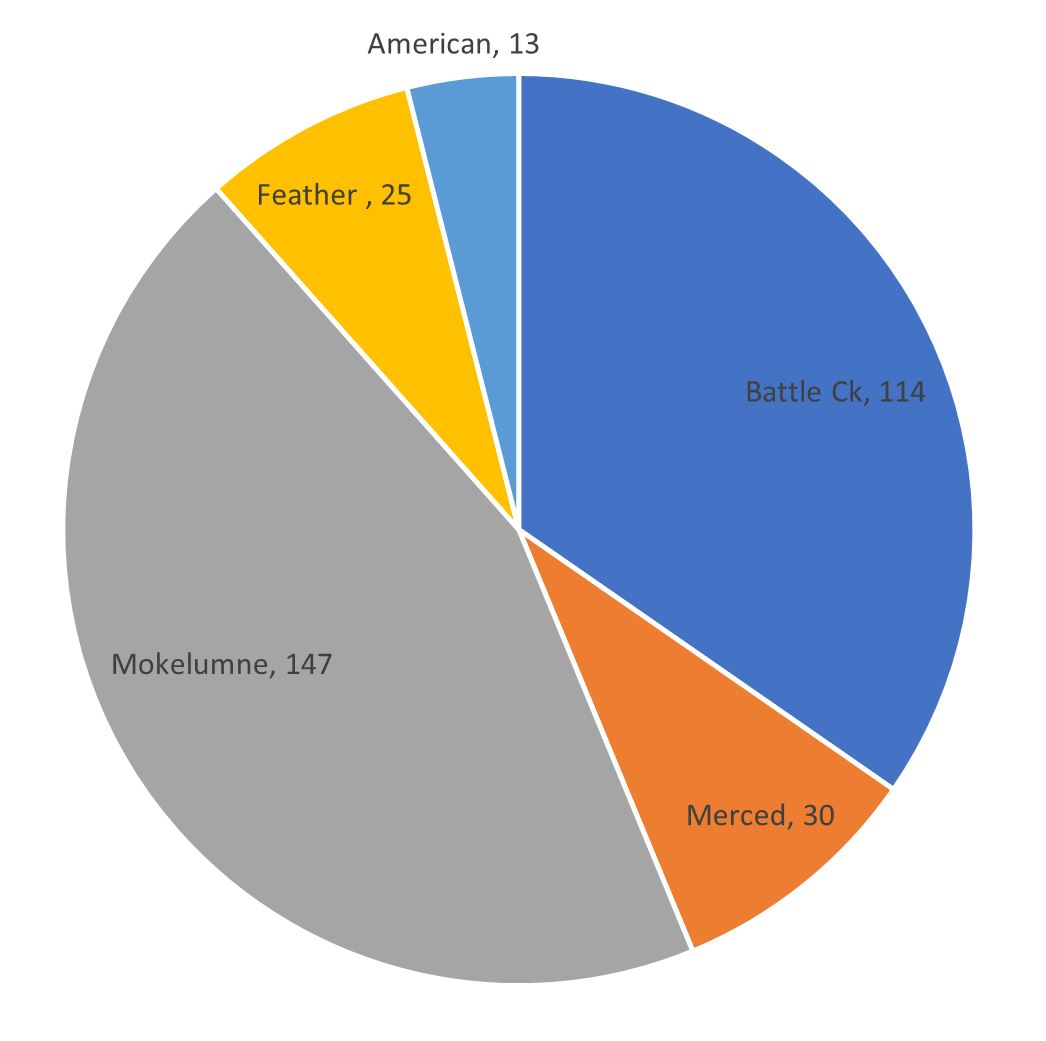
A further look at the composition of the hatchery strays in the Yuba escapement surveys provides added clues about the cause of the recent decline in overall escapement to the Yuba River. In 2016 (Figure 2), nearly half the tag returns were strays from the Battle Creek hatchery, while the other half were a combination of spring-run and fall-run strays from the Feather River hatchery, along with a smattering of strays from the hatcheries on the American and Mokelumne rivers. In 2017 (Figure 3), Yuba tag returns featured an even greater proportion of strays from Battle Creek, the American, and the Mokelumne. In 2018 (Figure 4), about half of the tag returns were from the Mokelumne River hatchery, and a third were of Feather River spring-run hatchery origin.

Feather-tagged spring-run show up consistently in the Yuba escapement surveys. This is unusual, because spring-run make up only about 10% of the Feather hatchery smolt production, with fall-run being about 90%. One reason is that spring-run smolts are 100% tagged, while fall-run hatchery smolts are only 25% tagged. Another reason is that all the spring-run smolts are released near Gridley just upstream from the mouth of the Yuba, whereas most of the fall-run smolts are released in the Bay. A third reason is that in most years springtime flows in the Yuba are higher and colder than those in the Feather, and are thus more likely to attract returning adults. Regardless of the reason, the fact that a significant portion of Yuba “fall run” escapement is derived from spring-run hatchery smolts is cause for concern.

Battle Creek hatchery fall-run made up about half the tag returns in 2016 and 2017. Much of the smolt production from the Battle Creek hatchery was trucked to the upper Bay in 2014 and 2015, a strategy prone to increased straying.1 No Battle Creek hatchery smolts were trucked to the Bay in 2016, and none showed in the Yuba in 2018. With over 10 million fall-run smolts produced at the Battle Creek hatchery (federal Coleman Hatchery near Red Bluff), nearly double the Feather hatchery production, it is easy to see why Battle Creek hatchery salmon could dominate the Yuba escapement. Without the Battle Creek, American River, and Mokelumne River hatchery strays in 2017, the record low escapement in the Yuba River would have been far worse. The fact that most of the 2017 spawners were hatchery strays from rivers other than the Feather should also be cause for concern.

In conclusion, the escapement of fall-run salmon to the Yuba River has declined over the past five years, approaching record-low levels. Spawners are now predominately hatchery strays from smolts released in the Bay and along the coast. Natural “wild” Yuba River smolt production is virtually nonexistent. This is a crying shame for what is widely regarded as one of the best non-hatchery salmon rivers in the Central Valley. I have spent many days on the Yuba River over the past two decades. I observed the big runs at the turn of the century and in 2013 and 2014. The river’s pools turned purple with adult salmon. Dead and dying salmon filled the backwaters, feeding eagles and buzzards. The odor was prevalent. Spawning salmon and redds were everywhere. Such occurrences are now rare. Our Yuba River needs so many fixes, a subject for another post.

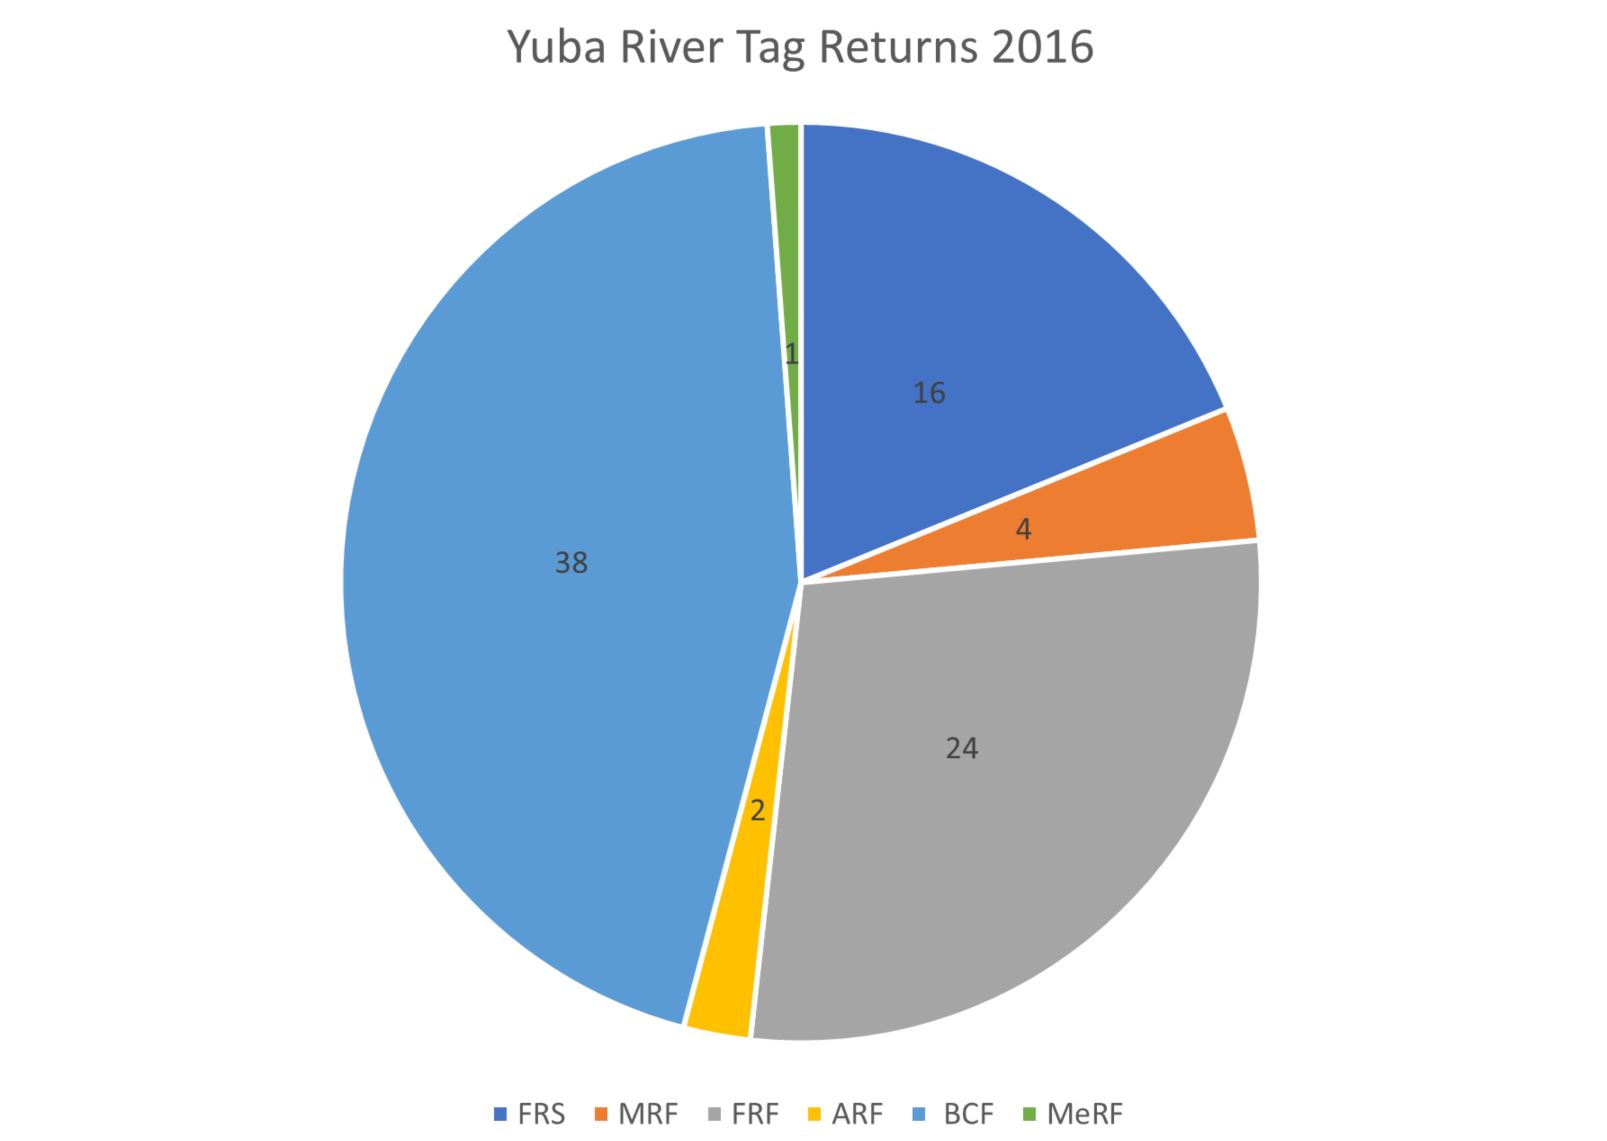
Figure 2. Composition of tag returns from Yuba River spawners in 2016. FRS = Feather River spring run. MRF = Mokelumne River fall run. FRF = Feather River fall run. ARF = American River fall run. BCF = Battle Creek fall run. MeRF = Merced River fall run. Data source: rmis.org.

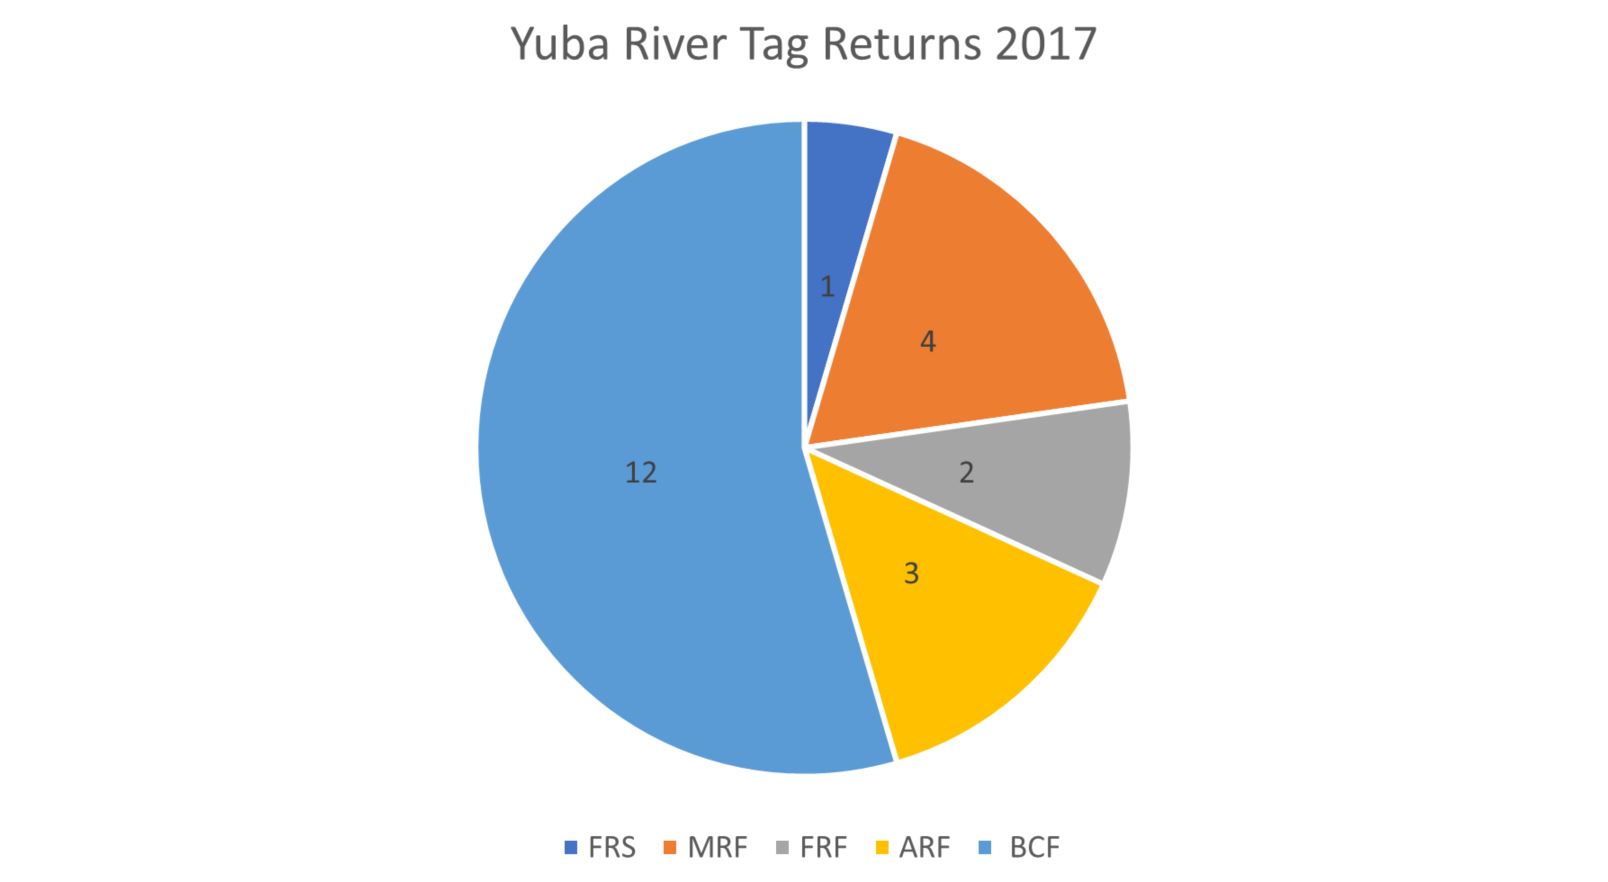
Figure 3. Composition of tag returns from Yuba River spawners in 2017. FRS = Feather River spring run. MRF = Mokelumne River fall run. FRF = Feather River fall run. ARF = American River fall run. BCF = Battle Creek fall run. Data source: rmis.org.

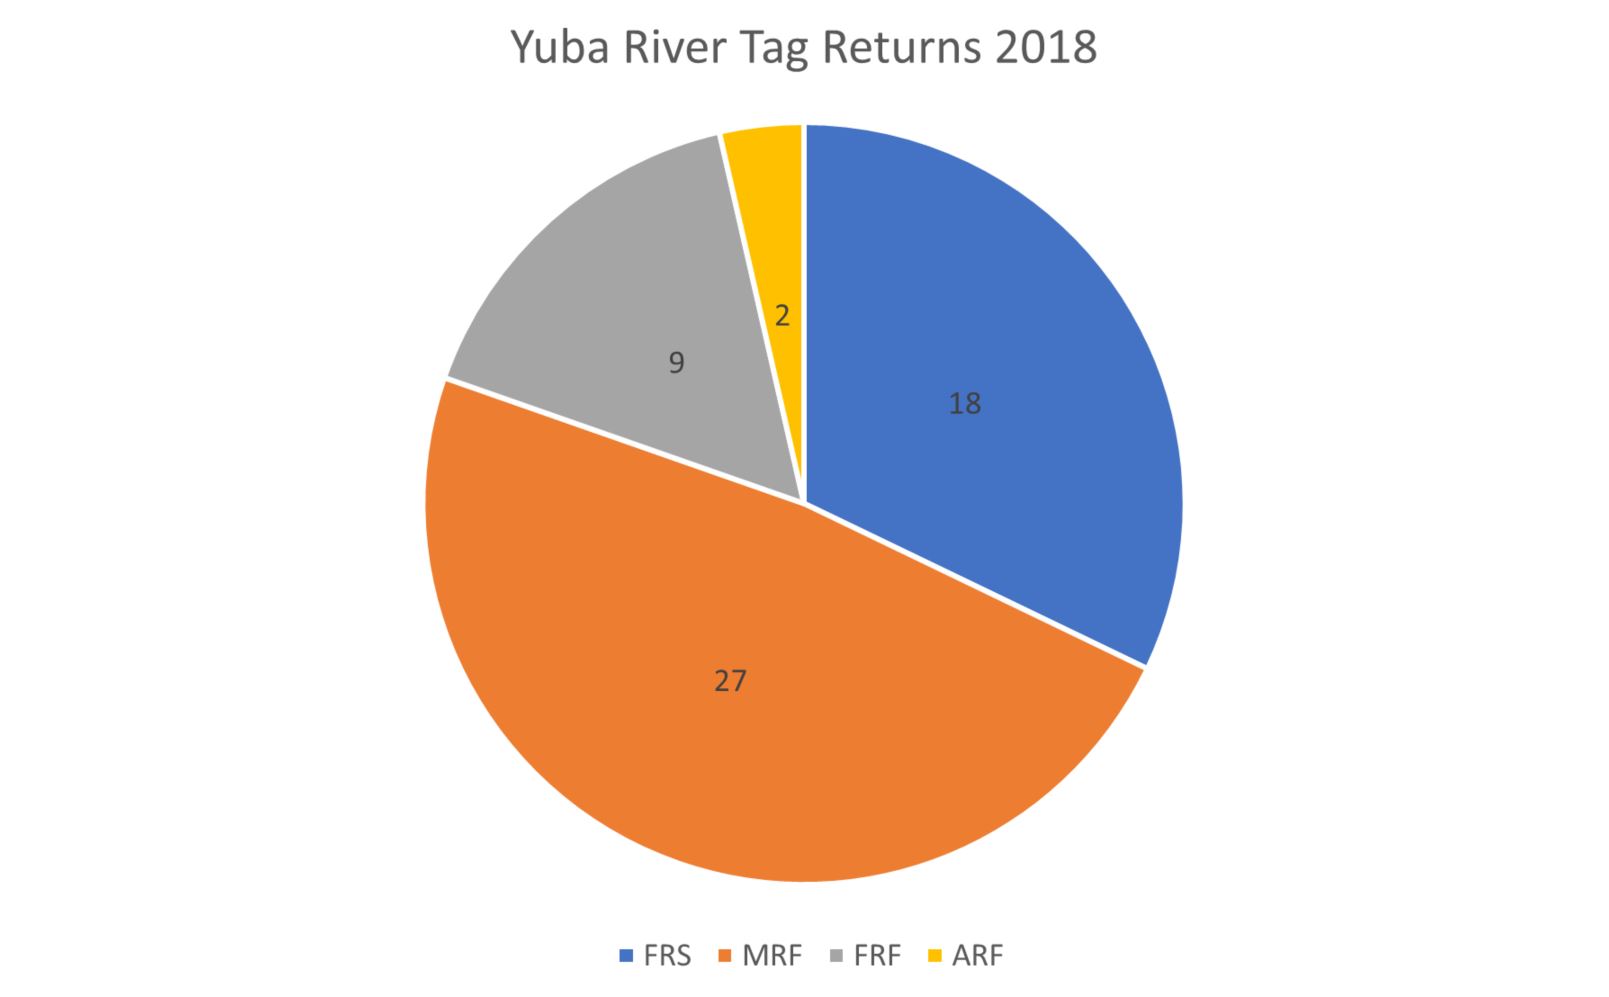
Figure 4. Composition of tag returns from Yuba River spawners in 2018. FRS = Feather River spring run. MRF = Mokelumne River fall run. FRF = Feather River fall run. ARF = American River fall run. Data source: rmis.org.

Mokelumne River Hatchery 2017 Releases

In previous posts over the past two years, I remarked on the progressive management of the Mokelumne River Hatchery, a mitigation hatchery operated by the California Department of Fish and Wildlife in partnership with the East Bay Municipal Utility District. Hatchery production over the past several decades has led to the recovery of Mokelumne River fall-run Chinook salmon (Figure 1 and 2). There were remarkable returns to the Mokelumne in 2017, despite the 2013-2015 drought. Returns from 2016 hatchery releases in 2018 were also good.

The hatchery’s annual 6 million smolt releases in 2017 (Table 1) survived well under the hatchery’s management practices (Figure 1). Returns of adults two years later to the river and hatchery below Camanche Dam in 2019 totaled 10,000 to 20,000 as in other recent years (Figures 1 and 2).

Overall, a good 2019 escapement was expected because 2017 was a wet year. However, in-river numbers (Figure 2) in 2019 were not as high as might be expected.. Hatchery return patterns were similar to those from the 2016 releases returning in 2018. Again, the best returns were from releases of hatchery fish to the coast near the Golden Gate and from Half Moon Bay just south of San Francisco (Figure 3). Returns ranged from near zero to 2.5 percent (Figure 3). The half-million smolts released to the river had near zero returns to fisheries and river/hatchery, while the one million releases to the coast in May had good returns of 1.3 to 2.5 percent. Late May releases (900,000) from the east Bay at Sherman Island also had good returns of 1.5 to 1.8 percent. Earlier May and late April releases to coast, east Bay, and river (nearly 4 million) had returns less than 1 percent.

Since 2017 was a wet year with high spring Delta outflow than drier 2016 (Figure 4), a better return would be expected from the 2017 hatchery releases to the Mokelumne River and even the eastern Bay. The river also had much higher flows in spring 2017 (Figure 5), which should have benefitted in-river hatchery releases. Late May releases proved much more successful in wet year 2017 than late April or early May releases, even to the coast, providing further evidence of better performance of later release of older, larger hatchery smolts. But the continued poor returns from in-river releases even in wet year 2017 remains a problem.

Meanwhile, straying of fish produced in the Mokelumne remains an issue. Up to half or more of returning adults stray to other Central Valley rivers and hatcheries. Maintaining genetic integrity and “wild” spawners in spawning reaches of individual Central Valley rivers would require marking or genetic tests of all hatchery fish, as well as measures to keep hatchery-origin and stray adults from individual spawning grounds. Maintaining genetic integrity and minimal “domestication” of the hatchery stocks would require selective brood stock management in the hatcheries.

Figure 1. Returns to Mokelumne Hatchery 1964-2019.

Figure 2. In-river spawning grounds counts 1952-2019.

Table 1. Summary of Mokelumne Hatchery smolt releases in spring 2017. Source: https://www.rmpc.org

Figure 3. Percent return of 2017 Mokelumne Hatchery tagged smolt releases. Source: https://www.rmpc.org

Figure 4. Delta outflow spring 2016 and 2017.

Figure 5. River flow at Woodbridge Dam 2016-2017.