New federal biological opinions (BO’s) for the long-term operation of the Central Valley Project and the State Water Project in the Delta have been “protecting” salmon and smelt for several months. The record in practice is not good.
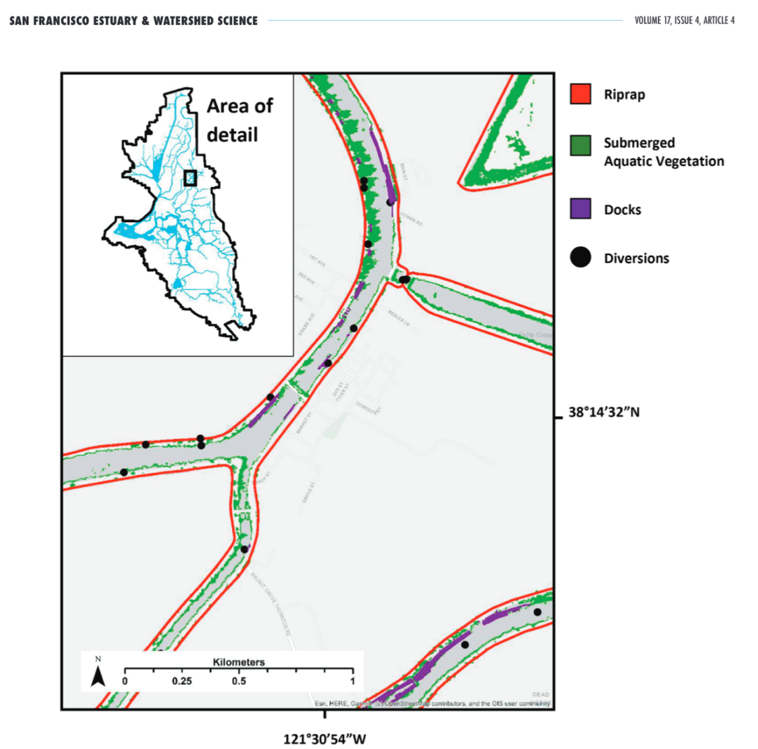
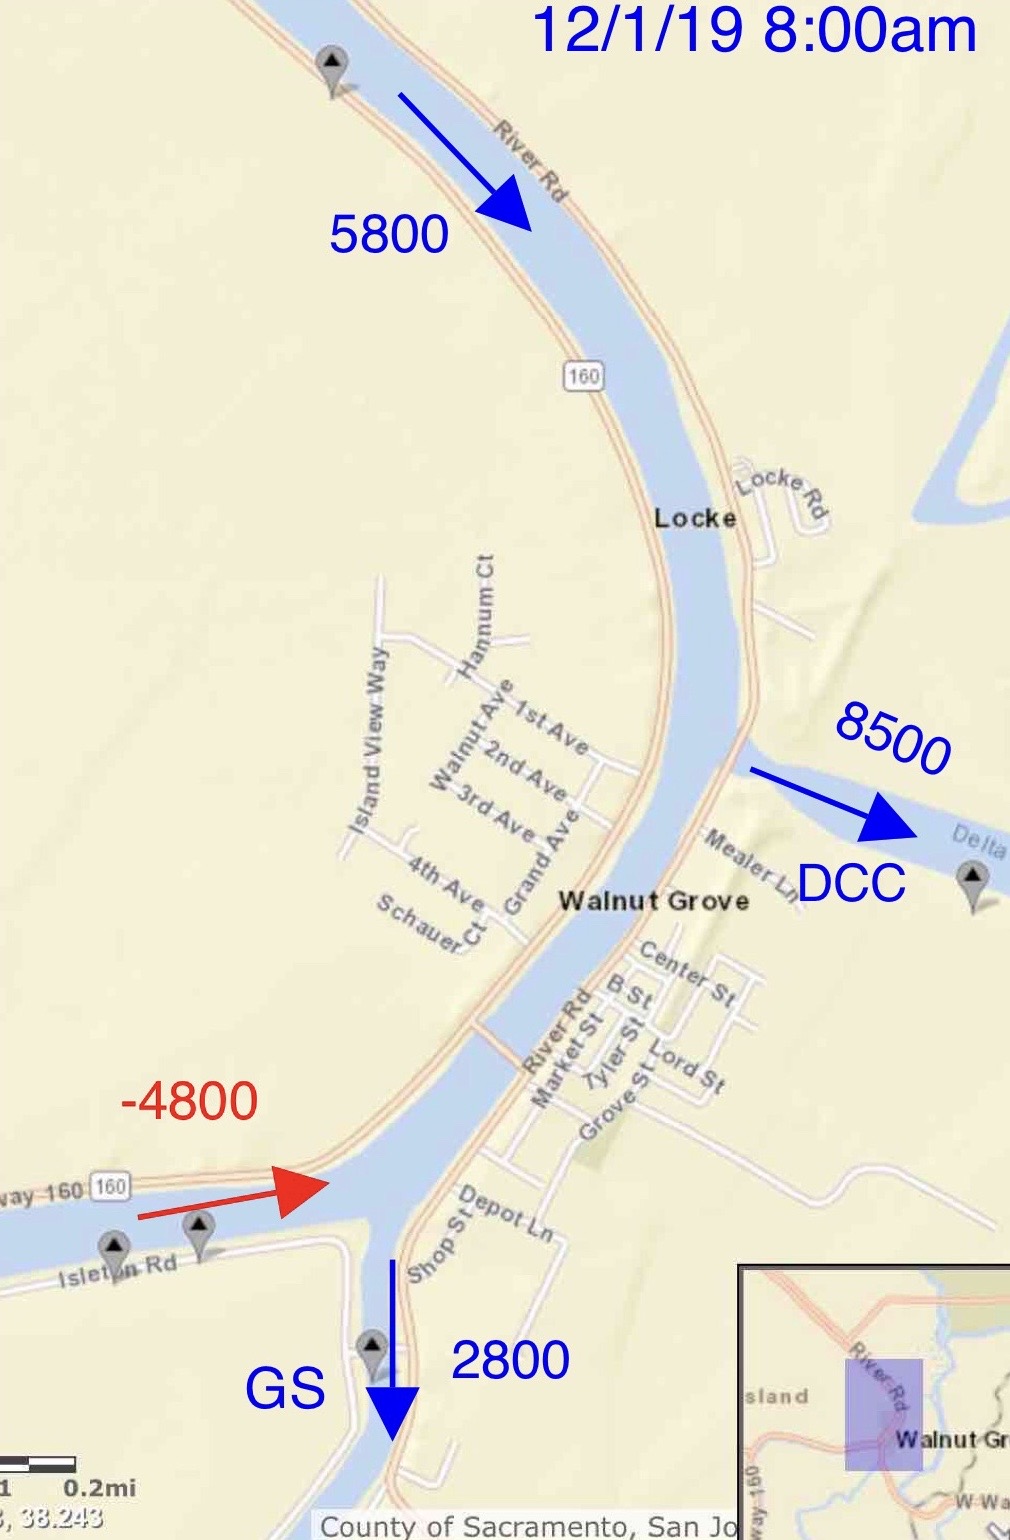
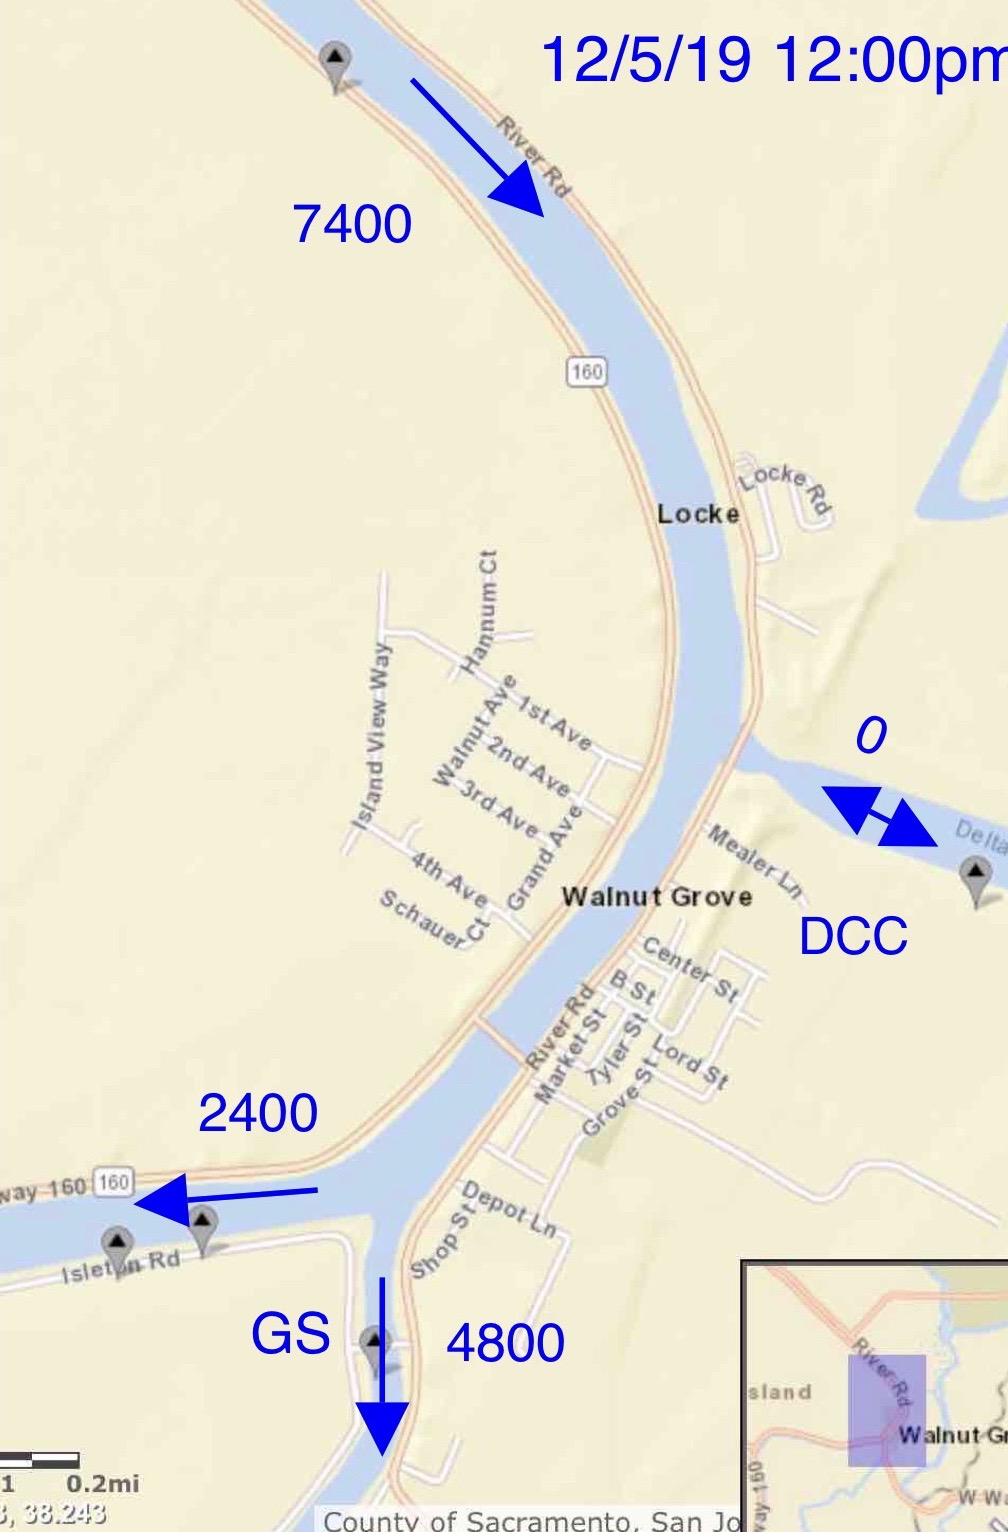
The ostensible purpose of the new BO’s is to protect native fishes, including ESA-listed salmon and smelt. A key focus in the new BO’s (as in prior BO’s) is on regulating reverse flows in Old and Middle River channels of the central Delta (Figure 1). Reverse or negative net upstream flows are caused by south Delta federal and state exports. Rules limiting negative OMR flows limit south Delta exports.
The U.S. Fish and Wildlife Service summarizes OMR operation, in part, as follows:1
Old and Middle River Flows
The new BO’s make a commitment to stay within the Delta pumping-related loss experienced under the 2008-09 BO RPA’s. Old and Middle River Reverse flows are to be limited based on timing (no greater than -5,000 cfs Jan-Jun); water quality conditions (short term protections for first flush events); storm event flexibility (can increase beyond -5,000 cfs if there is not a risk to the species); observed annual salvage and loss (specific triggers for loss values similar to those seen under the 2009 RPA); cumulative loss and outcomes from independent review panels.
Controlled OMR Flows
The action is consistent with Action 1 of the 2008 RPA by providing for integrated early winter pulse protection which requires reducing exports for 14 consecutive days so that the 14-day averaged OMR index for the period shall not be more negative than -2,000 cfs, in response to “First Flush” conditions in the Delta. In addition, once OMR management begins, Reclamation and DWR will operate to an OMR index no more negative than a 14-day moving average of -5000 cfs, unless a storm event occurs, until that point in which OMR management ends in a season (when temperatures in south Delta become lethal or June 30, whichever is earlier). The Integrated Early Winter Pulse Protection action may occur more frequently than Action 1 in the 2008 RPA, providing equal or greater protection.
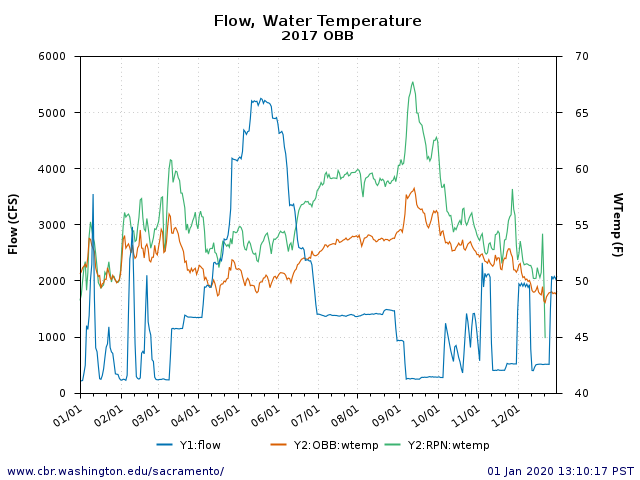
To evaluate whether the new BO’s met these new commitments in December 2019 and January 2020, the reader should review Figures 2, 3, and 4 below, and also https://www.usbr.gov/mp/cvo/vungvari/OMR_Jan2020.pdf.
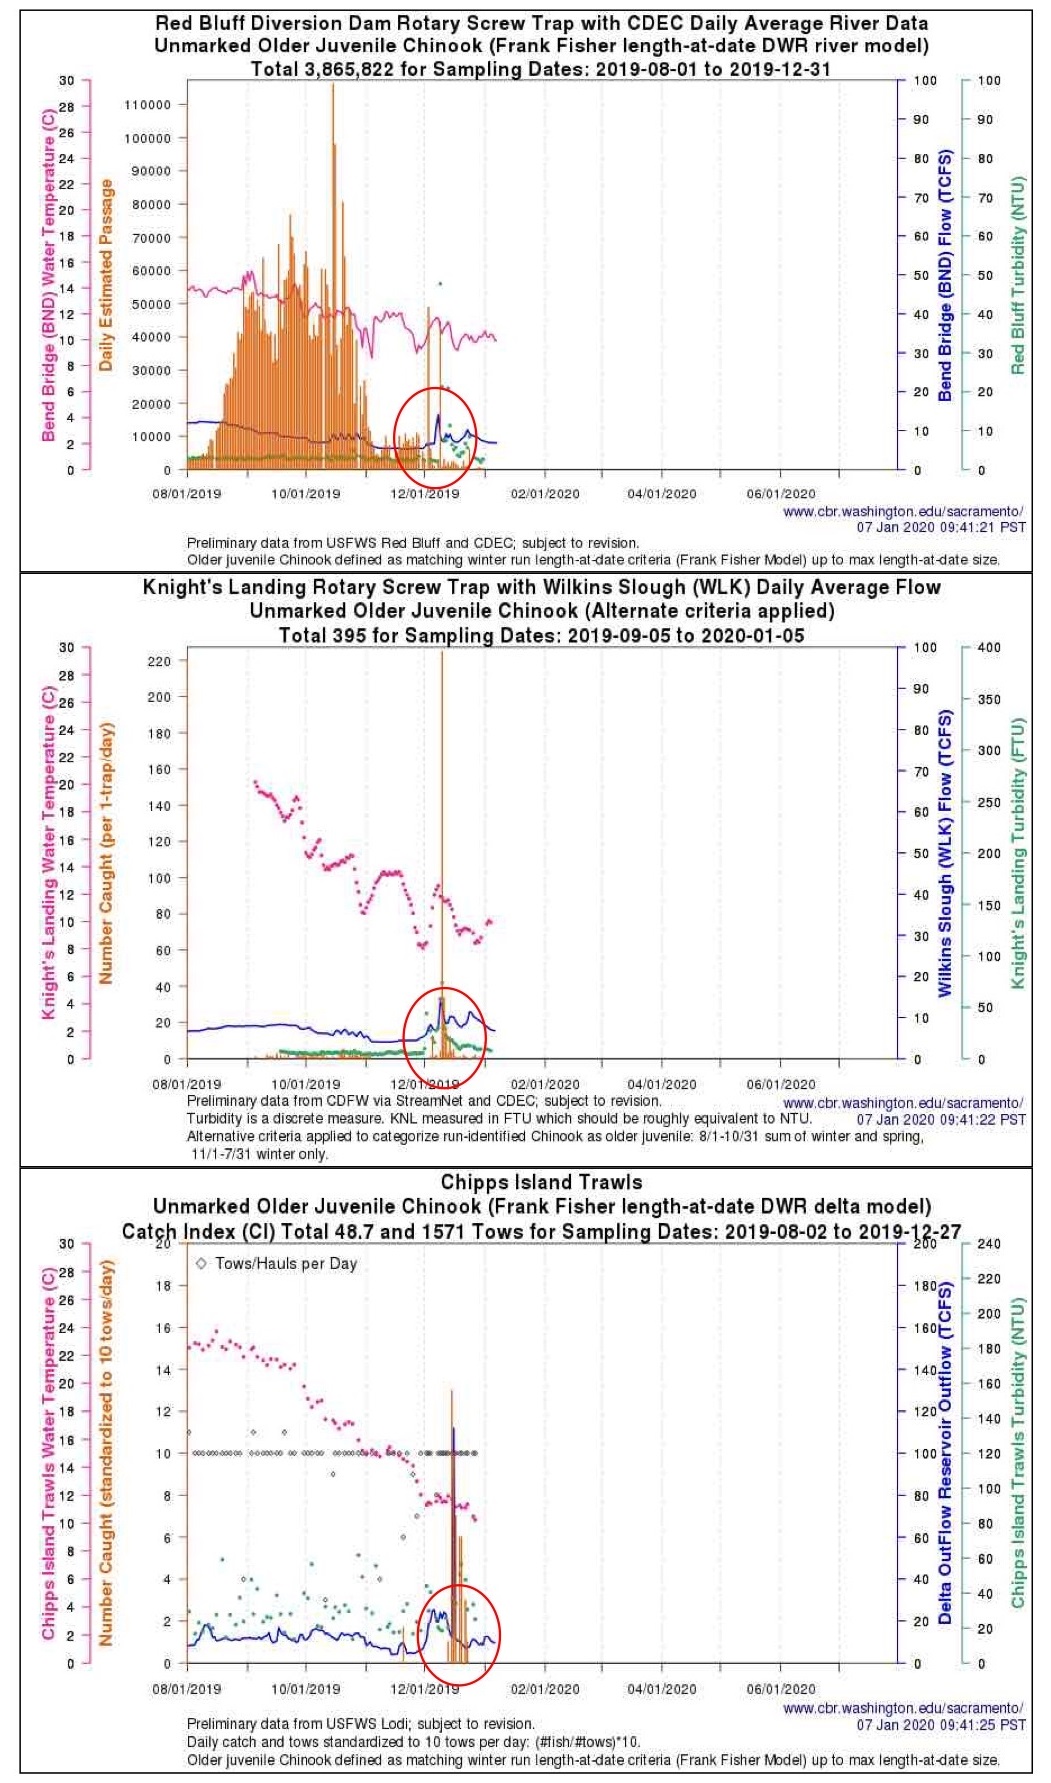
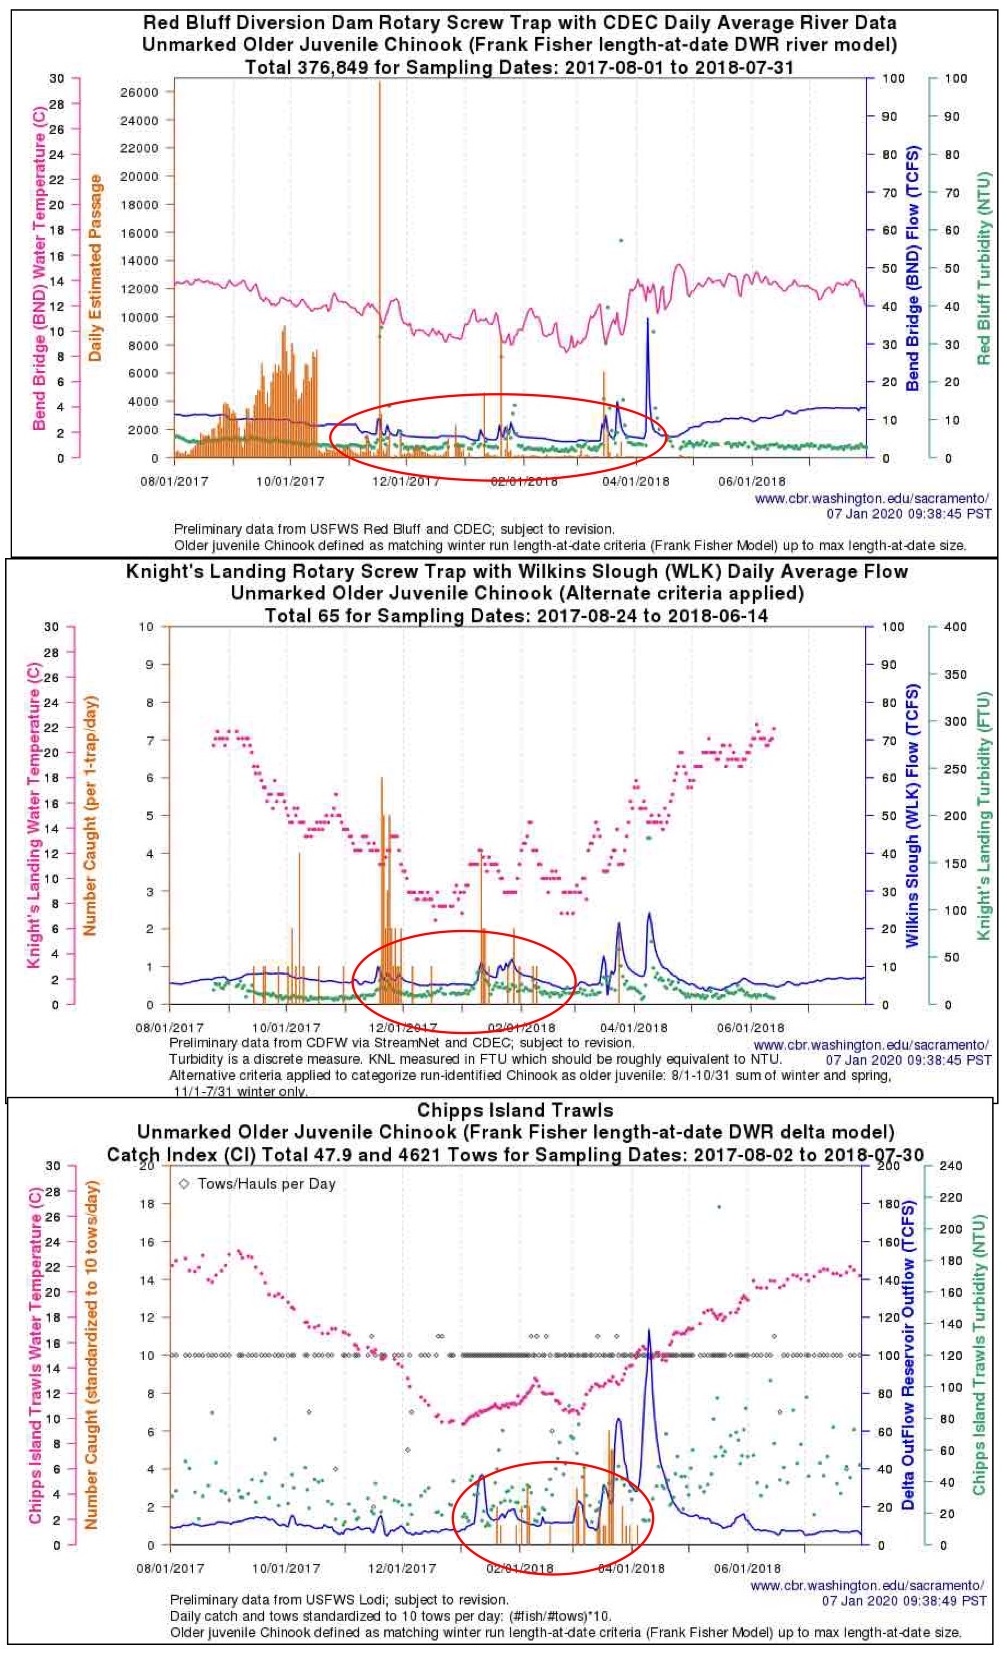
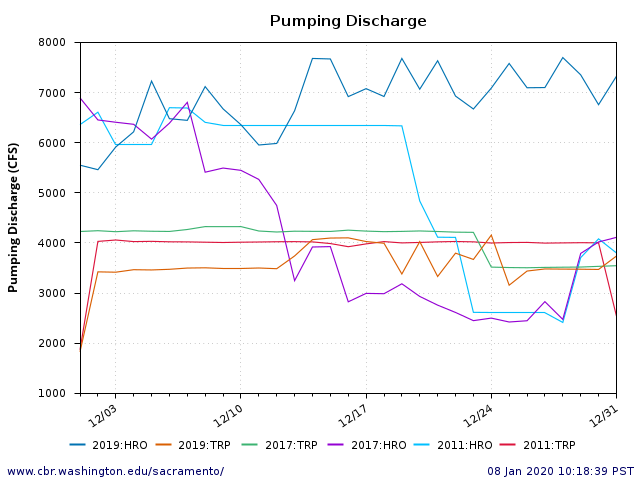
My own review indicates that what looked like, walked like, and quacked like a “first flush” occurred in mid-December. The lack of OMR limit protections and the allowance of maximum exports during and after the first flow pulse under the new BO’s in December 2019 led to what appear to have been grave risks to endangered salmon and smelt.2 The highly negative OMR flows in December were highly unusual and were not the norm under the prior BO’s (Figures 5 and 6). Regardless of the purported commitment to protect Delta native fishes in the new BO’s, Figure 4 shows the real effect of the new BO’s: the export of more water to southern California.
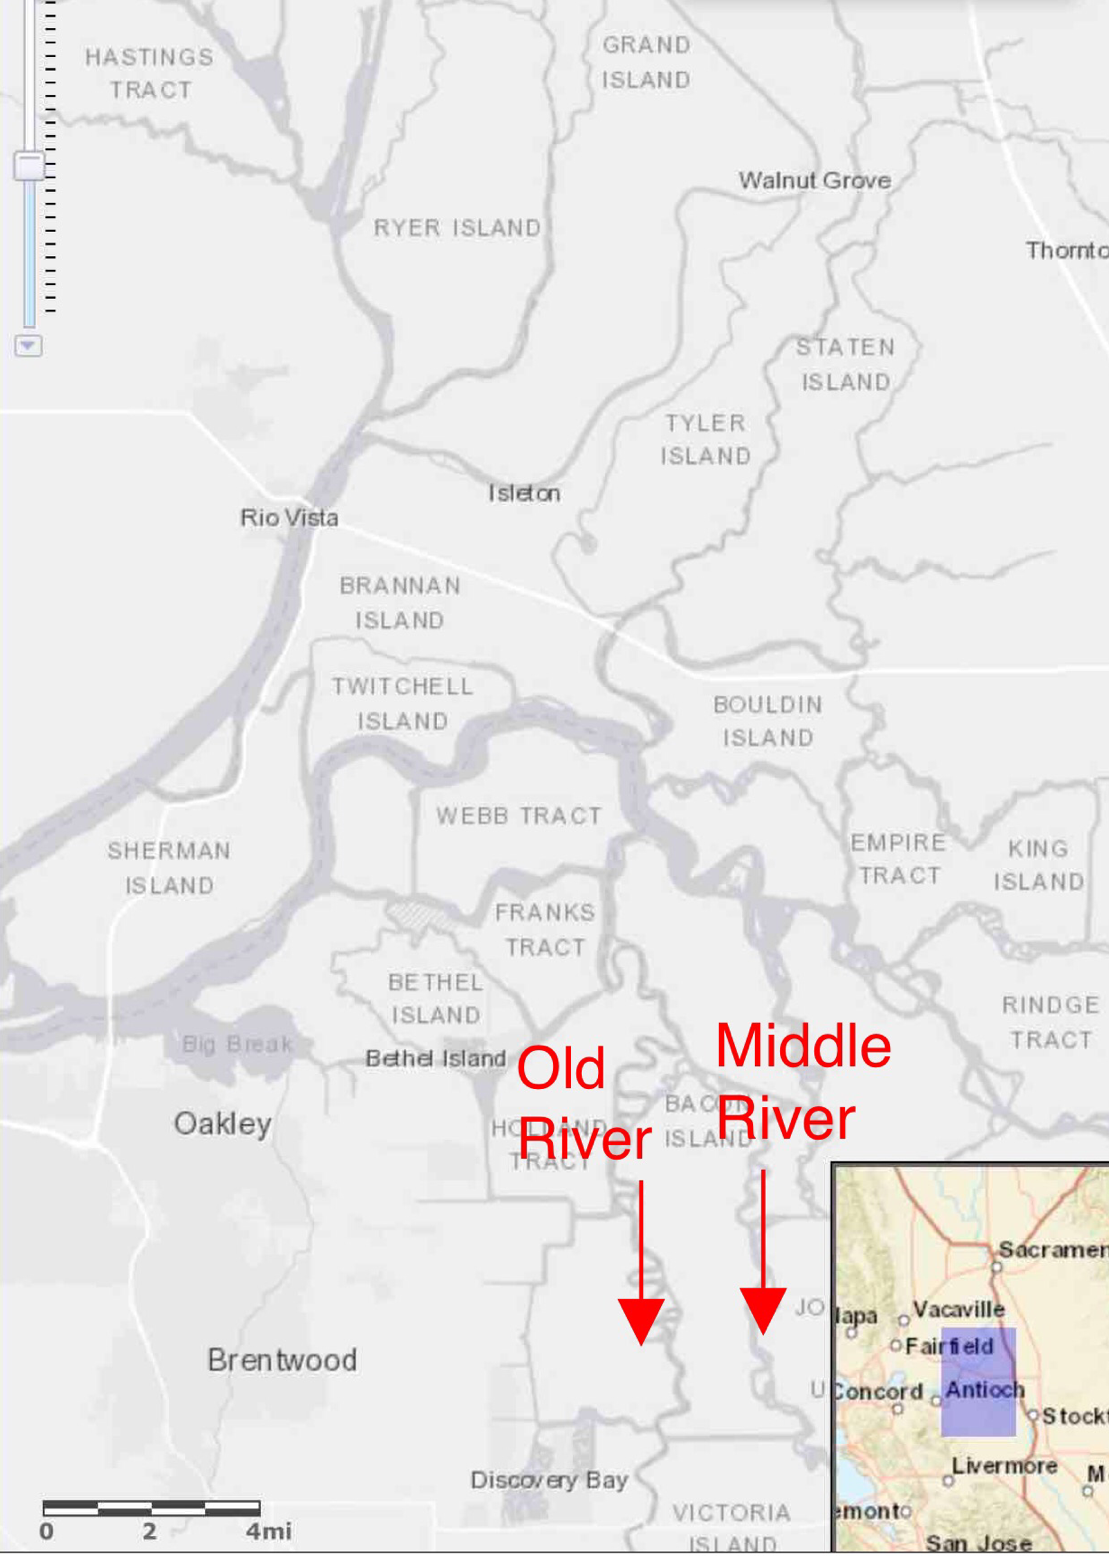
Figure 1. Old and Middle River and direction of negative net OMR flows.
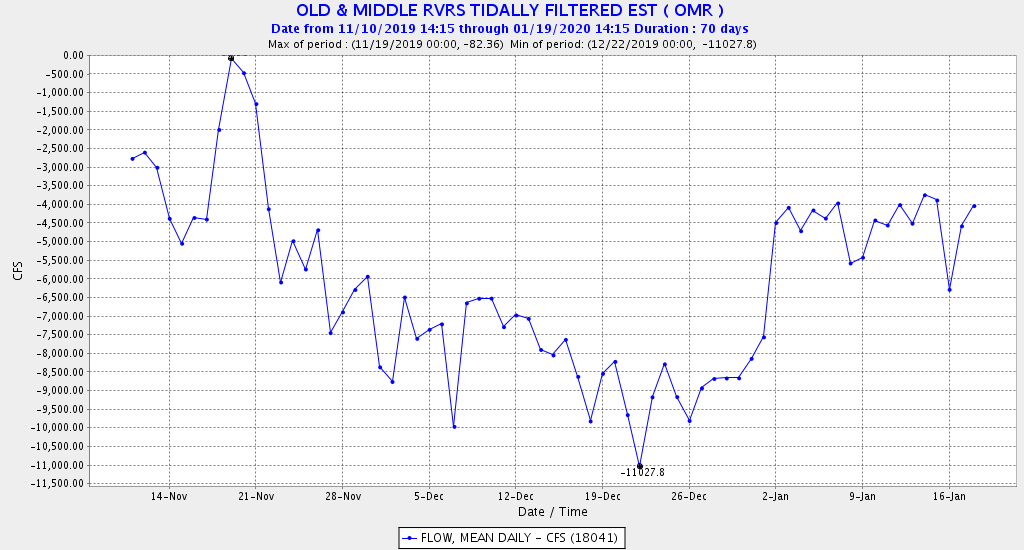
Figure 2. Net daily-average OMR flows in the south Delta 11/11/19-1/17/20. Note the extremely negative flows during December that occurred because high south Delta exports are permitted under the new BO’s. Flow remained highly negative even during the period of higher outflow in early December shown in Figure 3. Source: CDEC.
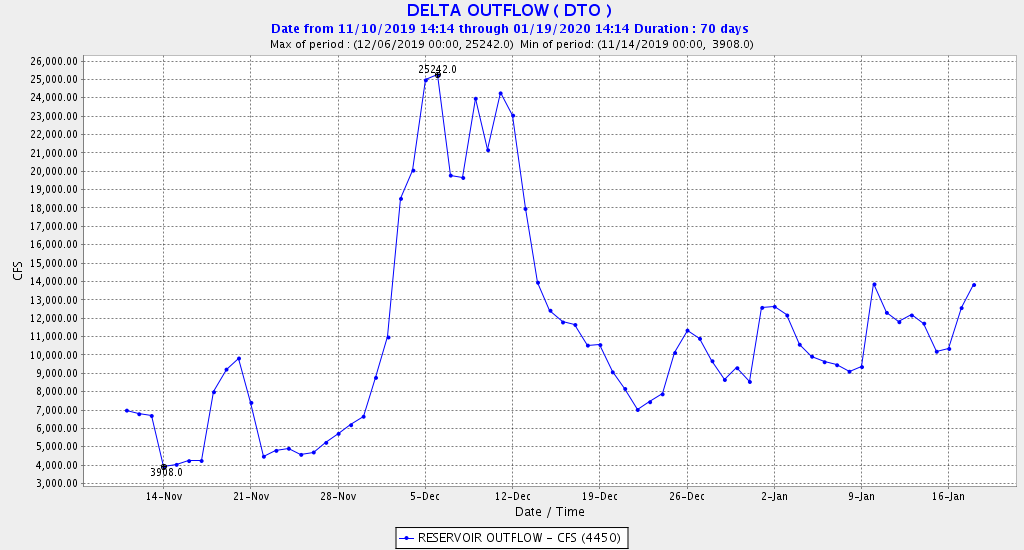
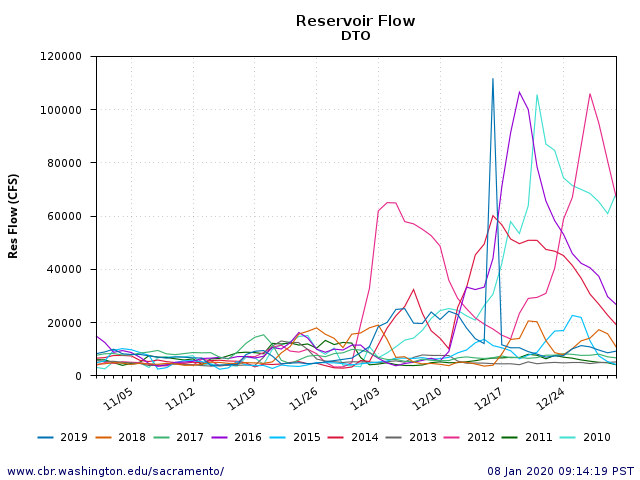
Figure 3. Net Delta outflow 11/11/19-1/17/20. Note pulse of outflow from spate of storms in first half of December. Source: CDEC.
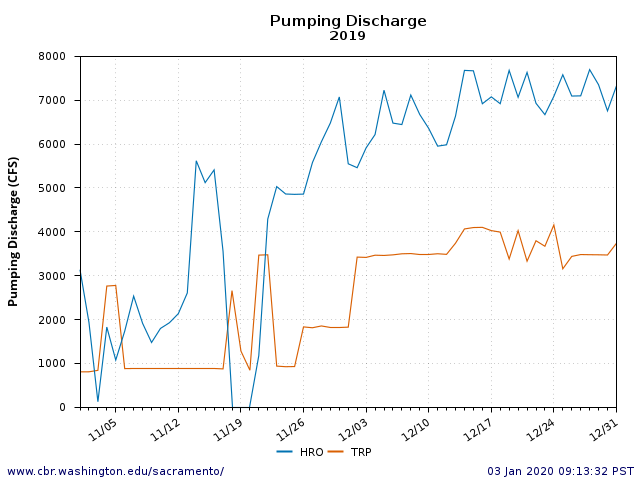
Figure 4. Export rates (cfs) at the federal Tracy (TRP) and state Harvey Banks (HRP) pumping plants in November-December 2019. Rates were near maximum throughout December.
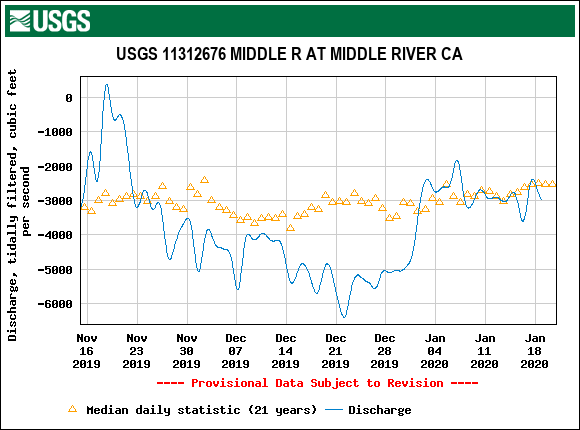
Figure 5. Middle River flow 11/15/2019-1/20/2020 with average for prior 21 years.
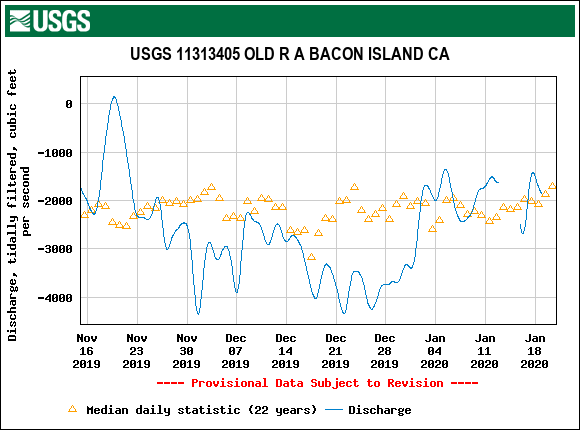
Figure 6. Old River flow 11/15/2019-1/20/2020 with average for prior 22 years.
- Biological Opinions for the Reinitiation of Consultation on the Long Term Coordinated Operations of the Central Valley Project and State Water Project – Summary (USFWS 10/1/2019). https://www.fws.gov/sfbaydelta/cvp-swp/documents/ROC_on_LTO_Summary_FINAL.pdf ↩
- http://calsport.org/fisheriesblog/?p=2981, http://calsport.org/fisheriesblog/?p=2991, http://calsport.org/fisheriesblog/?p=3006 ↩