The Bureau of Reclamation recently released an Environmental Assessment for the Sacramento Deep Water Ship Channel Nutrient Enrichment Project. The proposed project would directly release nitrogen nutrients into the Ship Channel, which runs from West Sacramento to Cache Slough, north of Rio Vista. The project is designed to stimulate plankton blooms in the North Delta as part of the Delta Smelt Resilience Strategy, which describes the goal as follows:
The purpose is to determine if the addition of nitrogen can stimulate plankton (fish food organisms) production in a section of the ship channel, which is isolated from the Delta in terms of water flow.
Adding nitrogen to the ship channel will indeed stimulate plankton productivity. Only a few miles away, regional governments have spent decades in removing nitrogen (most recently, ammonia) from the effluent of the Sacramento Regional Wastewater Treatment Plant to reduce production of blue-green algae in the Delta. The City of West Sacramento already seasonally releases high nutrients, metals, and salts into the Ship Channel. Adding more nitrogen could easily increase toxic blue-green algae problems in the Delta, similar to the bloom that recently led to the recreational closure of southern California’s Diamond Valley Reservoir, which receives Delta water.
There is higher plankton productivity in the Ship Channel than in nearby Delta channels because the Ship Channel has longer residence time, higher nutrients, and higher water temperatures. The broken gate on the Ship Channel’s northern entrance contributes to these conditions. However, lack of circulation also leads to nitrogen depletion and declining plankton production, and there is limited seasonal replenishment of nitrogen.
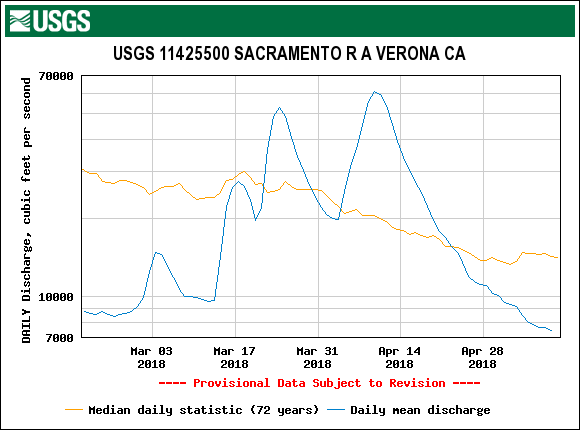
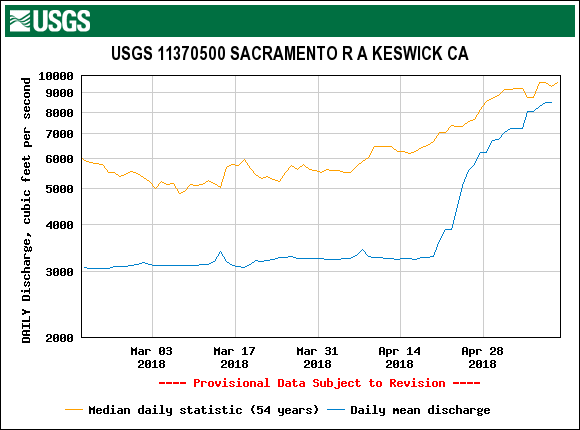
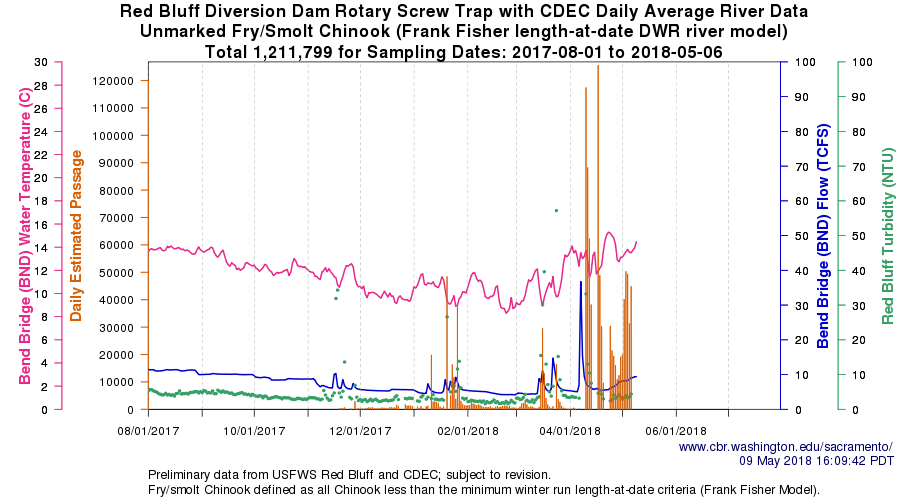
The Delta Smelt Resilience Strategy is considering increasing flows into the north Delta from the Colusa Basin Drain, Fremont Weir, and the Ship Channel to stimulate Delta plankton blooms. The biggest problem with these sources is high spring-through-fall water temperatures (Figures 1-3). Water temperature is certainly the greatest limiting factor in the north Delta for Delta smelt; adding nitrogen will not fix this problem.
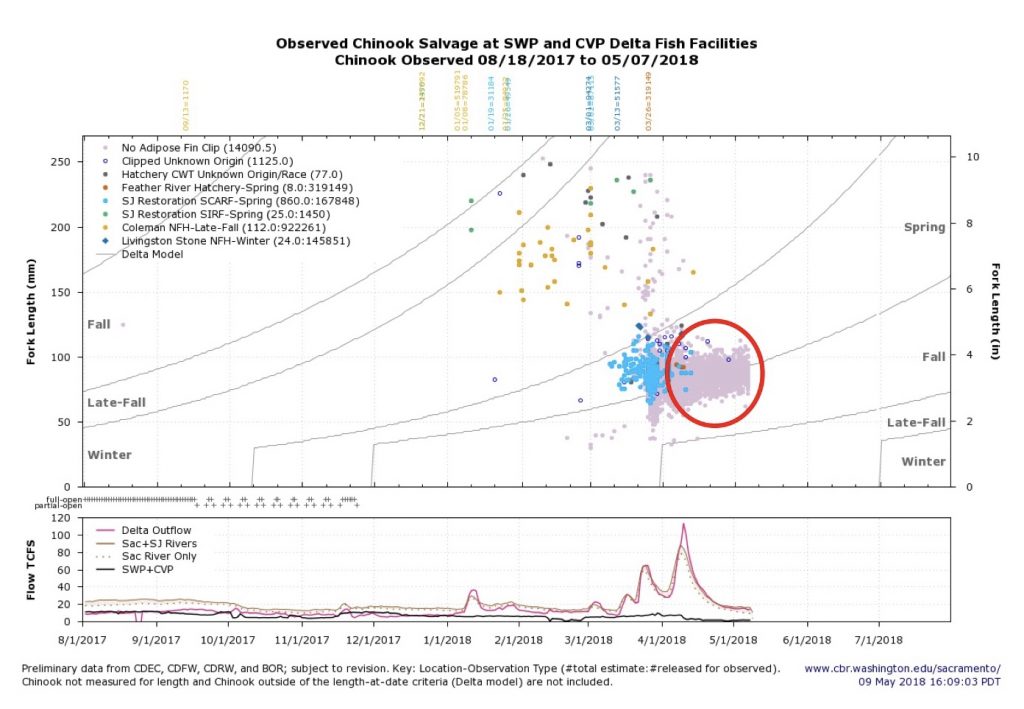
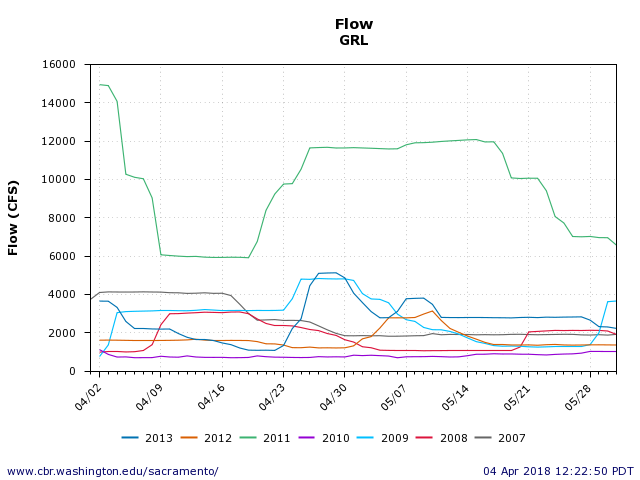
Fixing the gate at the north end and allowing cooler Sacramento River water (strong American River influence) into the channel (Figure 4) would reduce water temperatures in the Ship Channel. Just a few degrees can be life or death for Delta smelt. Increased entry into the Ship Channel of Sacramento River water would also introduce more nitrogen, potentially reducing the need to fertilize the Ship Channel with crop dusters.
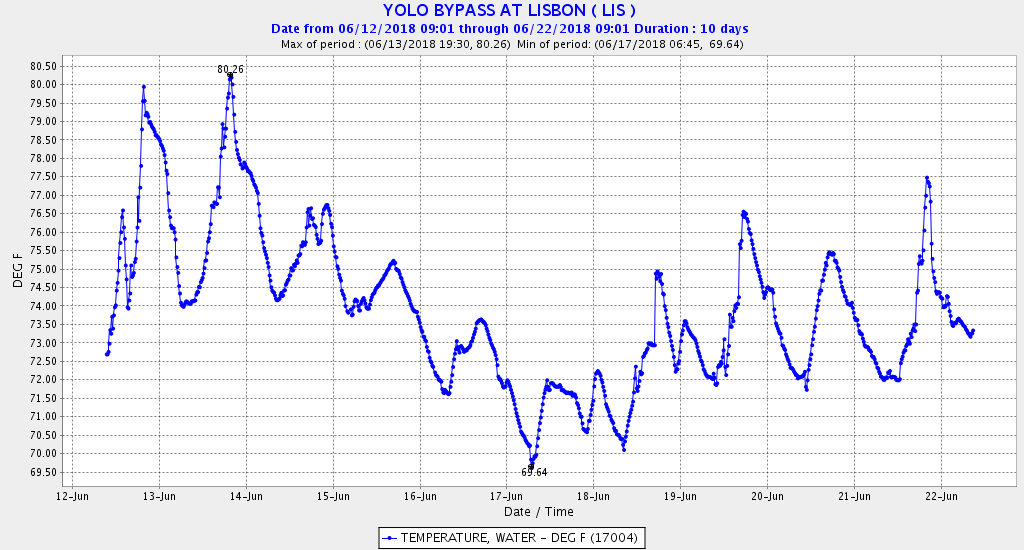
Figure 1. Water temperature in the Yolo Bypass downstream of the entrance of the Colusa Basin Drain.
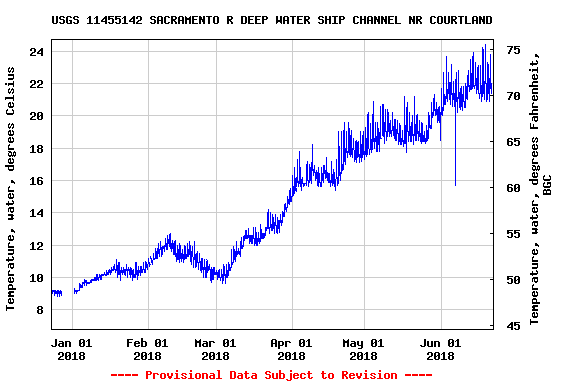
Figure 2. Water temperature in the Sacramento River Deep Water Ship Channel.
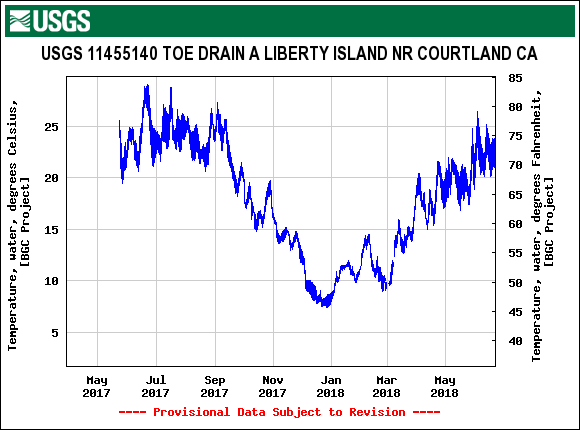
Figure 3. Water temperature in the lower Yolo Bypass toe drain canal near Liberty Island.
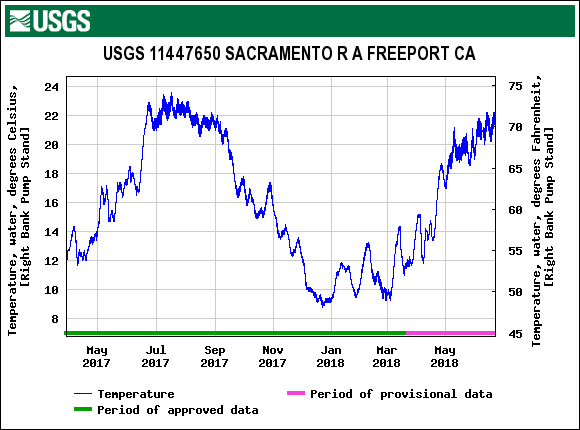
Figure 4. Water temperature in the Sacramento River near Freeport downstream of the entrance to the Sacramento River Deep Water Shipp Channel.