Winter-Run Chinook Salmon – What Really Caused Their Decline

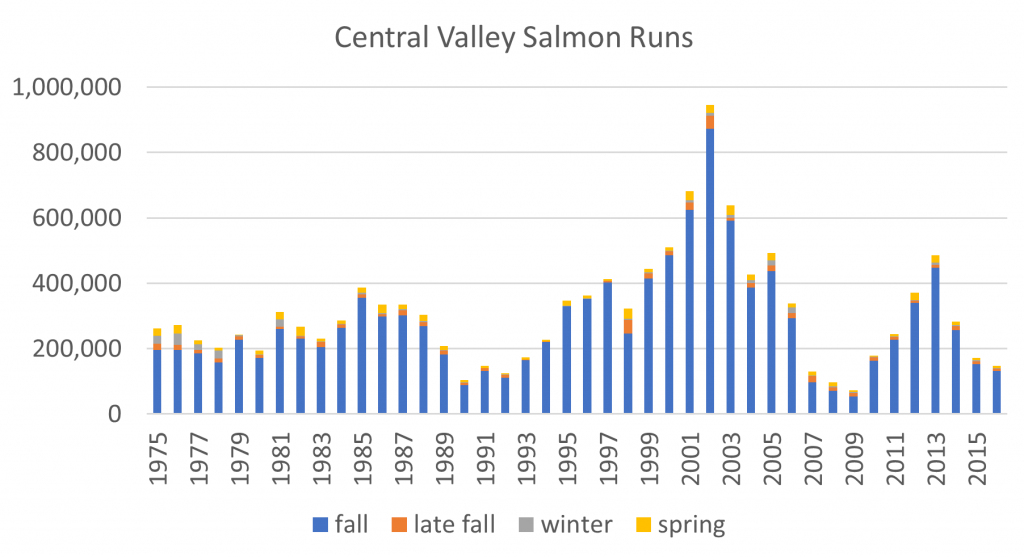
The winter-run Chinook salmon population crashed around 1980 and has not recovered (Figure 1). The population started coming back from 2001-2006 but fell to 827 in 2011. It remained in the 1500 to 6000 range from 2012-20161 with the help of the Livingston Stone federal hatchery near Redding. Hatchery fish make up an increasing proportion of the population each year.

In a 2011 review, NMFS attributed the general population decline to “blockage of access to historic habitat, other passage impediments, unscreened water diversions, heavy metal pollution from mine runoff, disposal of contaminated dredge sediments in San Francisco Bay, ocean harvest, predation, drought effects, juvenile losses at the CVP and SWP Delta pumping facilities; and elevated water temperatures in spawning grounds.”  Droughts and the loss of cold water pool in Shasta are generally considered the primary cause of the decline over the past four decades starting with the 1976-1977 drought.  The decline continues despite “reduced harvest impacts, Iron Mountain Mine clean up, screening of water diversions, altered CVP water operations that improve passage and reduce predation, and construction of a temperature control device on Shasta Dam”. 

A range of actions is being implemented to help recover this NMFS-designated “Species in the Spotlight.”  The problem is the actions do not include the one key factor that was a major cause of the original decline and the primary cause of the lack of recovery:  high late-fall and early-winter Delta exports cause high juvenile salmon mortality in the Delta.

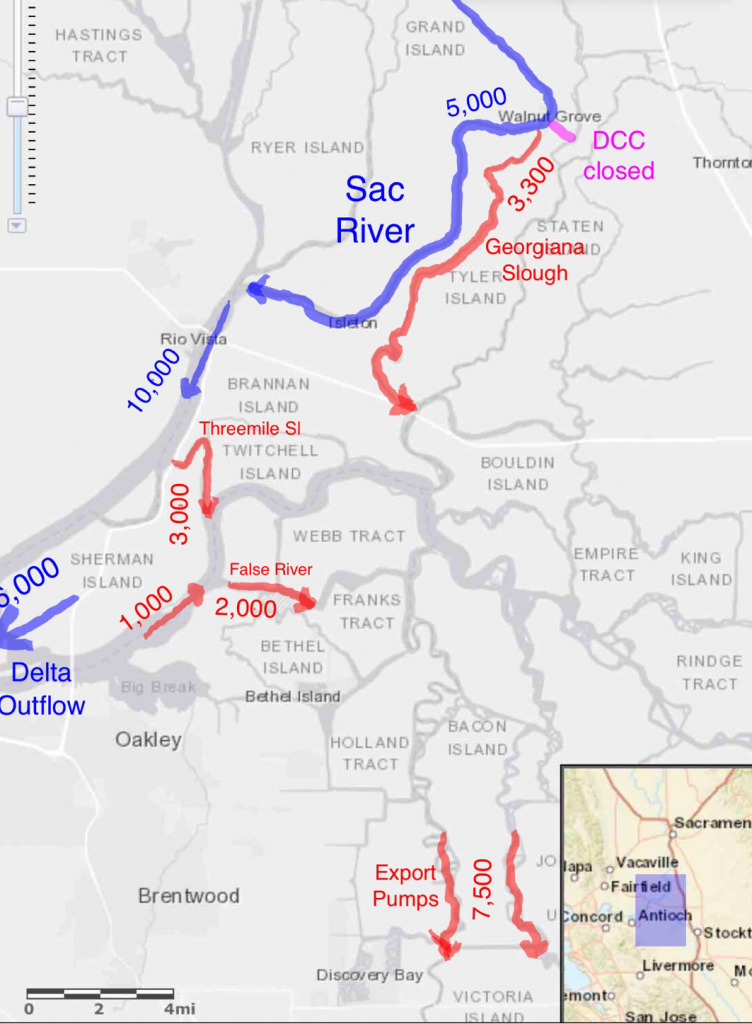
The problem starts from the fact that winter-run juveniles leave the upper Sacramento River rearing area for the Bay-Delta and eventually the ocean with the first fall or early winter rains that produce flow pulses from undammed Sacramento River tributaries.  These same untamed flows are also a primary target of the state and federal export facilities in filling south-of-Delta storage depleted from the summer.  Delta exports have few restrictions in fall.  The allowed export-to-inflow ratio is 65% (compared to 35% in winter-spring).  There are no OMR limits.  Interior Delta flows caused by high exports reach -10,000 cfs, compared to -5000 cfs in winter-spring.  The Delta Cross Channel is usually open through the fall and closed in winter, allowing salmon to move from the Sacramento River to the interior Delta more easily in fall.  Higher fall exports are also a consequence of increasing winter-spring protections (in water quality control plans and endangered fish biological opinions) for fish that led to reduced exports in those seasons.  Fundamentally, higher fall exports were a result of the state export facilities coming on line in the mid-1970s, which increased the export capacity from 4,400 cfs to 15,000 cfs.

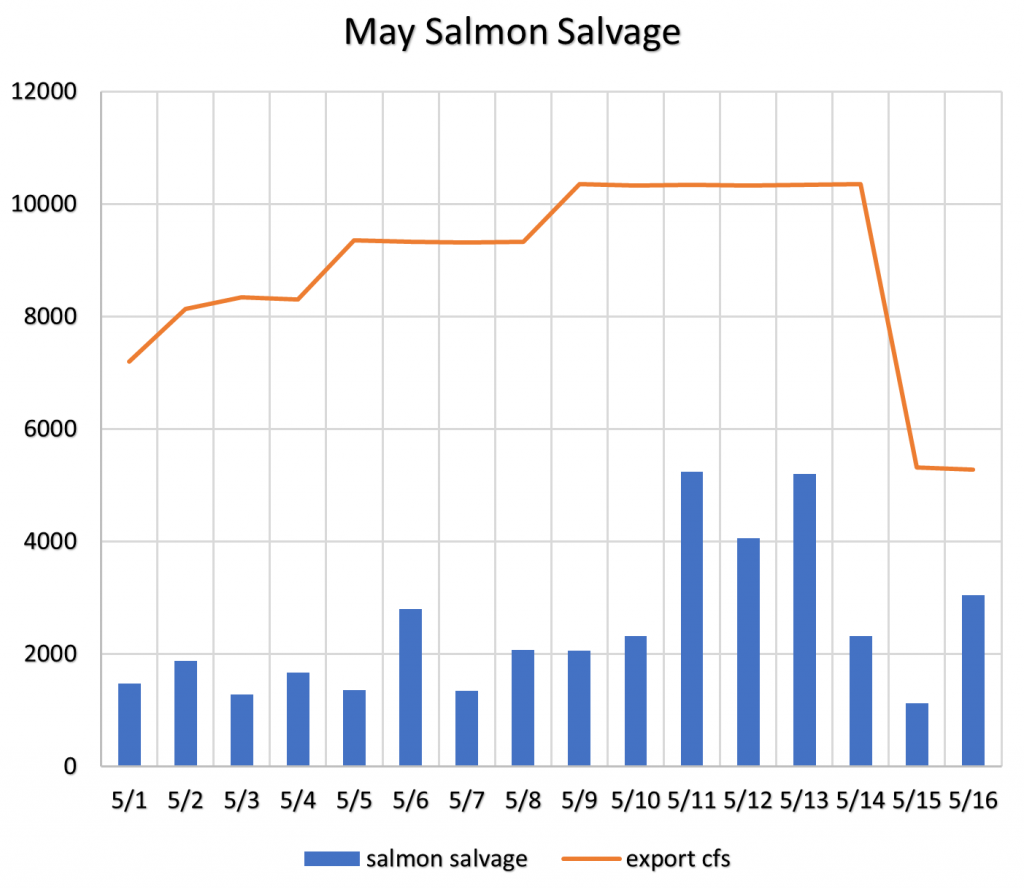
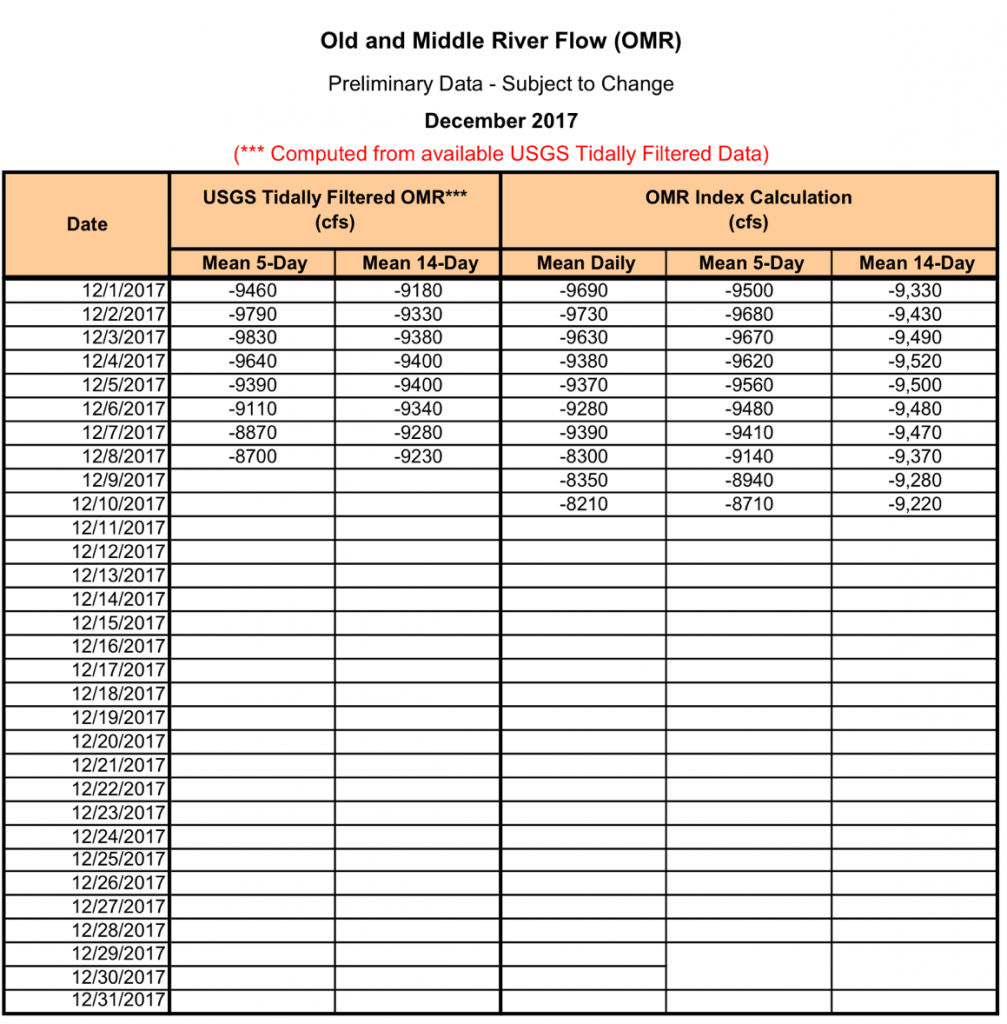
One need only look at the increase in fall export rates and juvenile salmon salvage in the south Delta to see the association with the decline of winter-run.  Figure 2 shows CVP exports in 1984-1985 compared with the historical average.  Figures 3 and 4 show fall exports in the example years.  Figure 5 shows fall 2016 exports and Delta inflow, which is compelling proof that the problem continues.2  Figure 6 shows high negative Old and Middle River (OMR) flows caused by high exports.  Figure 7 shows December Chinook salmon salvage at south Delta fish facilities.  Further evidence of the association between fall exports and the decline of winter-run is available in the long-term fish salvage data that dates back to the 1970s historical period depicted in Figure 1.  Further discussion on the risk of high fall and early winter risks to salmon from exports is presented in http://calsport.org/fisheriesblog/?p=1949 .

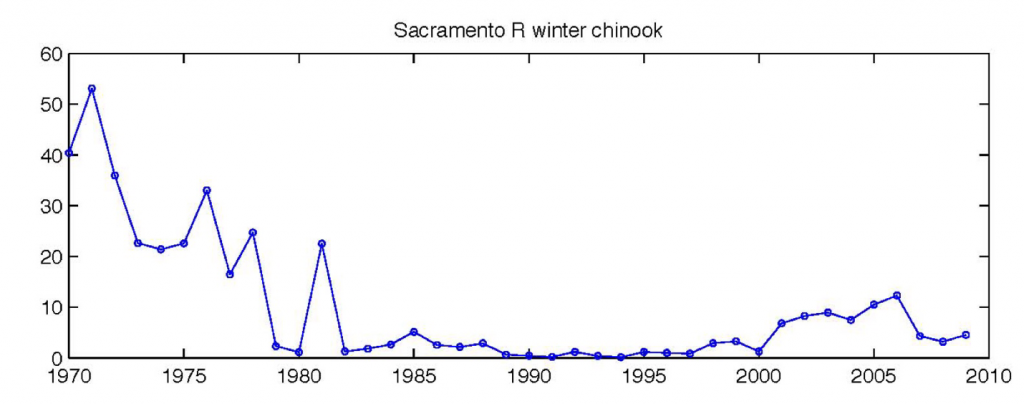
Figure 1. Trend in winter-run salmon escapement to the Sacramento River below Shasta Reservoir 1970-2009 in thousands of adult salmon. Source

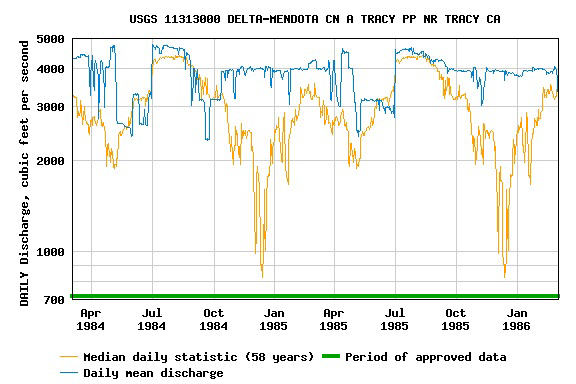
Figure 2. Tracy (federal) export rate in 1984-1986, with mean daily export rate 58-year average. Note marked increase in Nov-Dec period over historical average.

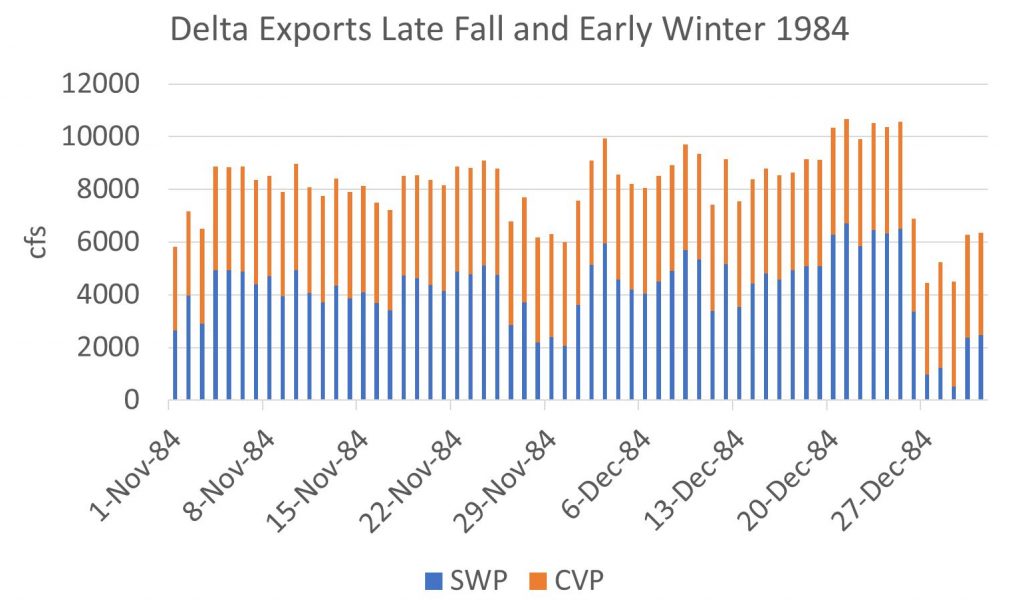
Figure 3. Federal and state export rates in fall 1984.

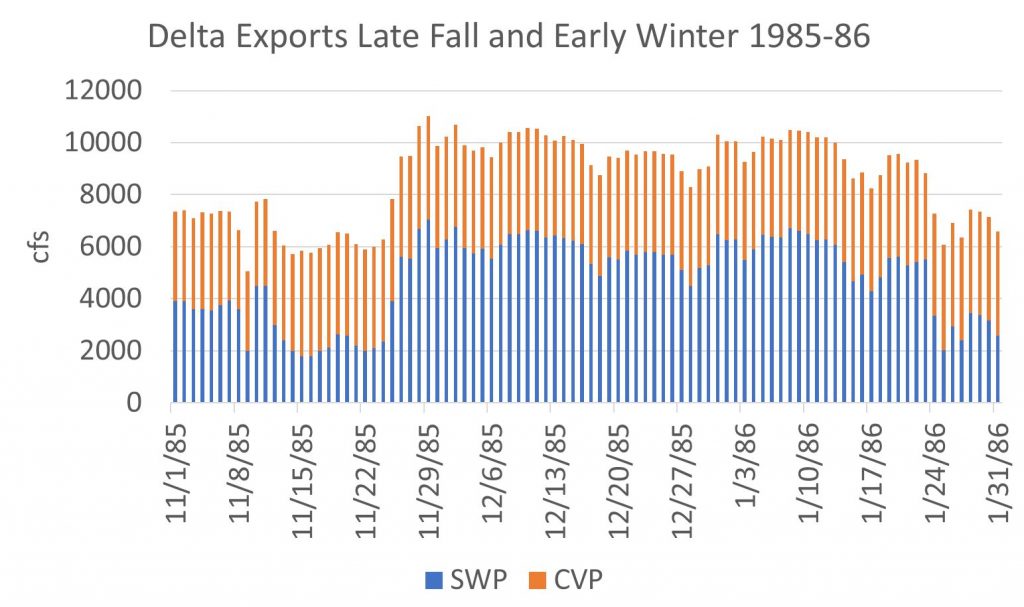
Figure 4. Federal and state export rates in fall 1985.

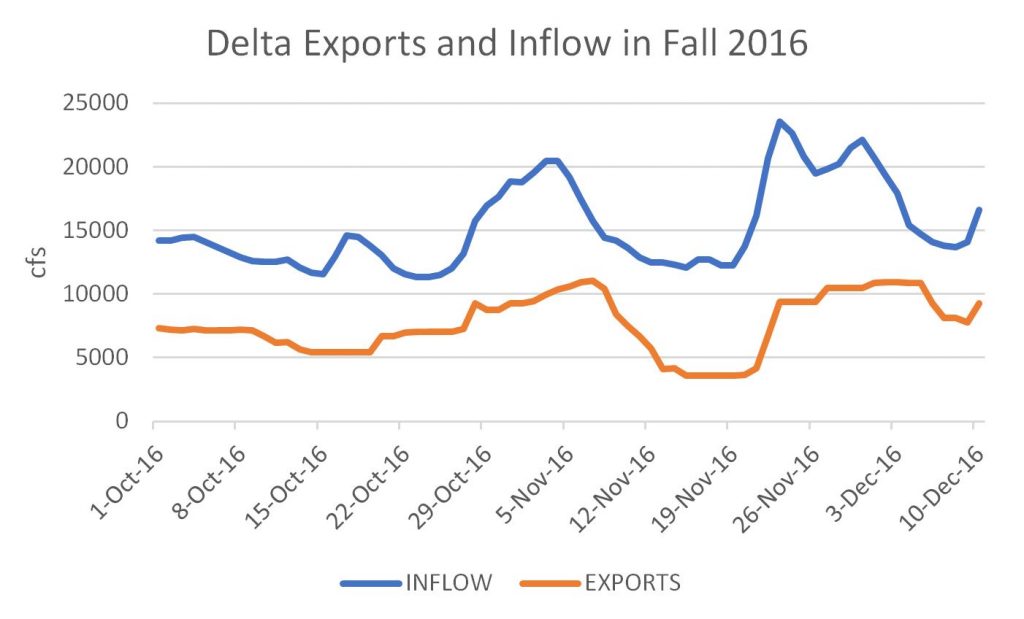
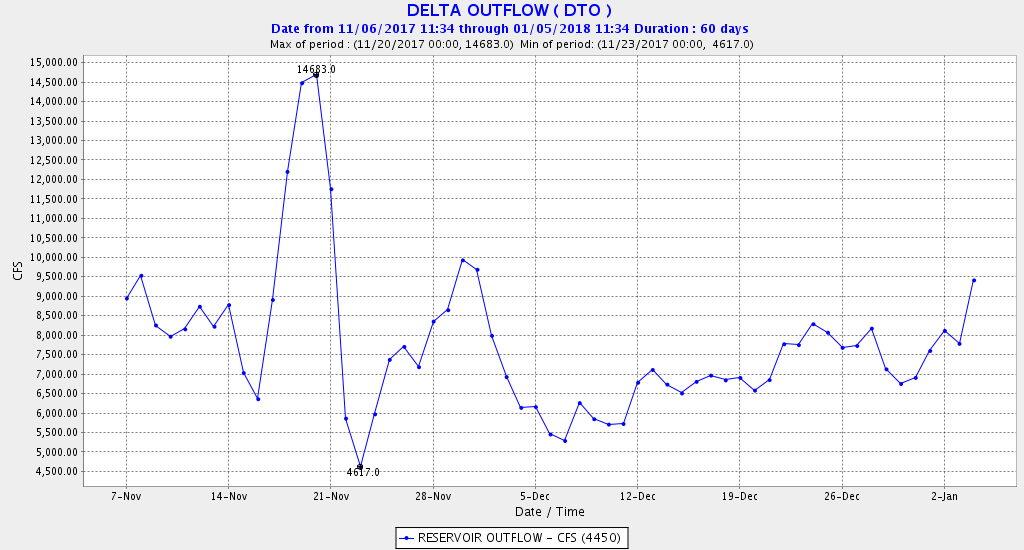
Figure 5. Delta export and inflow rates in fall 2016.

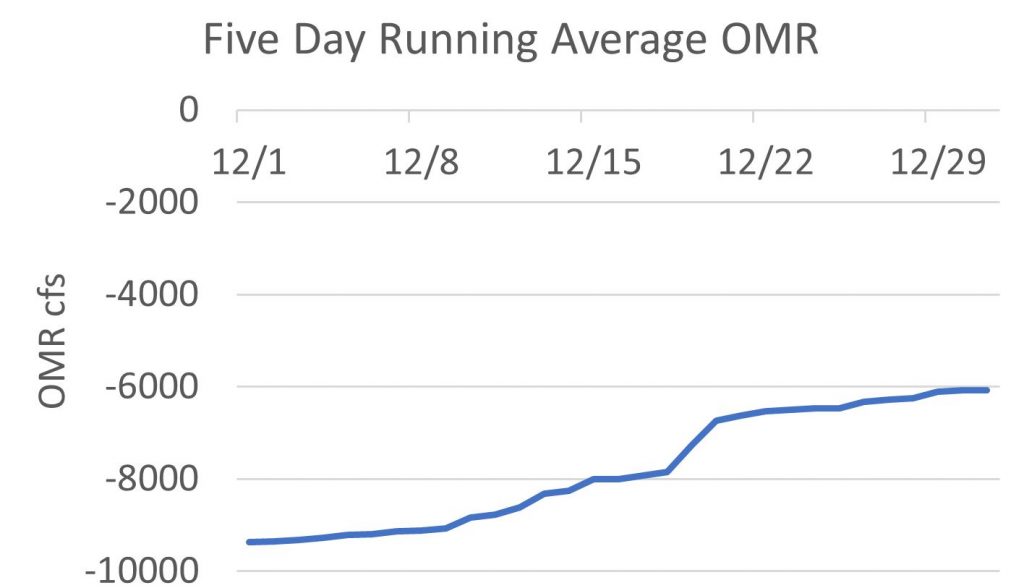
Figure 6. OMR December 2016.

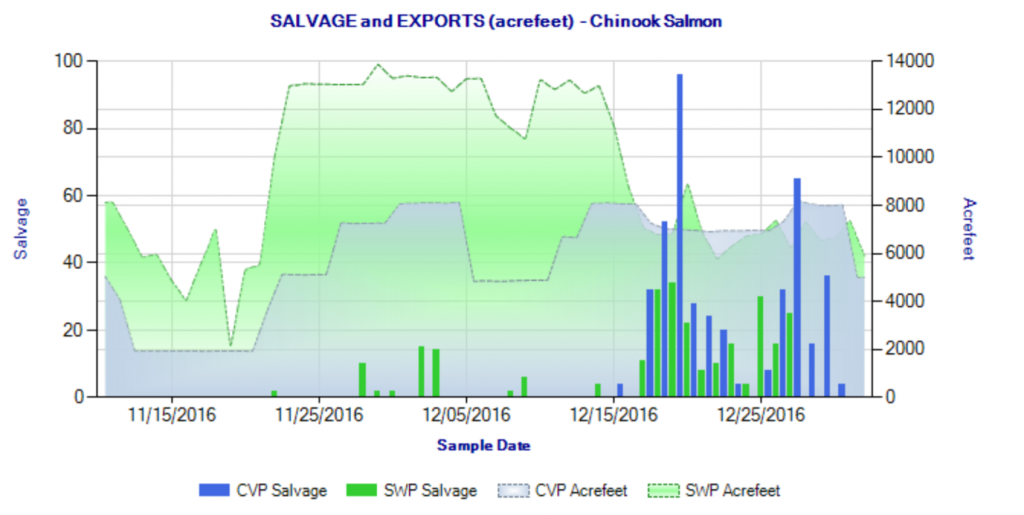
Figure 7. Chinook salvage fall 2016.

  1.  https://nrm.dfg.ca.gov/FileHandler.ashx?DocumentID=84381
  2. Exports were greater than 10,000 cfs from 11/19/17 to 12/8/17.

Measures to Save the Delta and Delta Smelt

The key to saving the Bay-Delta Estuary and its native fish community is keeping the Low Salinity Zone (LSZ) and its brackish water out of the Delta, especially the south Delta where the federal and state project pumps are located.  The native fish of the estuary, both in the Bay and Delta, depend on potency or productivity of the LSZ.  Much research has shown that low Delta freshwater outflow allows the LSZ to move into the Delta, to the detriment of overall ecological productivity and of the survival and production of native fish (and most pelagic species and their food supply).  Allowing the LSZ to move into the Delta allows the export of the LSZ from the south Delta, to the detriment of native fish and their critical habitats.  Increased salinity also harms agricultural and municipal water supplies.

Keeping the LSZ out of the Delta means keeping salinity (as measured by electrical conductivity or EC) below 500 EC.  The 500 EC level is sometimes called the “salt front” or the upstream head of the LSZ.  Another measure of the LSZ is X2, the heart of the LSZ, approximately 3800 EC.  The State Board has defined the Emmaton gage on the Sacramento River channel and Jersey Point gage on the San Joaquin River channel as the western edge of the Delta in terms of Delta agriculture and set wet year standards of a maximum 500 EC for the spring to fall irrigation season.  These standards have kept the LSZ out of the Delta in summer of wet years to the benefit of Delta agriculture and native fishes (and non-native striped bass).  However, the standard is also needed in the non-irrigation season when high Delta exports often occur.

Suggested measures to save the Delta:

  1. Do not allow south Delta exports to exceed a minimum (often prescribed as 1500 cfs) when Jersey Point and Emmaton gages exceed 500 EC.
  2. Place barriers on False River and Dutch Slough channels when their gages may exceed 500 EC.
  3. Open the Delta Cross Channel (DCC) to maintain a balanced EC at the Jersey Point and Emmaton gages and ensure positive outflow from the Delta at Jersey Point (often referred to as a positive QWEST). Closure of the DCC when EC rises at Jersey Point is detrimental to the LSZ when south Delta exports exceed 1500 cfs.
  4. Restrict Old and Middle River (OMR) negative flows to protect salmon and smelt from export facilities when these fish are in the interior Delta under freshwater conditions per biological opinions.
  5. Install or construct a permanent Head of Old River Barrier to keep San Joaquin salmon out of the south Delta in winter-spring under all export conditions.
  6. Increase San Joaquin River flows in the February-June time period.
  7. Keep Delta outflow at 8000-10,000 cfs in the fall after wet years to keep salt out of the Delta.

Example:  Water Year 2018

This new water year with its record November (wet) and December (dry) is a good example of what is wrong with the Delta.  Despite high reservoir levels for the beginning of a new water year1, Delta outflow was allowed to fall to 5000-7000 cfs in late November (Figure 1) as Delta exports literally sucked the freshwater bubble out of the Delta.  Exports averagedover 10,000 cfs from mid-November to mid–December, a time of year when there are no Delta controls.  The LSZ encroached at Emmaton (Figure 2), Blind Point (Figure 3), False River (Figure 4) on the west side of the Delta, Dutch Slough (Figure 5), and even showed up at the Rock Slough intake of the Contra Costa Water District in the south Delta (Figure 6).  See Figure 7 for the gage locations.

In conclusion, maintaining the 10,000 cfs Delta outflow necessary to keep the salt out of the Delta this past fall would have cost approximately 250,000 acre-ft of water from either the 18,000,000 acre-ft in storage or 1,500,000 acre-ft of Delta exports.  Doing so would have gone a long way toward protecting the past year’s production of winter-run smolts and pre-spawn Delta smelt that were both concentrated in the Delta.

Figure 1. Daily average Delta outflow for 11/7/17 to 1/4/18. Note each box-cell in chart represents approximately 7000 acre-ft of water. Maintaining a target 10,000 cfs to keep salt out of the Delta would have required an additional approximately 250,000 acre-ft of storage releases or export reduction.

Figure 2. The LSZ has encroached into the Sacramento River channel of the western Delta increasingly this water year. The limit should be 500 EC.

Figure 3. The LSZ has encroached into the San Joaquin River channel of the western Delta increasingly this water year. The limit should be 500 EC.

Figure 4. The LSZ has encroached into the central Delta via the False River channel from the western Delta increasingly this water year. The limit should be 500 EC.

Figure 5. The LSZ has encroached into the central and south Delta via the Dutch Slough channel of the western Delta increasingly this water year. The limit should be 500 EC.

Figure 6. The LSZ has encroached into the central and south Delta as seen at the Rock Slough gage of the south Delta increasingly this water year. The limit should be 500 EC.

Figure 7. Location of gages in above figures.

  1. As of December 1, Sacramento watershed reservoirs were 109% of average, and San Joaquin reservoirs were 150% of average.

Delta Smelt: End of 2017

In a recent post, I summarized the population dynamics of Delta smelt using the Summer Townet Index and Fall Midwater Trawl index relationships.  Since then, the California Department of Fish and Wildlife updated the Fall Midwater Trawl Index for 2017.  In turn, I update the relationships in Figures 1 and 2 below.  As I predicted in another post last fall, there was no uptick in the 2017 index, despite it being a wet year.  News articles on the subject suggest “no easy answers.”  To me it is obvious that the water project managers went out of their way to short smelt in 2017.  The prognosis for Delta smelt remains grim.

Figure 1. Log vs Log plot of fall FMWT Index of Delta smelt as related to the prior summer STN Index of abundance for that year. Blue years are wet water years (Oct-Sept). Green years are normal water years. Red years are dry and critical water years. Year types are as determined by the California Department of Water Resources for the Sacramento River runoff to the Bay-Delta Estuary (http://cdec.water.ca.gov/cgi-progs/iodir/WSIHIST).

Figure 2. Log vs Log plot of fall FMWT Index of Delta smelt (recruits) vs previous fall index (spawners). Blue years are wet water years. Green years are normal water years. Red years are dry and critical water years. Year types are as determined by the California Department of Water Resources for the Sacramento River runoff to the Bay-Delta Estuary (http://cdec.water.ca.gov/cgi-progs/iodir/WSIHIST).


How do we increase salmon runs in 2018 and beyond?

Over the past few months, I wrote posts on the status of specific runs of salmon in rivers throughout the Central Valley. In this post, I describe the overall status of salmon runs and the general actions to take to increase both escapement and fish available for commercial and sport harvest.

It was just over a decade ago that there were nearly one million adult salmon ascending the rivers of the Central Valley (Figure 1). At the same time, there were a millions more Central Valley salmon being harvested each year in sport and commercial fisheries along the coast and rivers of the Central Valley. Improvements in salmon management in the decade of the 1990s by the Central Valley Project Improvement Act, CALFED, and other programs had paid off handsomely with strong runs from 1999 to 2005. New and upgraded hatcheries, along with trucking hatchery smolts to the Bay, significantly increased harvest and escapement to spawning rivers.

Figure 1. Central Valley salmon runs from 1975 to 2016 including fall, late fall, winter, and spring runs. Source of data: CDFW GrandTab.

By 2008-2009, escapement had fallen by over 90% to a mere 70,000 spawners of the four races of salmon.  Fishery harvests were greatly restricted by 2008.  The winter run, the most threatened of the four runs fell from 17,296 to 827 spawners in just five years.  Drier years from 2001-2005, poor ocean conditions in 2004-2005, record-high Delta water diversions, and the 2007-2009 drought were contributing factors in the declines.  Impacts to coastal communities and the fishing industries were severe.

Extraordinary recovery measures included closing fisheries and trucking most of the hatchery smolt production to the Bay or Delta.  Federal salmon biological opinions (2009, 2011) limited winter-spring water-project exports from the Delta.  Hundreds of millions of new dollars were spent on habitat and fish passage improvements in the Valley to increase salmon survival and turn around the declines in runs.  A look at Figure 1 indicates that these efforts proved effective in limiting run declines from the 2012-2015 drought compared to the 1987-1992 and 2007-2009 droughts.

However, the prognosis for the future is again bleak, especially for wild, naturally produced salmon.  The consequences of the 2012-2015 drought  have not fully played out.  Once again, projected runs are low, and harvests are likely to be restricted.  Actions are needed to minimize long-term effects and to help bring about recovery of wild salmon productivity and fisheries in general.

Actions for 2018:

  1. Reduce harvest: Sadly but necessarily, the Pacific Fisheries Management Council and states are likely to take this first step of– restricting the 2018 harvest in the ocean and rivers to protect wild runs.
  2. Improve spawning, rearing, and migrating conditions: Sadly, this past year’s rearing and migrating conditions in the Sacramento River were unnecessarily compromised.   Water temperature at Red Bluff reached above the 56oF prescribed in the biological opinion and Basin Plan.  The higher temperatures resulted from low Shasta Reservoir releases (less than 5000 cfs – Figure 2) despite a virtually full Shasta Reservoir.  The low flow and higher water temperatures likely affected salmon egg incubation, rearing, and emigration-immigration success.  Reservoir releases will be necessary to meet flow and temperature targets in all Central Valley rivers and the Delta.
  3. Limit Delta exports: Delta exports this past spring reached unprecedented highs not seen in recent decades, resulting in high salmon salvage rates at the Delta fish facilities (Figure 3).1 With high water supplies from this past wet water year 2017, there will be high exports again unless there are some constraints.  If anything, winter-spring exports should be reduced to allow salmon to recover.  April-May exports should be reduced, like they were in the 1990’s and 2000’s, to 1500 cfs.

Near term actions over the coming year:

  1. Transport hatchery smolts to Bay: The transport of millions of fall-run smolts from state hatcheries on the Feather, American, and Mokelumne rivers to the Bay provides higher rates of escapement and contributions to the fishery and low rates of straying.  Barge transport to the Bay offers potentially lower rates of predation and straying for federal hatcheries near Redding.
  2. Raise hatchery fry in natural habitats: Recent research indicates that rearing hatchery fry in more natural habitat conditions increases growth rates, survival, and contributions to escapement and fisheries.  Raising hatchery fry in rice fields is one potential approach.
  3. Restore habitats damaged by recent record high flows in salmon spawning and rearing reaches of the Central Valley rivers and floodplains: In nearly every river, habitats were damaged by the winter 2017 floods, requiring extraordinary repairs and maintenance to ready them again to produce salmon.
  4. Take further actions to enhance flows and water temperatures to enhance salmon survival throughout the Central Valley: Actions may include higher base flows, flow pulses, or simply meeting existing target flow and temperature goals.

In conclusion, managers should take immediate actions to minimize the damage to salmon runs from the recent drought and floods, using this past year’s abundant water supply.  They should avoid efforts to exploit the abundant water in storage for small benefits to water supply at the expense of salmon recovery, and should make every effort to use the water in storage for salmon recovery.

Figure 2. Upper Sacramento River flows and water temperatures in May 2017. The target water temperature for Red Bluff is 56oF. Source of data: USBR.

Figure 3. Export rate and young salmon salvage at South Delta federal and state export facilities in May 2017. The target export rate limit for May should be 1500 cfs. Source of data: USBR.

December 2017 – Risks to Salmon

With a potentially record-low rain total for December, the federal and state water projects are cutting reservoir releases but keeping up exports from the Delta, causing great peril to Central Valley salmon.  Figure 1 summarizes Delta conditions as of mid-December.

Figure 1. Major Delta net daily flows (cfs) in mid-December 2017. Map source: USGS. Data sources: USGS and CDEC.

For juvenile winter run, spring run, fall run, and late fall run Chinook salmon migrating down the Sacramento River, the risk is obvious.  With nearly 40% of Sacramento River inflow diverted at Georgiana Slough and another 30% diverted at Threemile Slough, less than half of the Sacramento River’s inflow to the Delta is reaching the Bay.  Of the total Delta inflow, only 45-50% is reaching the Bay.  Nearly all the San Joaquin River Delta inflow is being exported.

Assuming that the young salmon split with the flow, 60% of Sacramento fish are being diverted to the central Delta and near 100% of the San Joaquin fish are lost to the interior Delta.  With winter run and late fall run juvenile salmon from the Sacramento River moving into the Delta during the late November storms (Figure 2), there is a high risk that the diverted fish will be lost in the interior Delta.  Soon, spring run and fall run fry salmon will be moving into the Delta.

Under the conditions in the “Reasonable and Prudent Measures” required by the National Marine Fisheries Service’s Biological Opinion (BO) for the operation of the state and federal water projects, exports should be reduced when “large numbers” of juvenile salmon begin entering the Delta (Figure 3).  The finding that there are “large numbers” is based on monitoring of juvenile salmon at Knights Landing and Sacramento.  Peak catches in the past month were 3-7 per day (Figure 2).  This does not meet the level of 10 per day under which the BO would trigger reducing exports.   However, the trigger dates from a time when the Sacramento River was producing 6 to 10 times more  juvenile winter run salmon.  In the last four years, juvenile production of winter run in the upper Sacramento River near Redding has been at record low levels of 300,000 to 500,000, compared to 3.3 million in 2009 when the BO was published.   “Large numbers” today are understandably smaller than they were eight years ago.

Exports should be reduced immediately until outflow to the Bay increases dramatically.  January BO limits will require Old and Middle River (OMR) flows near the south Delta export pumps to be no more negative than 5000 cfs.  With December OMR flows in excess of -9000 cfs (Figure 4), exports should be reduced now to limit OMR to -5000 cfs or lower per BO Action IV.3 through the remainder of December.


Figure 2. Catch of unmarked older Chinook juveniles (likely winter run and late fall run) at Knights Landing and Sacramento in fall 2017. Data from CDFW and USFWS surveys as reported by www.cbr.washington.edu/sacramento/

Figure 3. Excerpt from p. 652 of NMFS BO 2009.

Figure 4. OMR flows in south Delta. Source: https://www.usbr.gov/mp/cvo/vungvari/OMR_Dec2017.pdf .