“State’s Delta smelt plan calls for more water flowing to sea” – This headline to a recent Sacramento Bee article speaks of the state and federal governments’ hope to get more water for Delta outflow to the Bay this summer to help Delta smelt after four devastating drought years. Smelt are at record lows, and their endangered status under the state and federal endangered species acts requires an effort to help recover them. When the Delta smelt plan was announced, this year’s Summer Delta Smelt Index had just come in at 0.0, the same as it was last summer.
A grand experiment began on July 15. With Shasta Reservoir releases held low to save cold water for salmon, more Delta outflow for the experiment was provided by reducing exports from 9000 cfs to 2000 cfs. Deliveries to South-of-Delta CVP and SWP contractors were cut to a minimum, even though the plan had promised: “[no] cuts to water supply planned.”
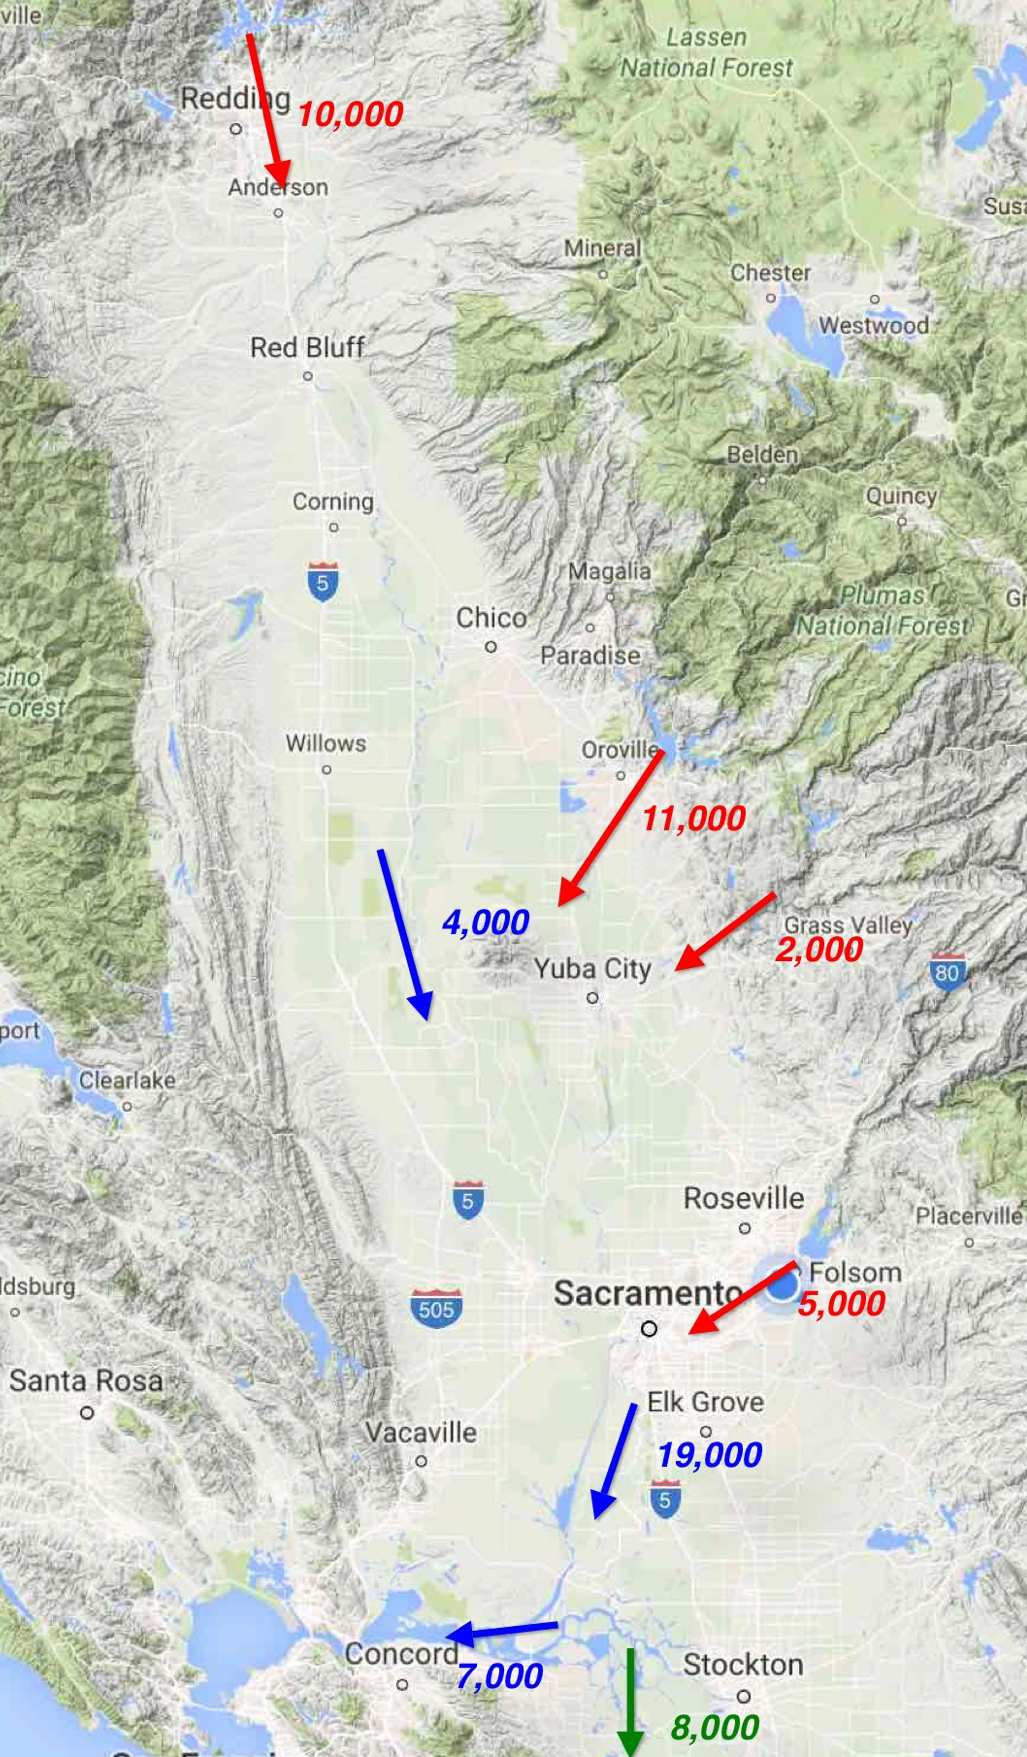
Conditions on July 12 can be seen in Figure 1. Reservoir releases and some natural river flow totaled approximately 30,000 cfs. Most (80%) of the 20,000 cfs of Delta inflow was coming from Oroville and Folsom reservoirs. Of that amount, only 7000 cfs was leaving the Delta for the Bay (the required minimum outflow in July of a Below Normal year under state standards is 6500 cfs). Approximately 6,000 cfs was being diverted from the upper Sacramento River below Redding. Another 3,000 cfs was being diverted from the lower river and its tribs. Another 4,000 cfs was diverted in the Delta. Finally, the state SWP was pumping 7000 cfs and federal CVP was pumping 1000 cfs from the south Delta.
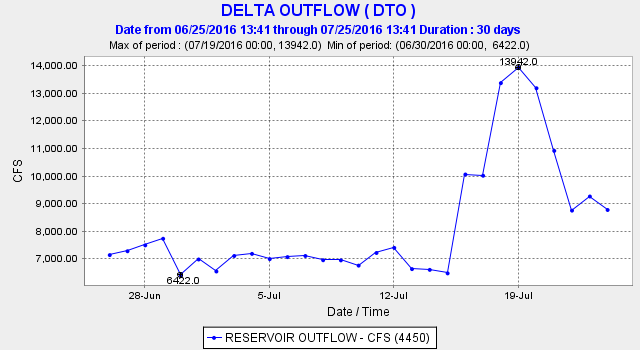
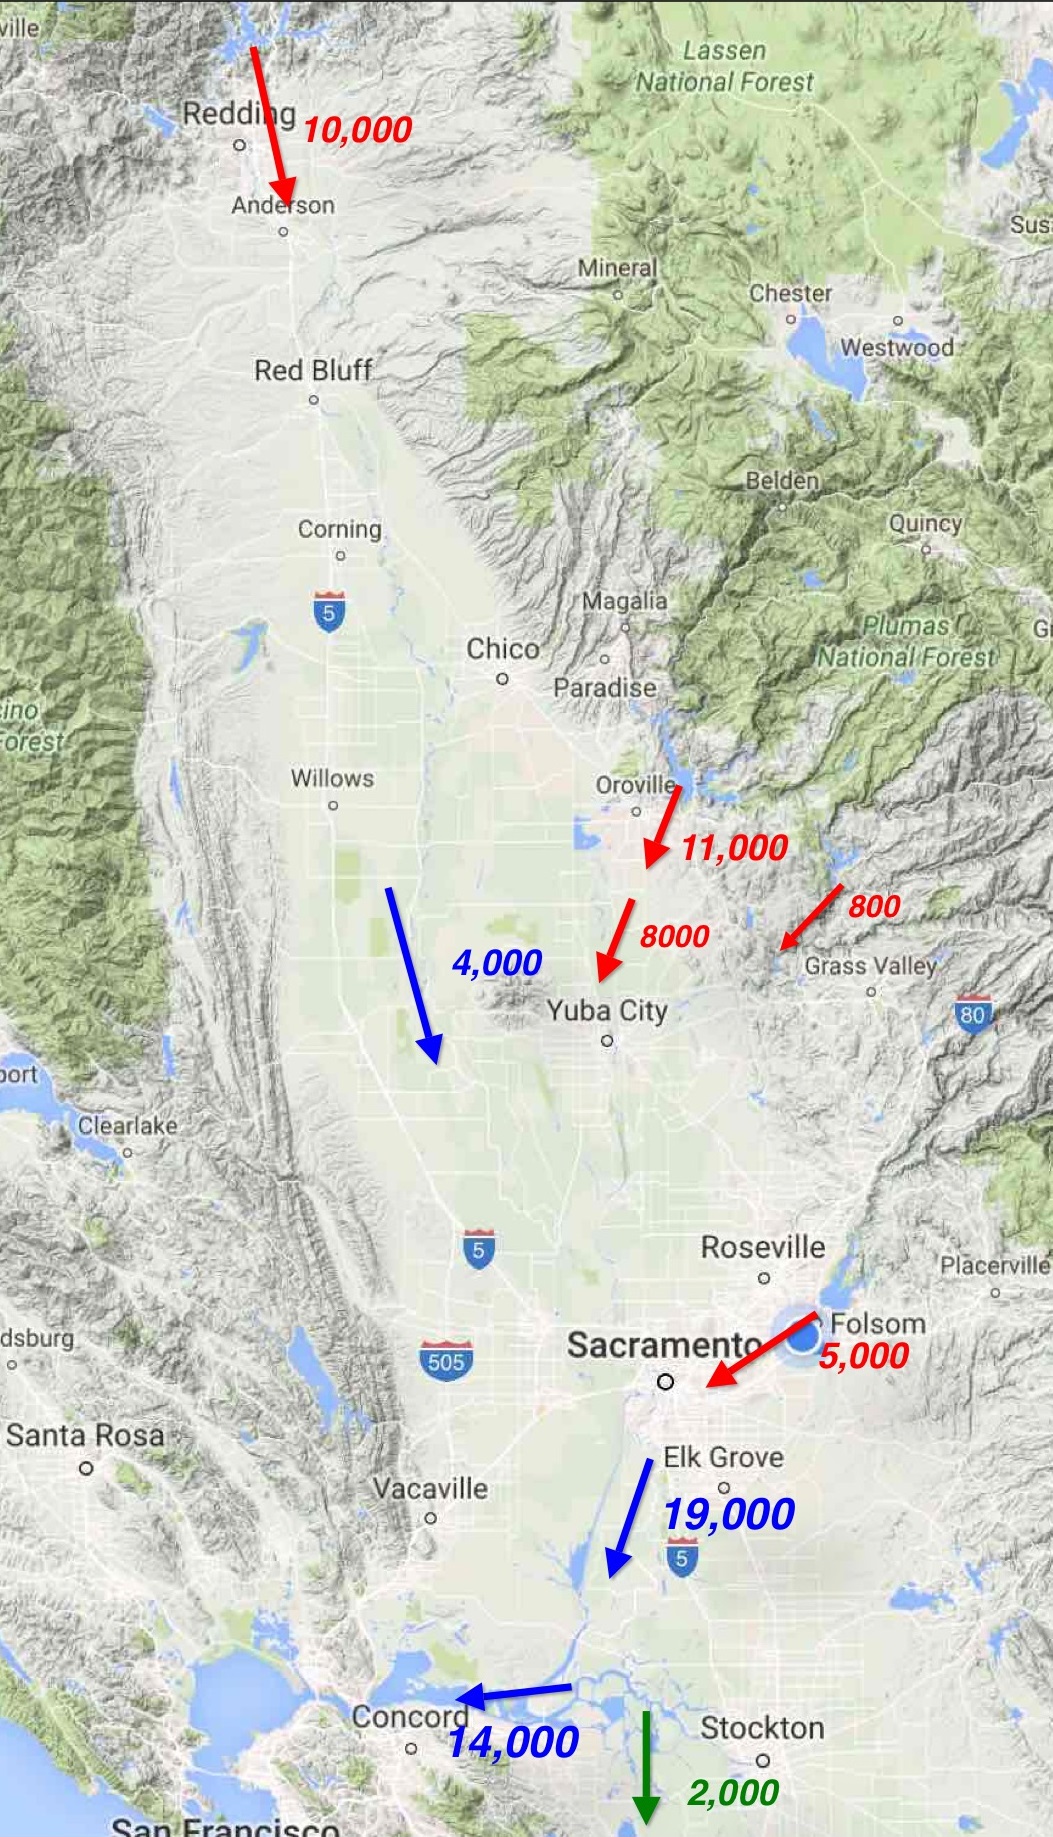
By July 15, conditions in the Delta changed. Delta outflow doubled, while exports were reduced by 80% (Figure 2).
We often hear about “adaptive management” to test things to see if they help or not. This is a big, very unprecedented adaptive management experiment. The purpose is to help Delta smelt recover from a dramatic decline over the past two decades. However, it will be difficult to help what is not there. There were few smelt out there a month ago; hopefully, there are still enough that the experiment will make a difference.
The important thing now with such an experiment is to make sure we learn everything we can from it. The following are some questions that should be addressed.
- What changes occur in flow, nutrients, salinity and water temperature in the Delta and Bay?
- If there are no Delta smelt, what changes occur to the other pelagic organisms such as phytoplankton, zooplankton, shrimp, longfin smelt, striped bass, herring, anchovy, and threadfin shad?
- Will the change stimulate a plankton bloom that benefits the Bay-Delta estuary?
From the point of view of managing the experiment, it is good that other important factors such as Delta inflow remain unchanged, so that there are not too many variables to filter out as determinative in any response. It will be difficult enough to determine the relative importance of higher outflow versus lower export.
Hydrology
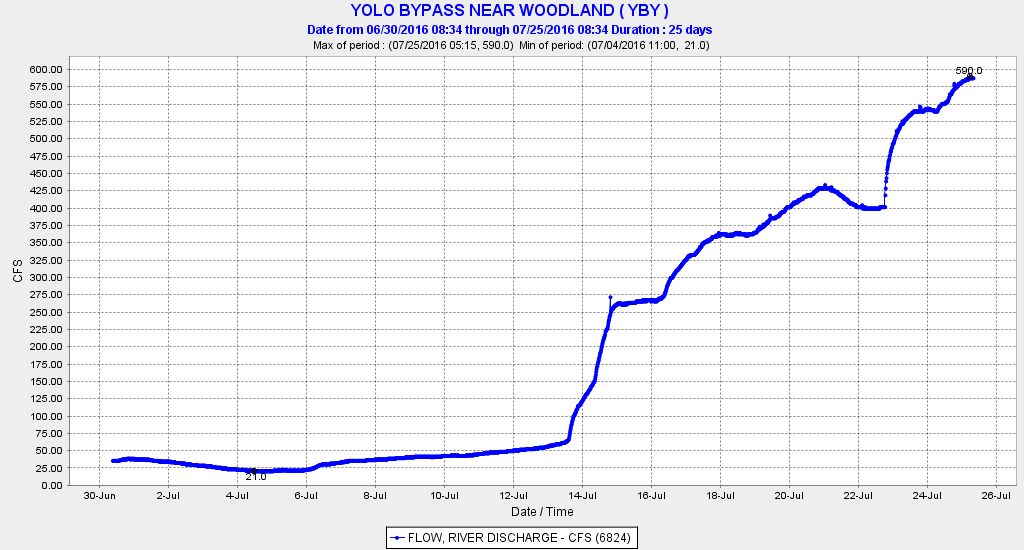
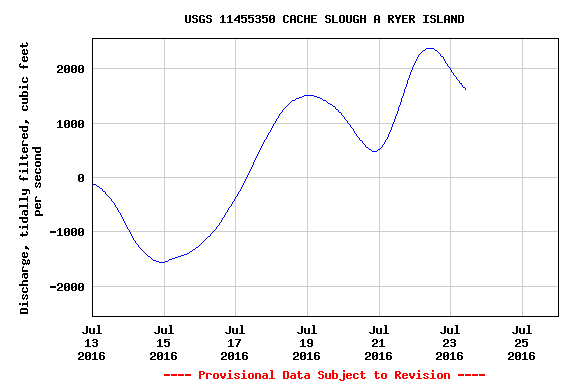
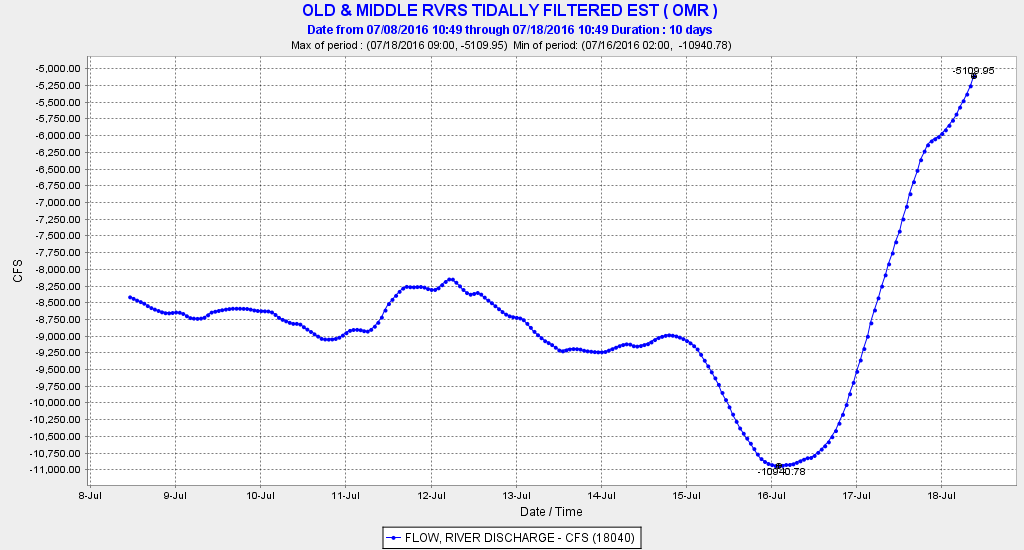
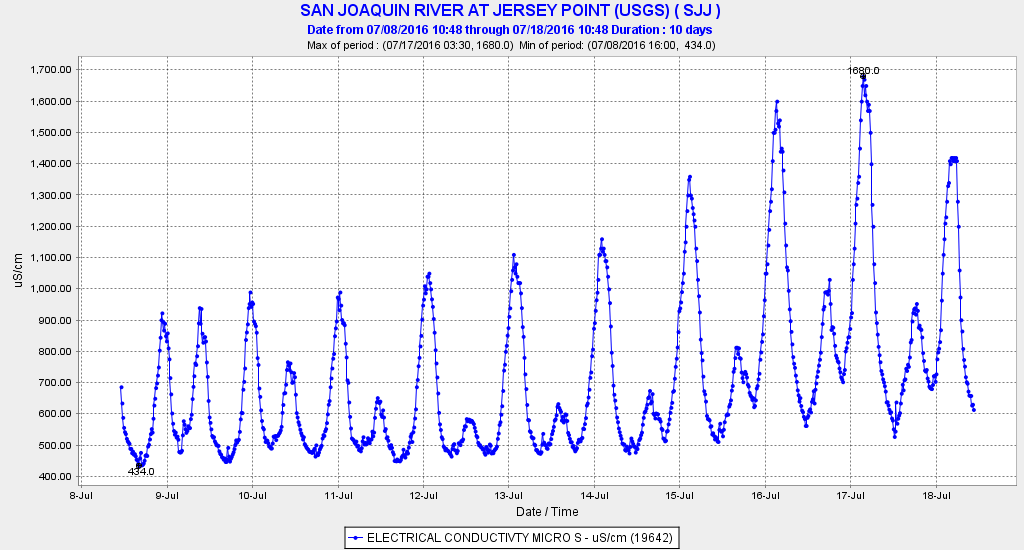
Preliminary results indicate that the experiment (as expected) had a noticeable effect on Delta hydrology. By July 24, outflow had dropped back from its peak during the experiment of 14,000 cfs to 9000 cfs (Figure 3), as exports were again increased to about 7000 cfs, as shown in Old and Middle River tidally averaged flow (Figure 4). Net lower San Joaquin River flow at Jersey Point initially increased sharply in response to the reduced exports (Figure 5). The net flows diverted from the lower Sacramento to the lower San Joaquin via Threemile Slough were also reduced (Figure 6).
Salinity
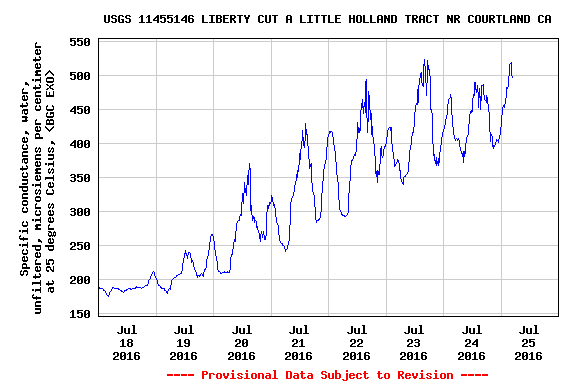
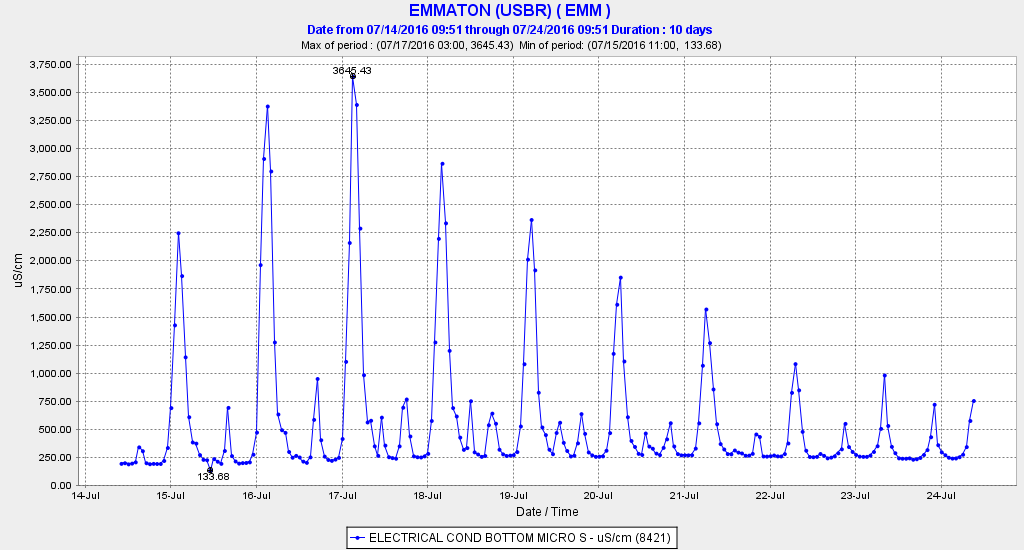
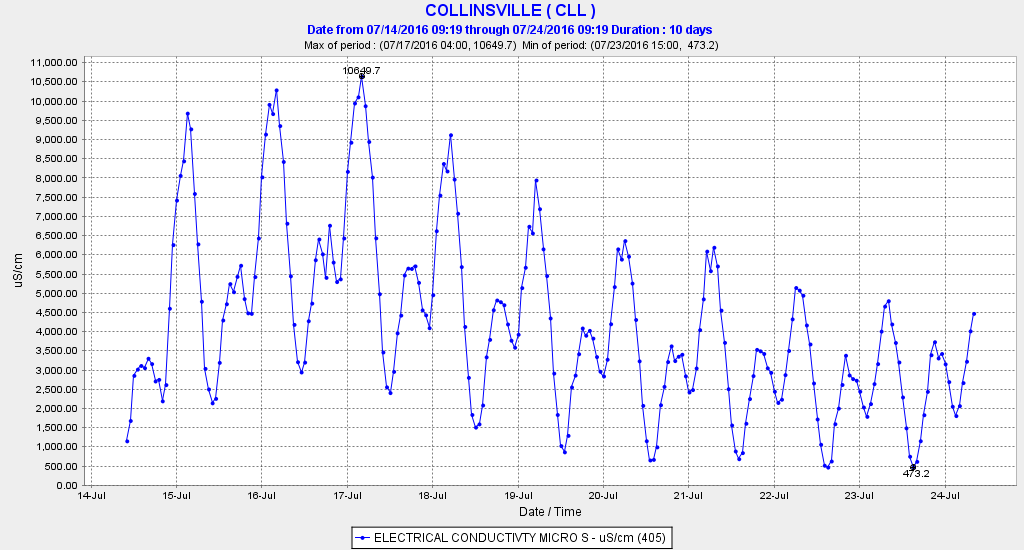
Salinity (EC) eventually responded to the higher outflows as the pulse of freshwater pushed westward. Salinity on the lower Sacramento at Emmaton (Figure 7) and Jersey Point on the lower San Joaquin (Figure 8) declined measurably. Salinity also declined downstream at the confluence of the two rivers near Collinsville in eastern Suisun Bay (Figure 9).
Water Temperature
There has been slightly lower water temperature in the western Delta. This is at least partially explained by cooler air temperatures during the experiment. The water temperature at X2 (location of 2 ppt salinity or 2700 EC declined as X2 was located on-average further west during the experiment (Figure 10). However, that too could be explained by lower air temperatures.
Plankton Blooms
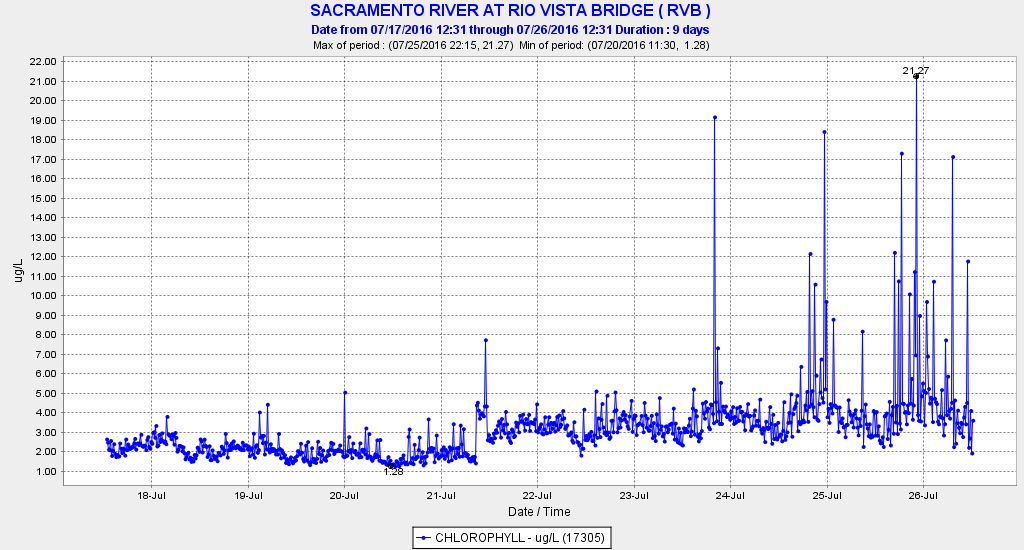
So far there is no evidence of enhanced plankton production by the experiment. There has been little change in chlorophyll measured at selected gaging stations in the central and west Delta.
Fish
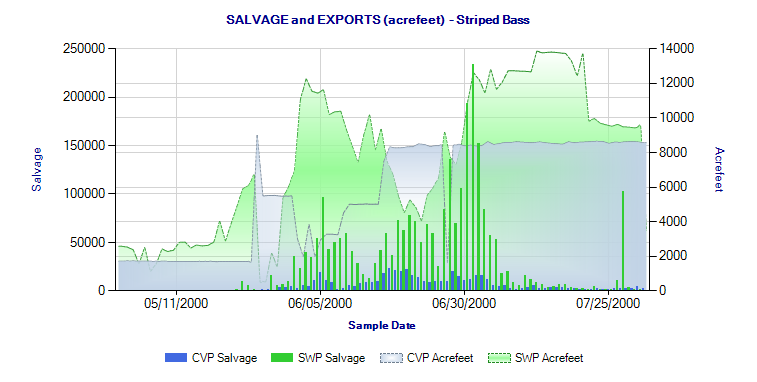
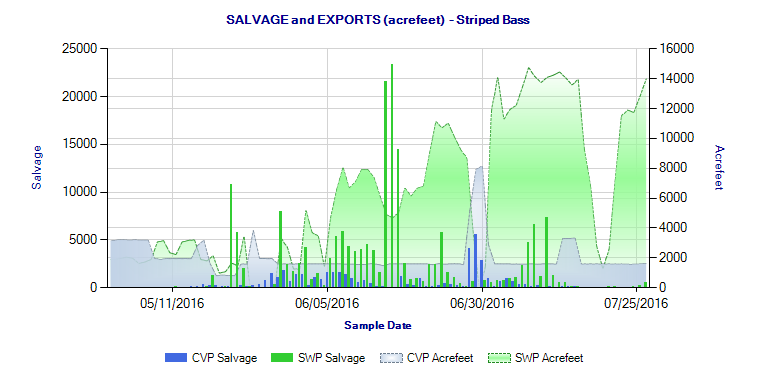
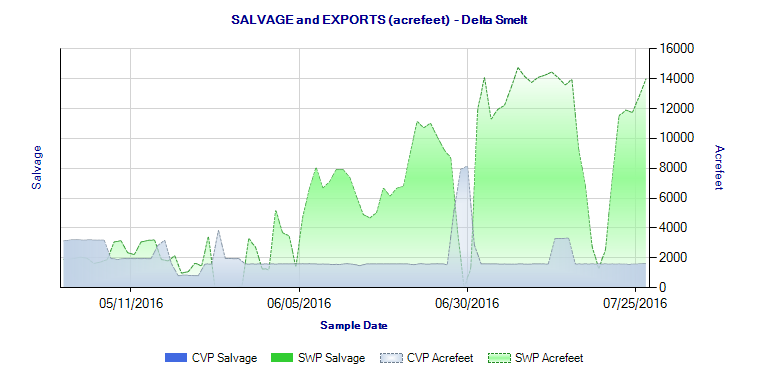
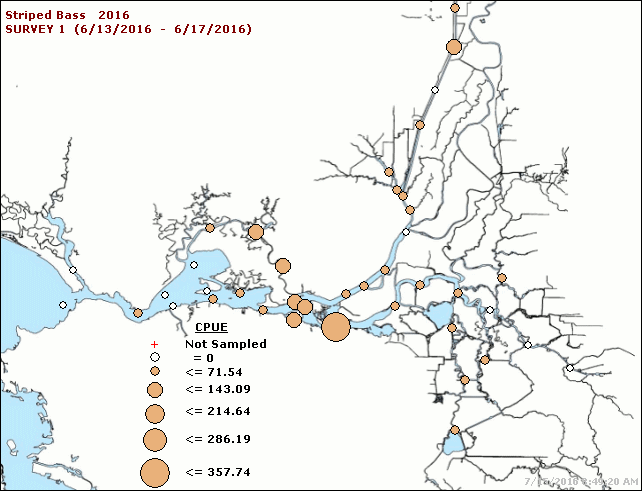
While results of Delta-wide fish surveys will not be available for some time, results of export salvage of two pelagic Delta species, striped bass and threadfin shad, showed sharp reductions as expected (Figures 11 and 12).
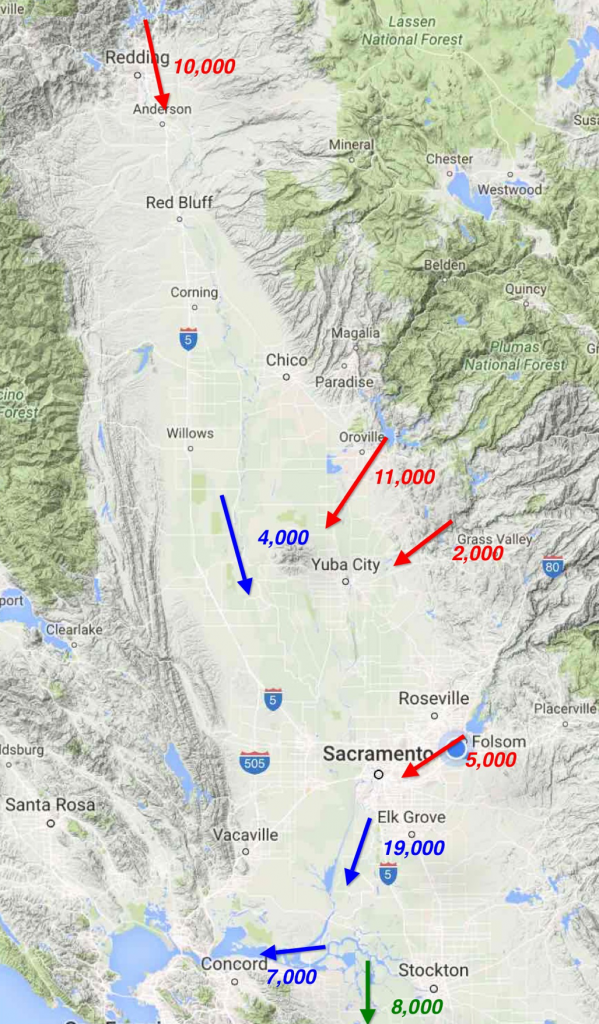
Figure 1. Water conditions in mid July 2016 in the Sacramento Valley and Delta before the experiment. Red denotes major water releases in cfs from the Valley’s four largest reservoirs. Blue denotes three key river flow locations: lower Sacramento River upstream of the Feather River, Freeport coming into the Delta, and Delta outflow. Green denotes south Delta exports.
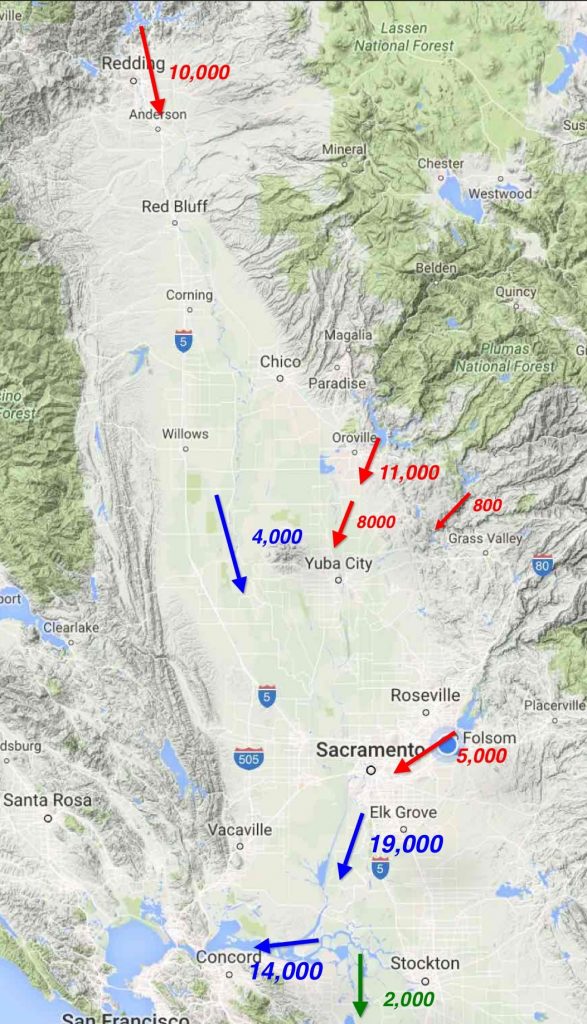
Figure 2. Flow conditions in the Sacramento Valley and Delta on 20 July 2016. Delta outflow is 14,000 cfs. Sacramento River flow above the mouth of the Feather River was 4,000 cfs. Sacramento River inflow to the Delta at Freeport is 19,000 cfs. (Note total Delta inflow was about 20,000 cfs. Total Central Valley reservoir releases and uncontrolled river inflows was over 30,000 cfs.). About two-thirds of the Delta inflow came from Feather Riverand American River reservoirs. Though only 2000 cfs was being exported from the south Delta projects, approximately 14,000 cfs of Sacramento Valley reservoir releases were being diverted for water supply from Sacramento Valley rivers and the interior Delta. Nearly all San Joaquin Valley reservoir releases were being diverted.
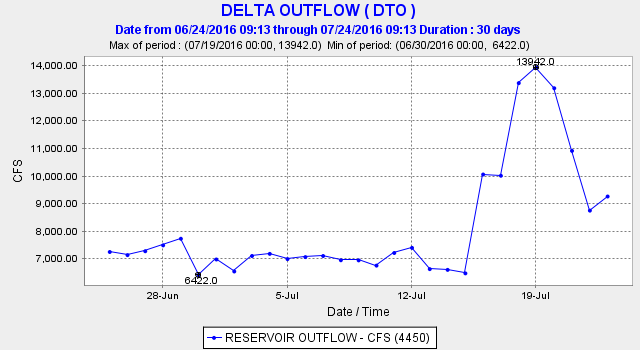
Figure 3. Delta outflow increased to 14,000 cfs during the July 15-23 experiment.
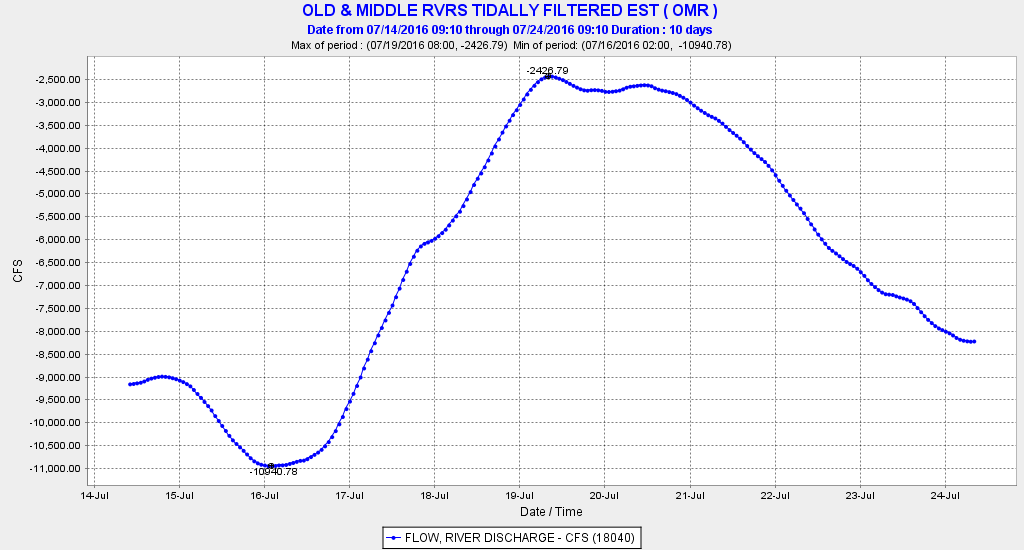
Figure 4. The tidally filter flow in the central Delta showed about a 6500 cfs reduction in the flow in Old and Middle River toward the south Delta export pumps.

Figure 5. The experiment brought a sharp response in the tidally filtered flow at Jersey Point in the lower San Joaquin River in the western Delta.
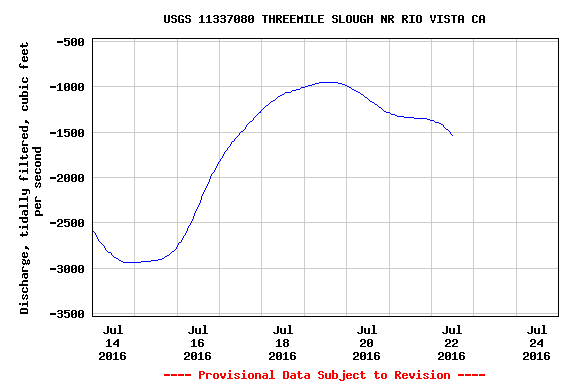
Figure 6. The experiment brought a reduction in net flows pulled from the lower Sacramento River to the lower San Joaquin via Threemile Slough.

Figure 7. Salinity (EC) at Emmaton on the lower Sacramento River just north of Antioch 14-24 July, 2016.
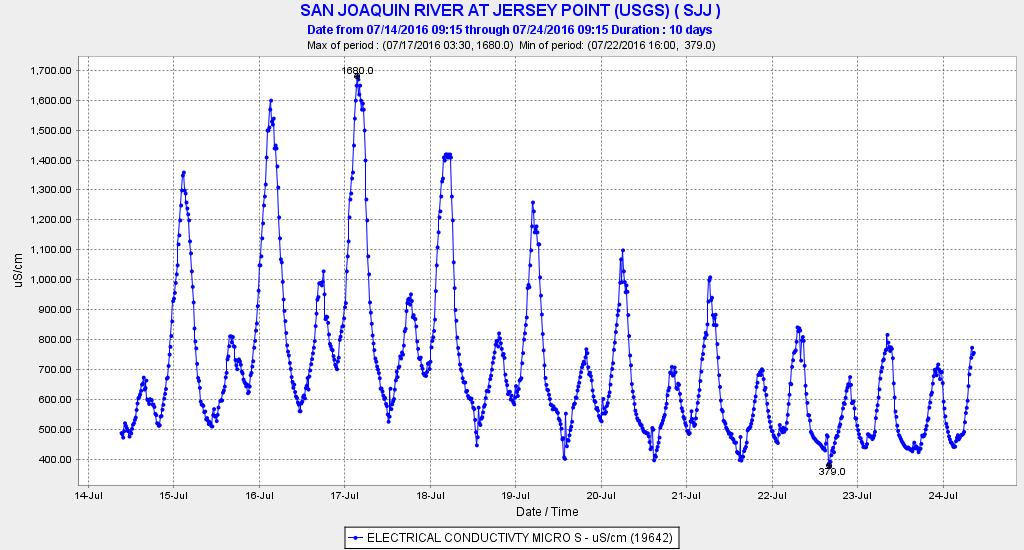
Figure 8. Salinity (EC) at Jersey Point on the lower San Joaquin River near Antioch 14-24 July, 2016.

Figure 9. Salinity (EC) at Collinsville near the confluence of the lower Sacramento and San Joaquin channels in eastern Suisun Bay 14-24 July, 2016.
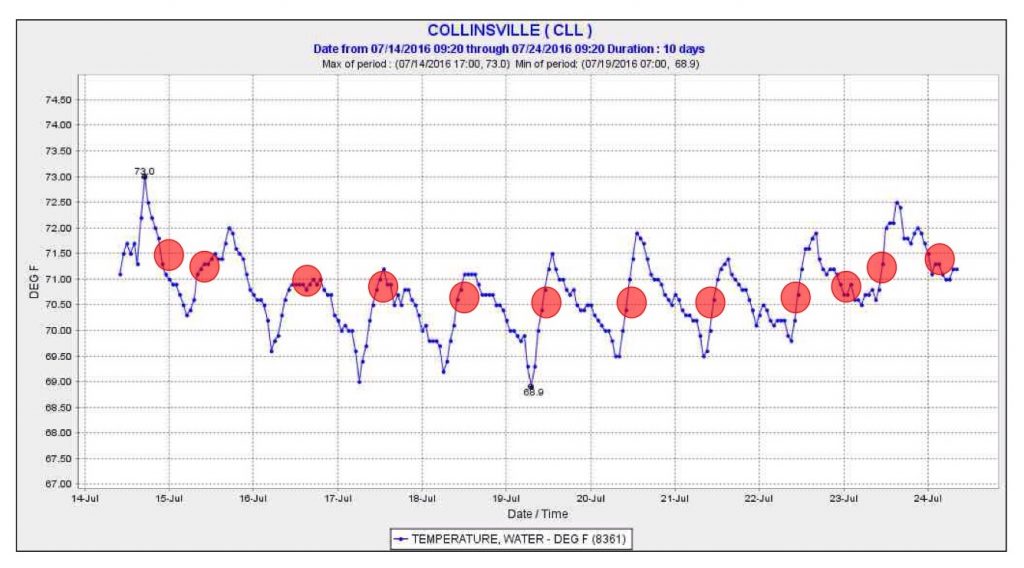
Figure 10. Water temperature (F) at Collinsville in eastern Suisun Bay 14-24 July, 2016. Red dots indicate water temperature when X2 was located at Collinsville
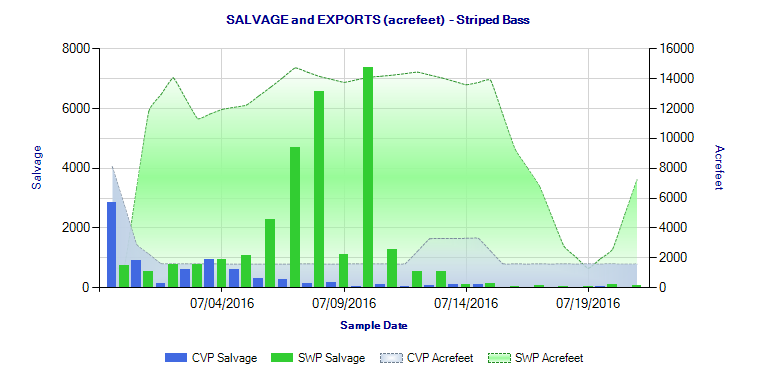
Figure 11. Salvage of striped bass at south Delta export facilities July 1-20, 2016.
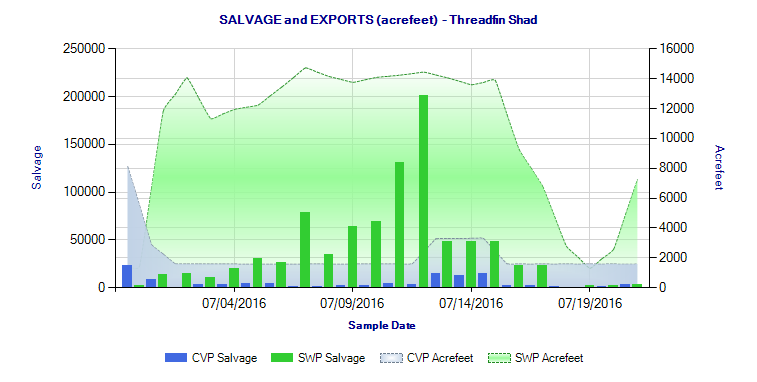
Figure 12. Salvage of threadfin shad at south Delta export facilities July 1-20, 2016.