Spring-run are the most prized of the four runs of Central Valley, West Coast, and Alaska Chinook because they leave the ocean with the biggest stores of fat energy and strength to sustain them through to spawning. They are prized for sport and table value.
Spring-run are perhaps best adapted of the four runs to California’s Central Valley because they migrated upstream with the snowmelt in spring. Dependable high cold flows allowed access to colder-summer mountain habitats. Yearling smolts emigrated to the ocean in the same snowmelt period.
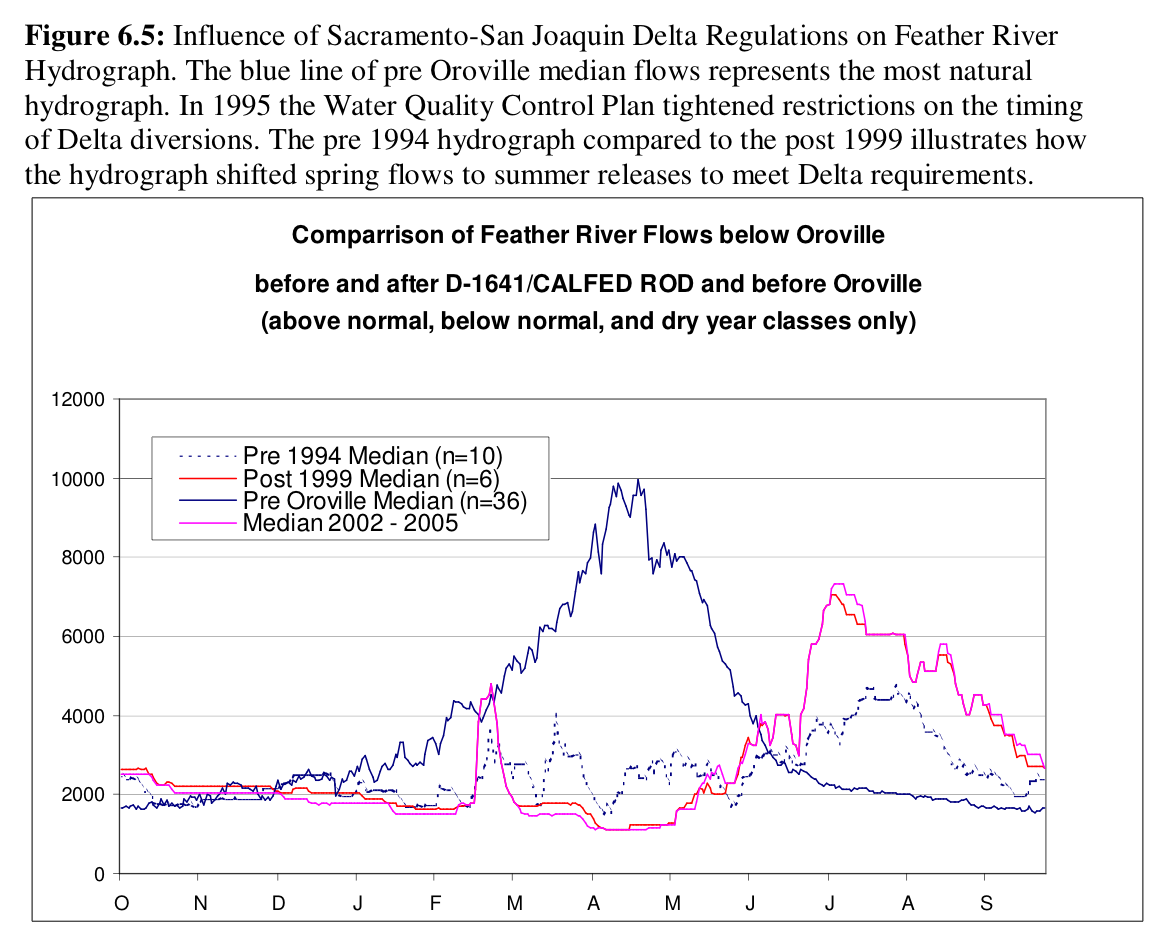
Construction of rim dams captured the snowmelt and blocked migrations, leading to dramatic declines in run size. Runs were confined to a few un-dammed streams (e.g., Mill and Deer creeks) or below dams (e.g., Shasta Dam). Reservoir storage and water diversions in many Valley streams further blocked migrations and reduced flows (Chart 1) and raised water temperatures.
Central Valley runs that once numbered in the hundreds of thousands or more are now down to a few thousand. Multimillion dollar efforts have been underway now for several decades to restore spring-run. The spring run goal for the Central Valley Project Improvement act of 1992 is 59,000 spring-run below Shasta in the Sacramento River. The average run size from 1992-2012 was 684. The primary reason for lack of recovery is low flow and high water temperatures in spring in the lower Sacramento River and spawning tributaries. No river or creek has been unaffected, and so the spring-run have rapidly declined. (See references for early reports on spring-run and their decline.)
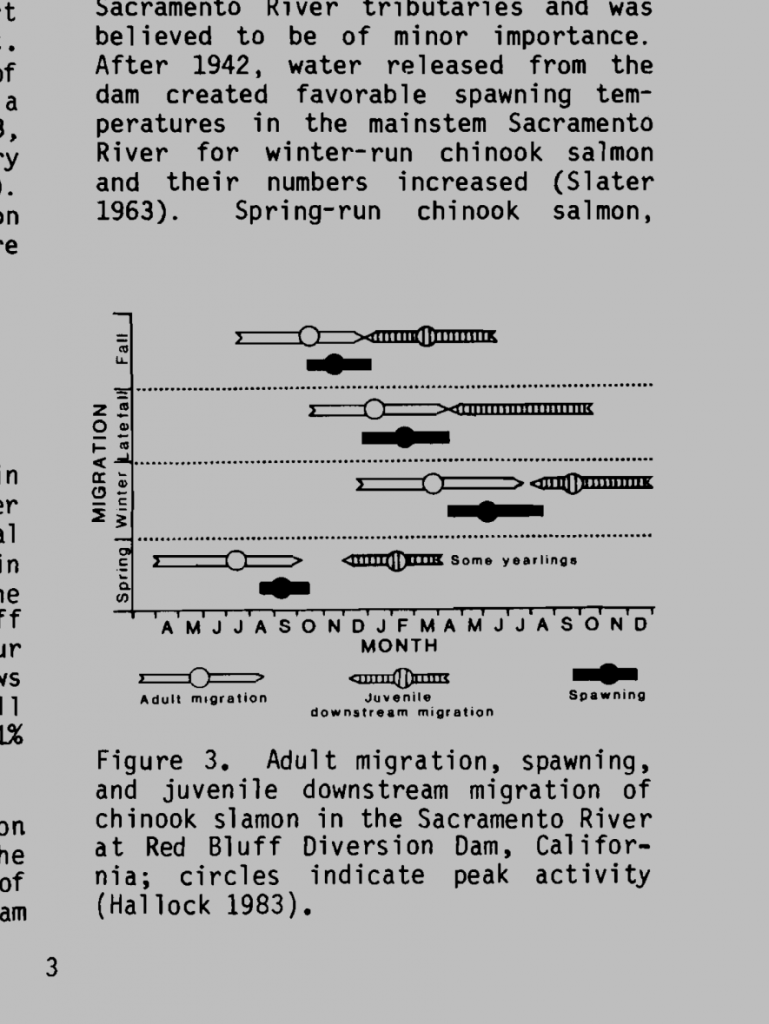
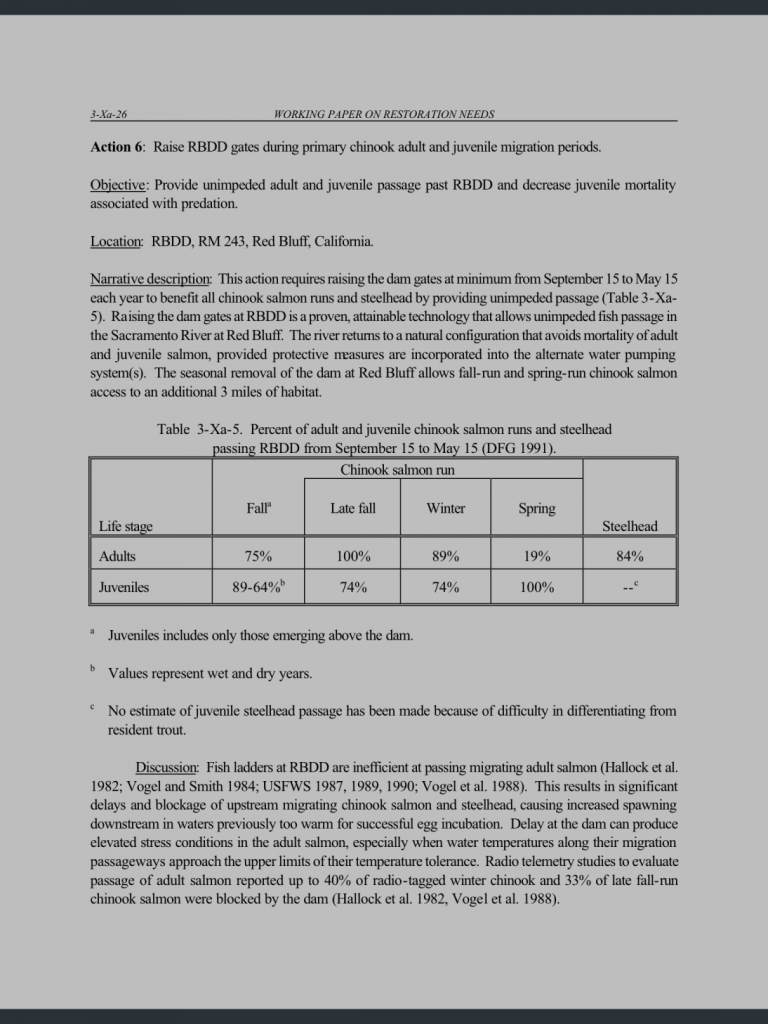
Peak migration of adult spring-run Chinook into the upper Sacramento occurs in May and June. About 80% of the spring-run passes Red Bluff after May 15. The adults oversummer in the upper Sacramento River and its tributaries before spawning in September and October. During migration and oversummering they require cold-water habitat for survival and the maturation of their gonads. Lack of cold water habitat reduces the viability of their eggs and sperm and subjects adults to poor survival from disease, energy loss, and heat stress.

Chart 1. Example of spring snowmelt being captured by dams – Feather River. (Source: NHI 2008)
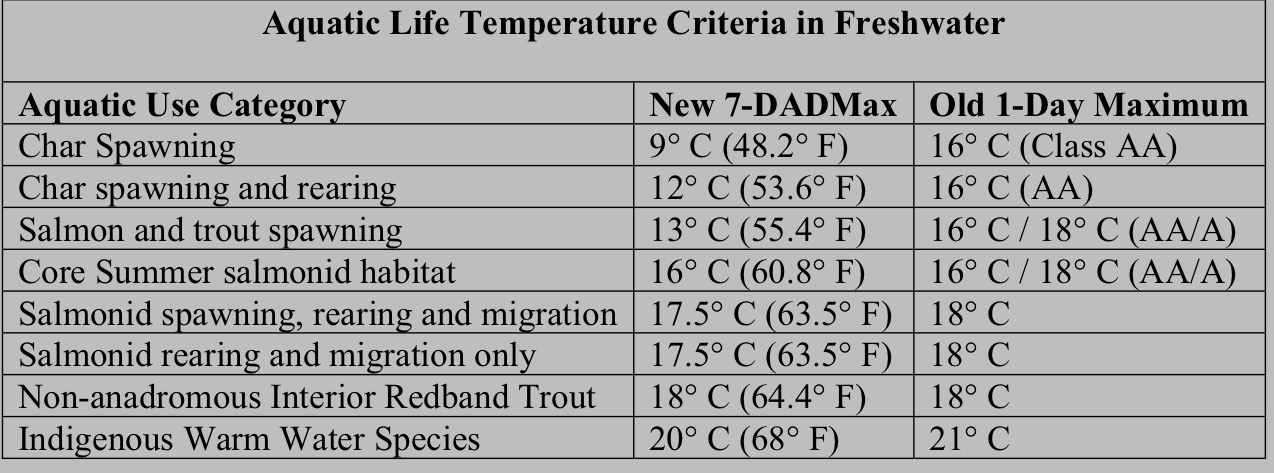
Of the four runs, spring-run are also the hardest to recover. The main reason is because they migrate from the ocean to their spawning rivers in spring, they are increasingly at risk to warm spring water temperatures in the lower Sacramento River. Water temperatures of 70°F or higher are detrimental to migrating salmon, and spring-run are especially at risk because much of the Valley’s cold snowmelt is captured and held in rim dam reservoirs. Those spring-run headed for un-dammed tributaries must still pass through the lower Sacramento River. NMFS’s criteria that define water temperature habitat degradation are shown in Chart 2 below. Water temperatures above 65°F are unsafe for salmon migration. In the Basin Plan the water temperature standard set by the State for the lower Sacramento River is 68°F to protect migrating salmon and other cool-water dependent fish (e.g., sturgeon and steelhead). Water temperatures of 72-74°F can block or severely delay migration. An excellent review of water temperature requirements of salmon by CDWR and Stillwater Sciences describes water temperatures above 65°F as being detrimental to migrating spring run salmon.

Chart 2. Aquatic life temperature criteria for freshwater. 7DADMax is the seven running average of the daily maximum water temperature. 1-Day Maximum is the daily average water temperature. (Source: NMFS).
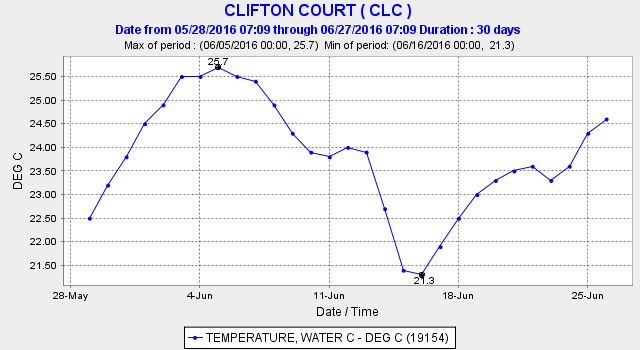
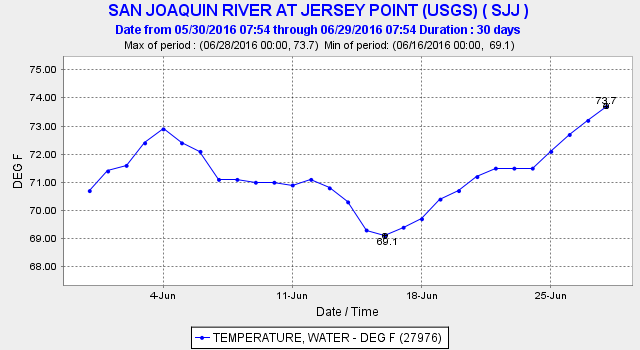
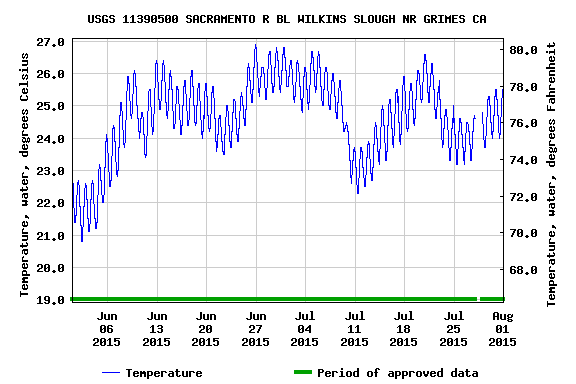
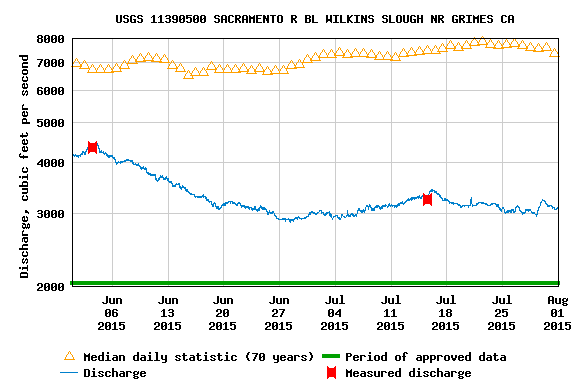
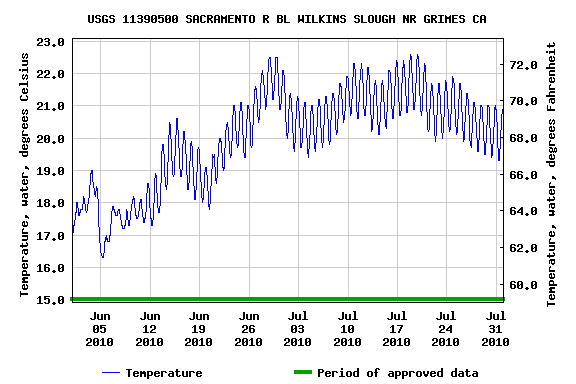
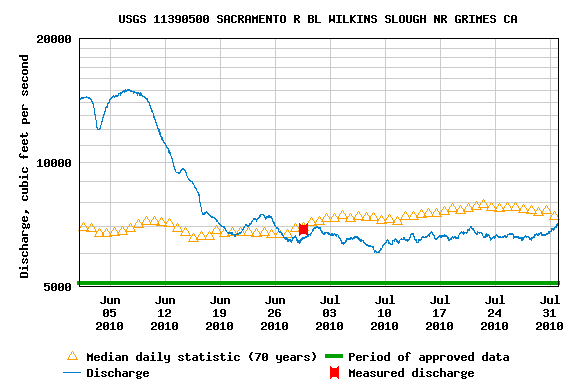
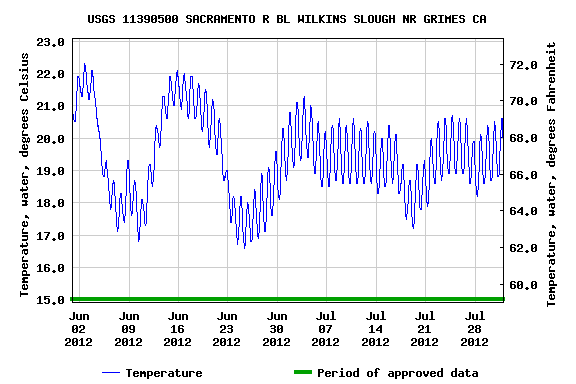
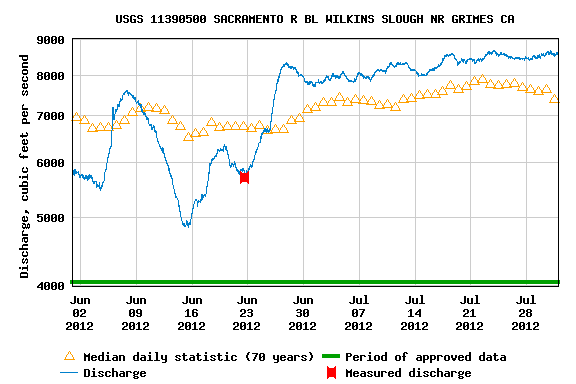
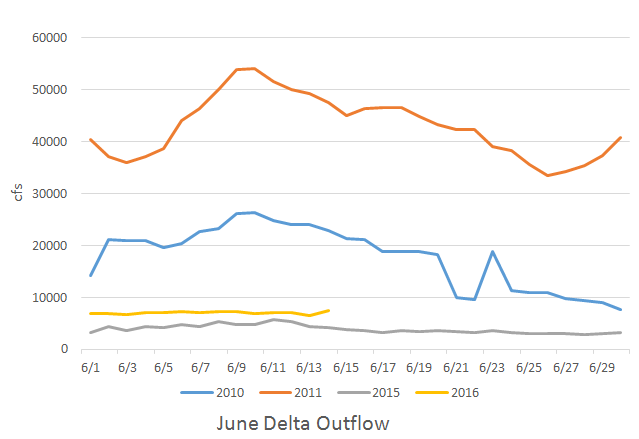
Water temperatures typically exceed 68°F in spring in the lower Sacramento River (Charts 3 and 4). In drier years high water temperatures may even block migration (72-74°) or kill adult salmon (>75°F). The high spring water temperatures are due in large part to low flows above (3000-5000 cfs) and below (5000-7000 cfs) the mouth of the Feather River at Verona (RM 80). A closer look at 2016 at Wilkins Slough (Charts 5 and 6) and Verona (Charts 6 and 7) show the relationship between flow and water temperature. While air temperatures and tributary water temperatures (particularly the Feather River at Verona) likely also played a part in patterns observed, the overall pattern from 2008 to 2016 indicates higher water temperature are a consequence of low river flows. Flows of 10,000 cfs and higher in May-June of 2010 and 2011 led to to water temperatures below 65°F. Intermediate flows (8000-10,000 cfs) in May-June 2012 and 2013 led to water temperatures from 68-70°F.
The issue of low river flows and high water temperatures in spring has received little consideration in drought management plans, salmon biological opinions, and the NMFS Central Valley Recovery Plan. The only consistent attention has been centered around reducing Shasta releases and lowering flows at Wilkins Slough to save Shasta storage and cold-water pool in dry years. Even this spring, with a full Shasta Reservoir, the overwhelming concern for saving the Shasta cold-water pool has led to minimum releases and Wilkins Slough flows near 3000 cfs. Mention is rarely made of meeting the Basin Plan 68°F criterion for the lower Sacramento River. If anything was mentioned, it was for allowing a reduction in spring flows below Keswick and at Wilkins Slough to 3000-4000 cfs to save Shasta storage and cold-water pool. Most of the required water for Delta inflow has come from the Feather and American Rivers.
Another problem rarely mentioned is warm water discharges, especially agricultural drainage into the lower Sacramento River in spring. Water temperatures from these considerable sources can easily exceed 80°F. The Knights Landing Outfall of the Colusa Basin Drain is one such source. I once measured 80°F on May 1 at the mouth of the Feather River during the peak season of the Feather’s substantial spring-run.
The operations that imperil spring-run create a serious issue that deserves much more attention. Increasing Wilkins Slough flows by several thousand cfs would go a long way to reducing this year’s problem. This would require up to 200,000 acre-ft of Shasta storage, or about 5% of the 4.2 maf of present storage. The added flow would help maintain winter-run spawning near Redding in June and improve Delta inflow/outflow and perhaps exports. At present, 7,000 cfs is being released at Keswick, with only 3000 cfs reaching Wilkins Slough. The difference is being diverted from the upper river by CVP water contractors.
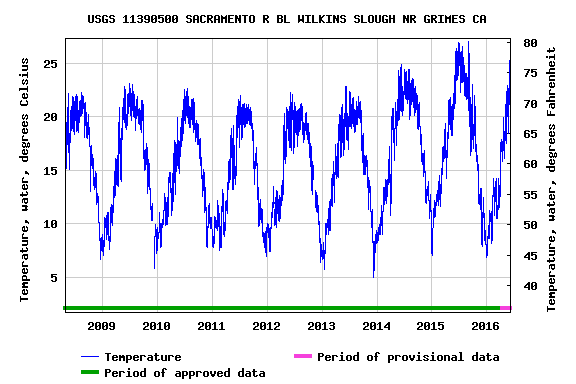
Chart 3. Water temperature of the Sacramento River at Wilkins Slough (RM 125) from May 2008 to early June 2016. Higher water temperature in May-June 2014 and 2015 drought years and 2016 occurred at May flows of 3000-5000 cfs.
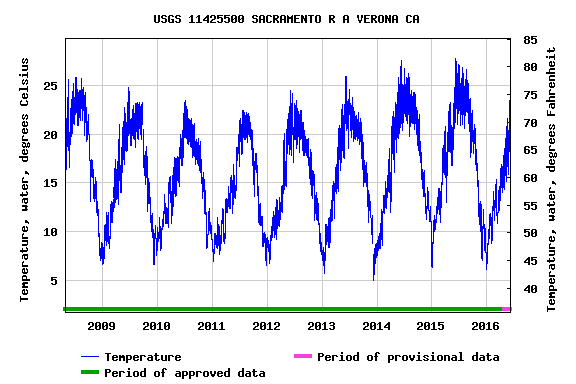
Chart 4. Water temperature of the Sacramento River at Verona (RM 80) from May 2008 to early June 2016. Higher water temperature in May-June 2014 and 2015 drought years occurred at flows of 5000-7000 cfs.
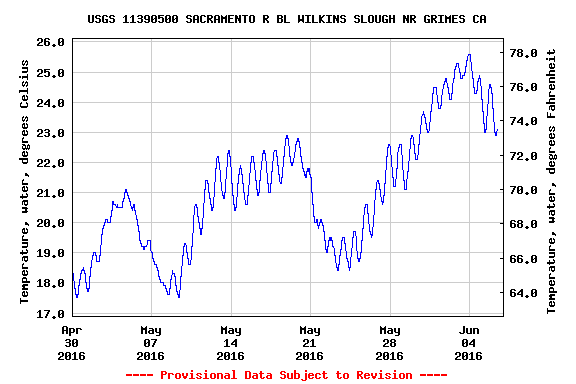
Chart 5. Water temperature of the Sacramento River at Wilkins Slough (RM 125) from May to early June 2016.
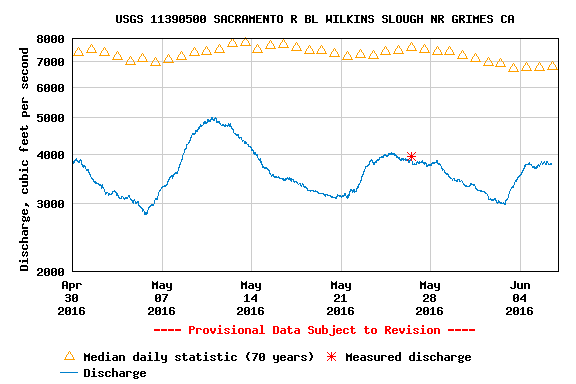
Chart 6. Flow in the Sacramento River at Wilkins Slough (RM 125) from May to early June 2016.
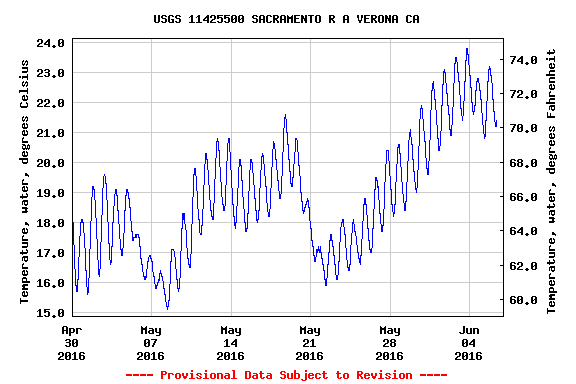
Chart 7. Water temperature of the Sacramento River at Verona (RM 80) from May to early June 2016.
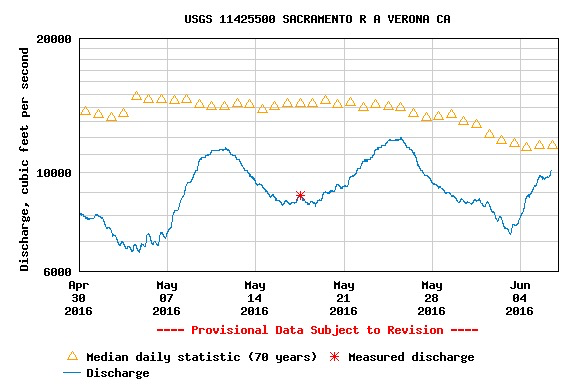
Chart 8. Flow in the Sacramento River at Verona (RM 80) from May to early June 2016.
References
Hallock, R.J. 1983. Sacramento River king salmon life history patterns a t Red Bluff, California. Unpubl. Central Valley Project report, California Department of Fish and Game, Red Bluff.
Hallock, R.J.., and D.H. Fry. 1967. Five species of salmon, Oncorhynchus, in the Sacramento River, California. Calif. Fish Game 53:5-22.
Hallock, R.J., and W. F. Van Woert. 1959. A survey of anadromous fish losses in irrigation diversions from the Sacramento and San Joaquin Rivers, Calif. Fish Game 45:227-296.
Hallock, R.J., R.F. Elwell, and D.H. Fry. 1970. Migrations of adult king salmon, Oncorhynchus tshawytscha, demonstrated by the use of sonic tags. Calif. Fish Game Fish Bull. 151. 92 pp.
Anadromous Fish Restoration Program of CVPIA – http://www.fws.gov/stockton/afrp/