In my March 12 post, I related that Senator Feinstein’s request for higher Delta exports would put the Delta Smelt population in the Delta at further risk of extinction. Well, she received her wish, and exports increased from 6000 cfs to 8000 cfs (11,400 cfs is maximum pumping capacity) in the week after her request when storms brought more inflow to Delta from the San Joaquin River.
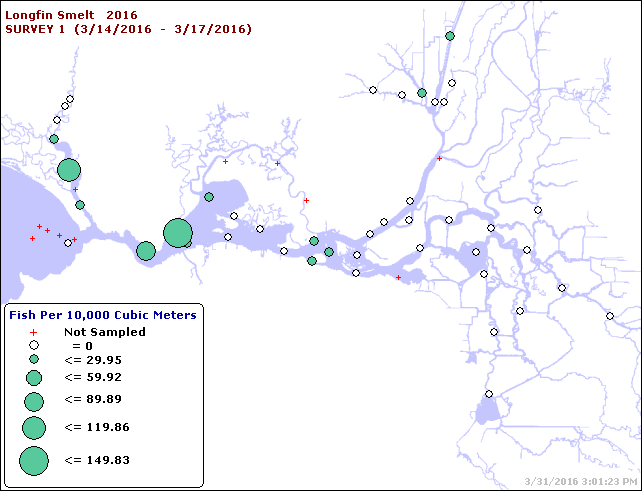
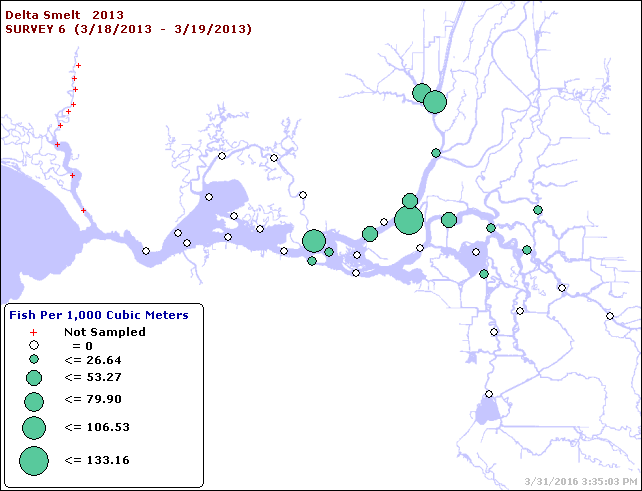
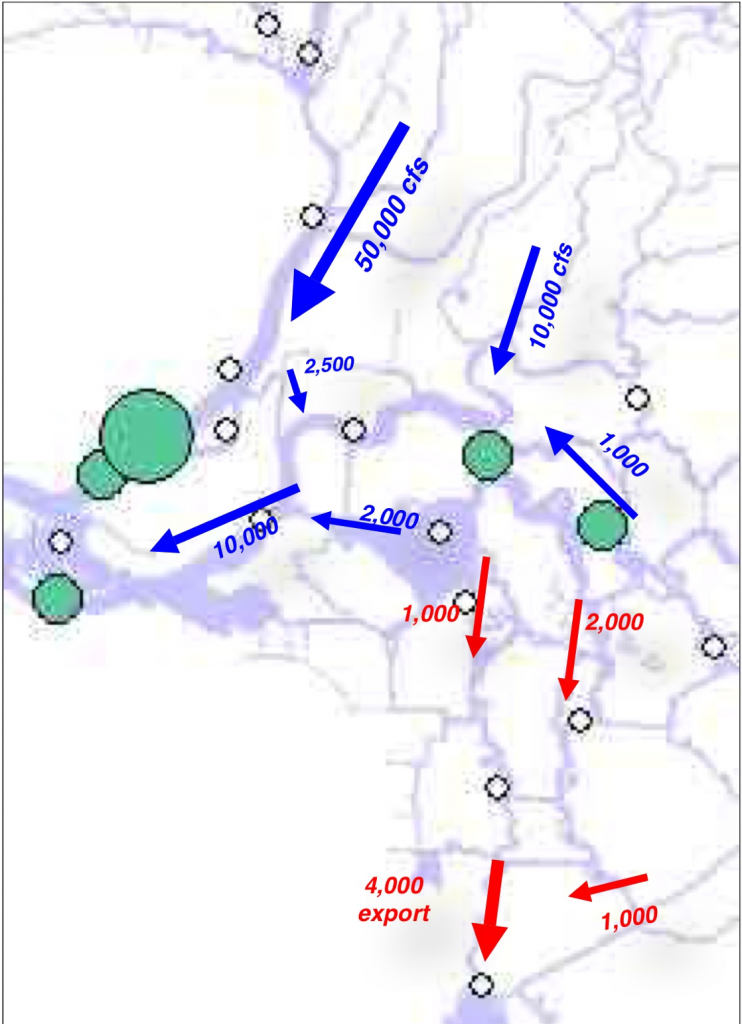
However, the higher exports were short–lived, because the 3/14-3/17 Smelt Larvae Survey picked up larval smelt for the first time this year (Figure 1 – green dots). Exports dropped below 5000 cfs again. Though only two newly hatched larvae were collected in the central Delta, their presence is a concern. The presence of larval smelt shows that smelt are spawning in the lower San Joaquin River in the central Delta. According to the Smelt Working Group the net negative flows shown in red in Figure 1 for late March indicate a “medium” risk to smelt and a likelihood that larval smelt will be drawn toward the south Delta export pumps. The -5000 cfs Old and Middle River (OMR) reverse flows are the maximum allowed under the Smelt Biological Opinion.
In its review of the results of particle tracking model runs, the Smelt Working Group concluded: “Members stressed the importance of weighing more heavily the results from inserting (particles) at Prisoner’s Point, given the consistent catch of adults there this year and the hydrologic proximity of that location to the south Delta (as compared to Jersey Point). For OMR flow of -5000 cfs, approximately 20% of the particles inserted at Prisoners Point were entrained into the South Delta. For an OMR flow of -2500 cfs, approximately 10% of particles inserted at Prisoners Point were entrained into the South Delta. For an OMR flow of – 1250 cfs, less than 10% of particles inserted at Prisoners Point were entrained into the South Delta.” Prisoners Point is the green dot from the right on the Figure 1 map. In all likelihood, larval smelt are now being drawn or will soon be drawn into the south Delta. It is too early to determine what portion of the population is subject to this risk. But given the unprecedented depressed condition of the smelt population after four years of drought, the risk is significant.
On March 24, after review of “Smelt Working Group’s March 21 recommendations, the U.S. Fish and Wildlife Service “determined” that the OMR should be no more negative than -2500 cfs on a 14-day average, and no more negative than -3150 cfs on a five-day average. Reclamation took a slightly more liberal interpretation in the subsequent week’s operations (Figure 2), staying nearer -3500 cfs most of the week with no apparent interest in reaching a -2500 cfs 14-day average. It could be that the Service meant to recommend a -3500 cfs OMR limit. Or maybe the Service got a call from Senator Feinstein’s office. We shall see what this week’s meetings and determinations offer.
In any event, the risk to Delta Smelt remains “medium” at combined exports of about 3500-4000 cfs. With an export capacity of 11,400 cfs, Delta outflow still exceeding 50,000 cfs, reservoirs continuing to release snowmelt, and San Luis Reservoir in the San Joaquin Valley only half full, there will be continued cry for more exports and for approval of the Tunnels. In the meantime, it appears from Figure 1 that some smelt larvae and a good amount of snowmelt are escaping west to Suisun Bay, while some larval smelt remain at risk in the central Delta.
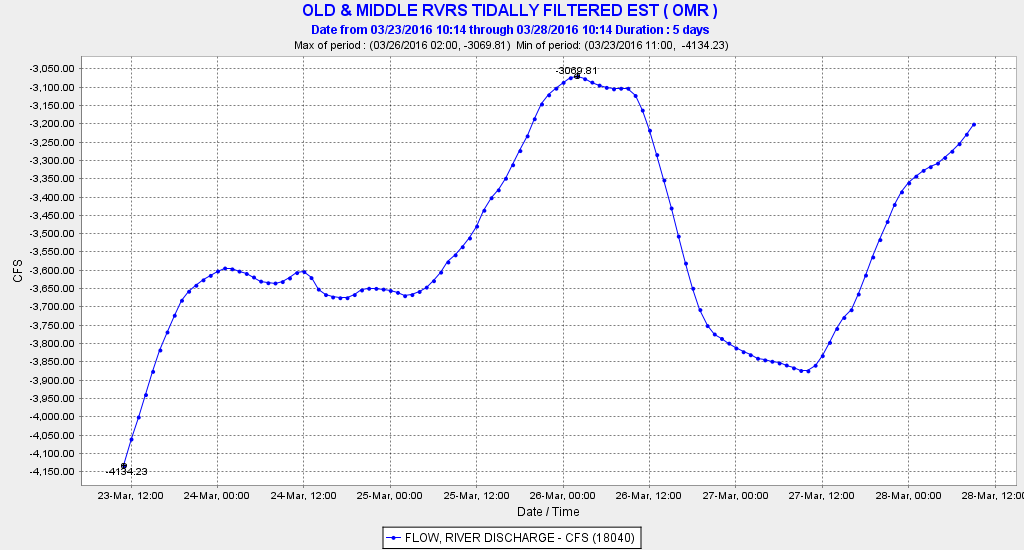
Figure 2. OMR March 23 to March 28. (Source: CDEC)

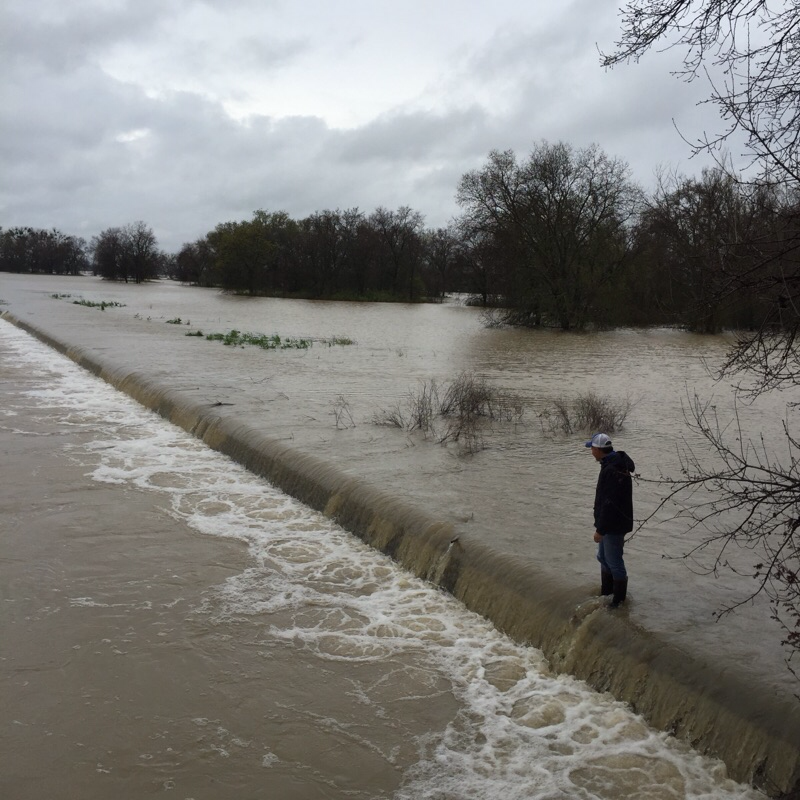
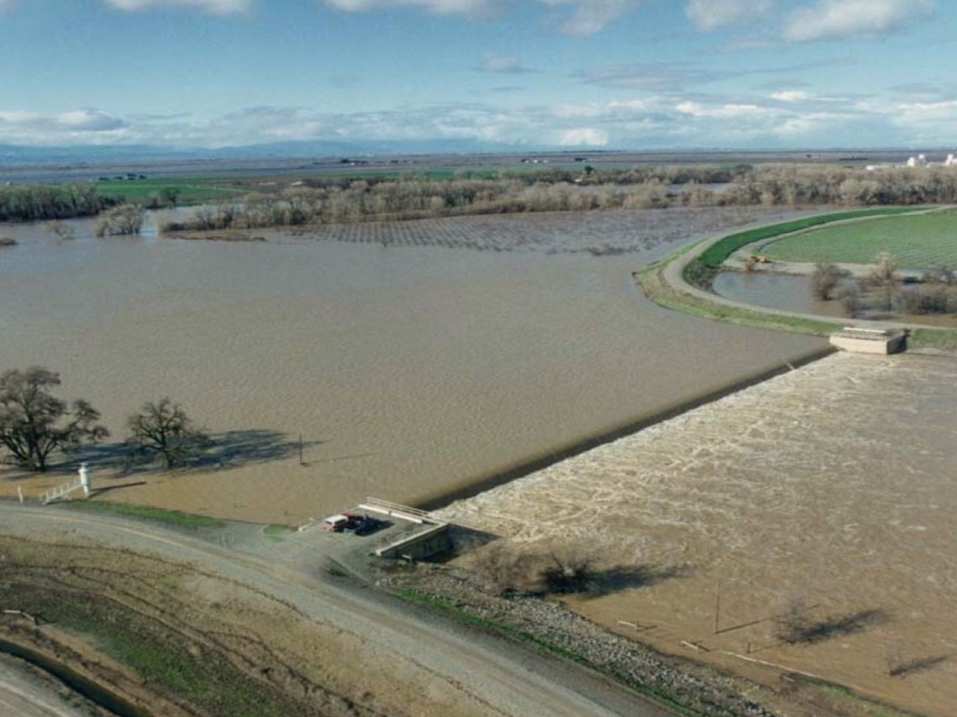
 It is one of those wet springs when the Sacramento River has spilled over the Fremont Weir at the upstream (north) entrance to the Yolo Bypass near Verona. In a January
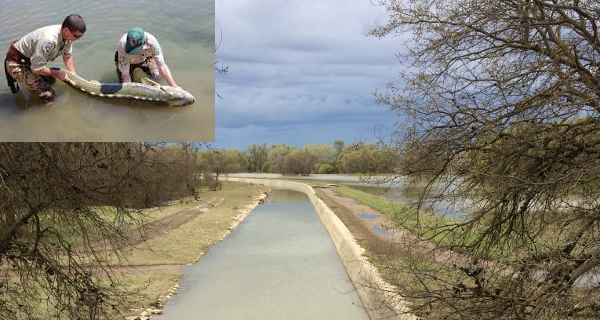
 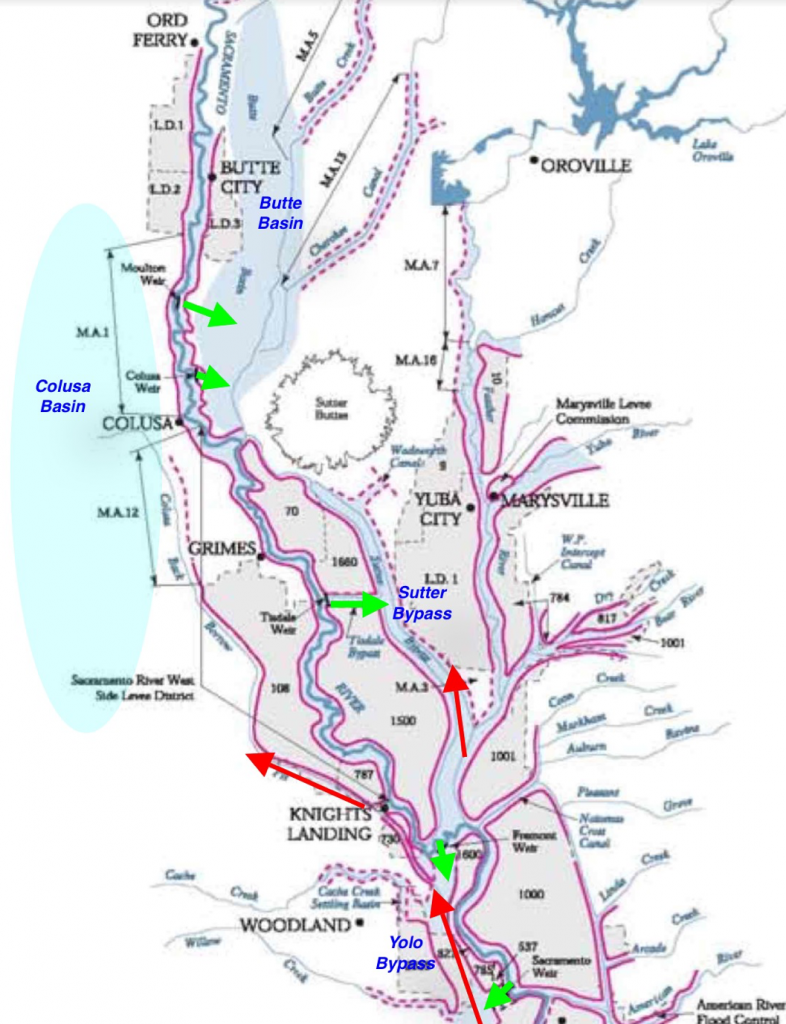 Others will make their way to the west side of the upper Bypass to outlet of the Knights Landing Ridge Cut (KLRC), and migrate up into the Colusa Basin via the Colusa Basin Drain where they will be lost. In spring 2013, many Winter Run salmon were found stranded in the Colusa Basin under similar circumstances. The peak migration of Winter Run and sturgeon is in March and April. So I expect many salmon have or will be headed up the Ridge Cut, which is flowing 500-600 cfs.