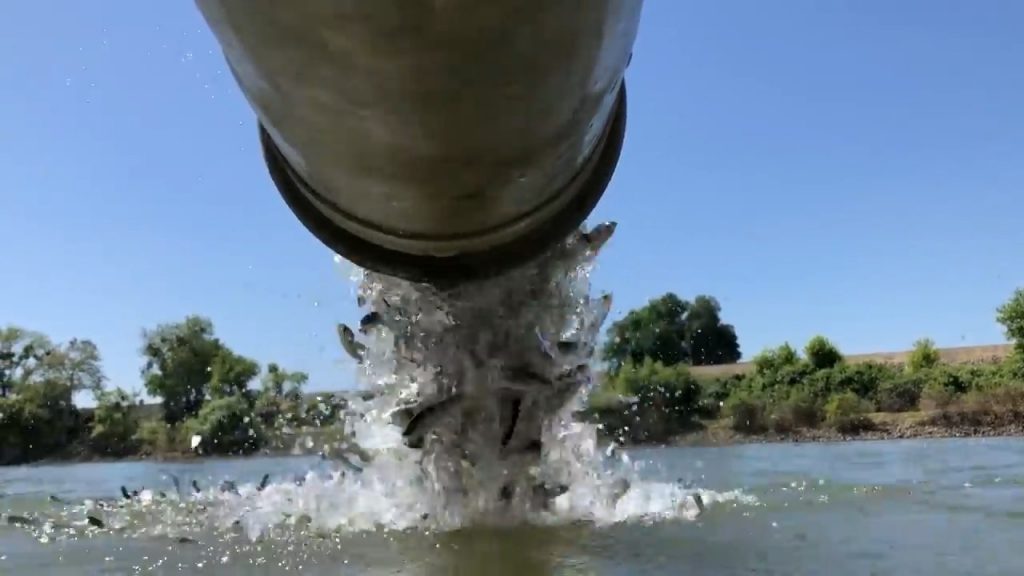
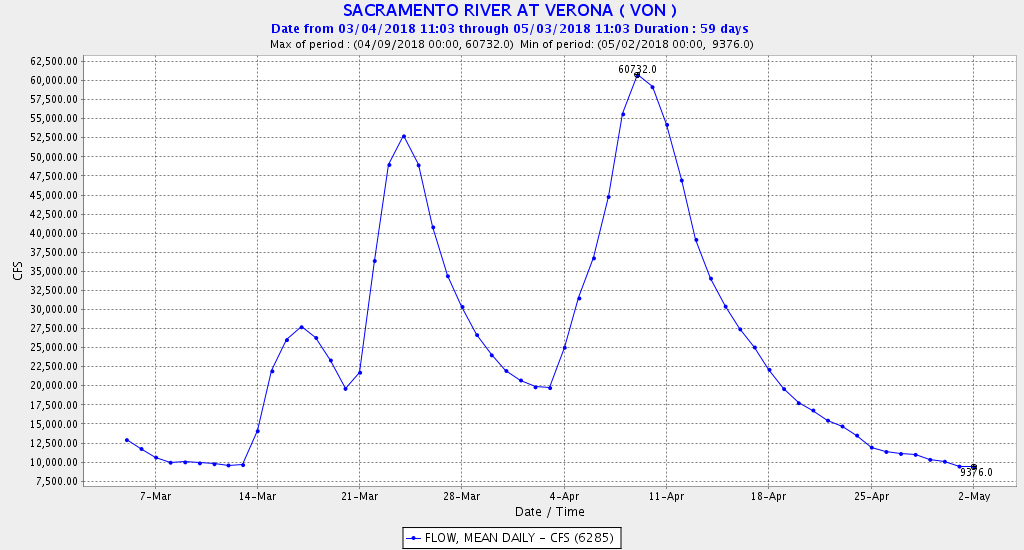
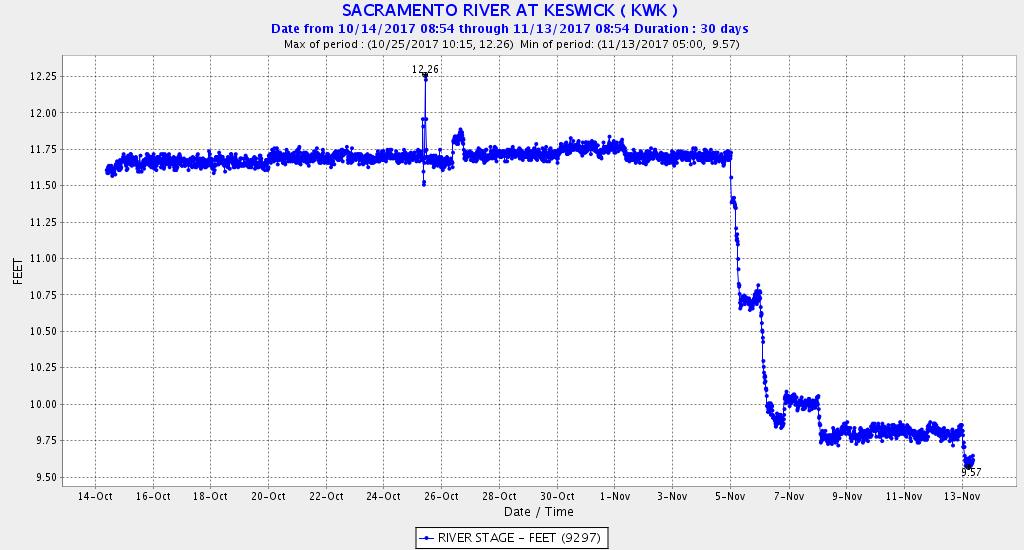
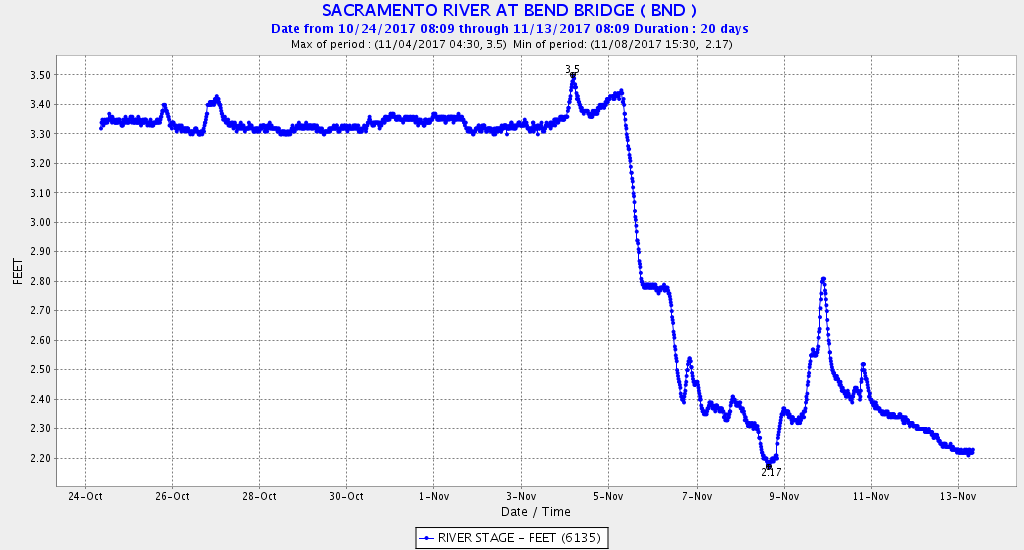
In a recent post, I discussed ways to increase returns/survival of the Coleman (Battle Creek) Hatchery produced smolts released to the Sacramento River and the Bay. In this post I focus on ways to improve returns/survival of young salmon produced at the Oroville (Feather River) Hatchery. Trucking smolts to the Bay in drier water years and releasing spring flow pulses in wetter years remain the key management actions for increasing the contribution of hatchery salmon to coastal and river fisheries. Timing of releases is also critical. While overall returns are highly influenced by ocean conditions, active management by hatchery managers (trucking, barging, and timing of releases) and water managers (flow pulses) are important tools in maximizing the contribution of hatchery smolts to salmon populations.
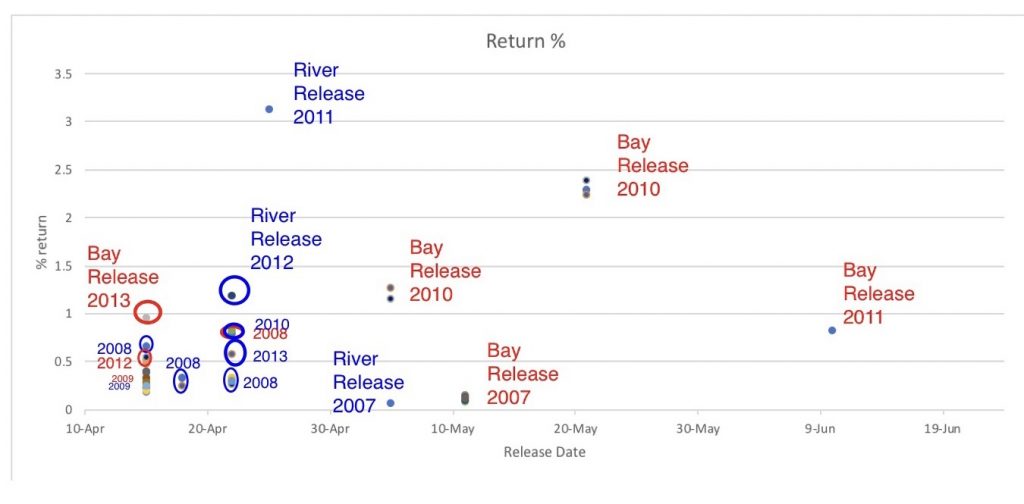
In a prior post, I discussed general means of increasing hatchery contributions. In that post, I presented a summary of Oroville (Feather River) Hatchery returns for brood years 2008-2012 (Figure 1). Return rates were highest for brood years 2009-2011, with winter-spring normal-wet year designations (water years 2010-2012). Brood year 2008 and 2012 smolts were released in winter-spring of drought years.
In this post I provide information from earlier brood years. This information supports a more specific strategy to increase the Feather River hatchery program’s contribution to California fisheries. Below, I add a summary of returns from selected brood years (2002-2007).
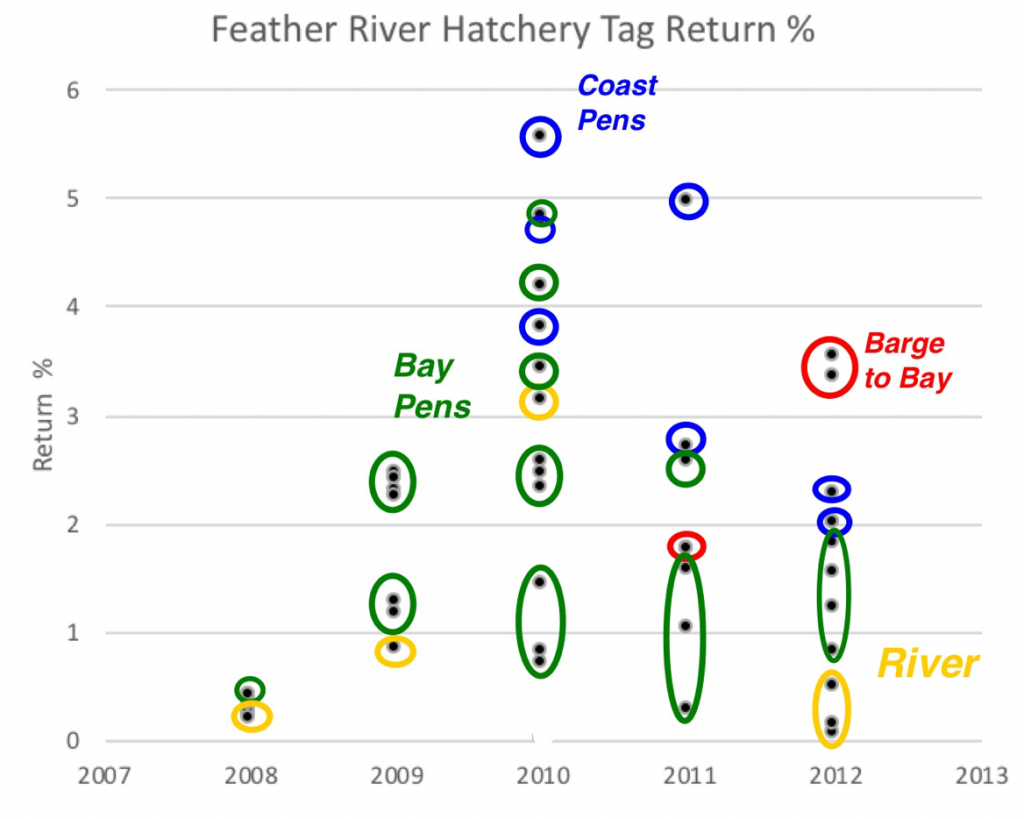
Figure 1. Feather River hatchery fall-run salmon return rates by release method for brood years 2008-2012 (release years 2009-2013). Source of data: http://www.rmpc.org/
Brood Year 2002
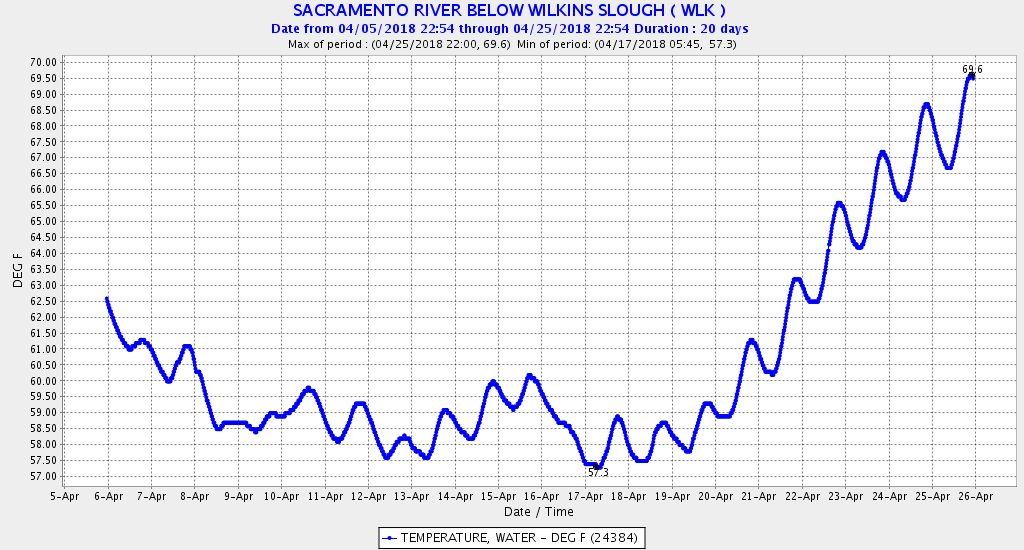
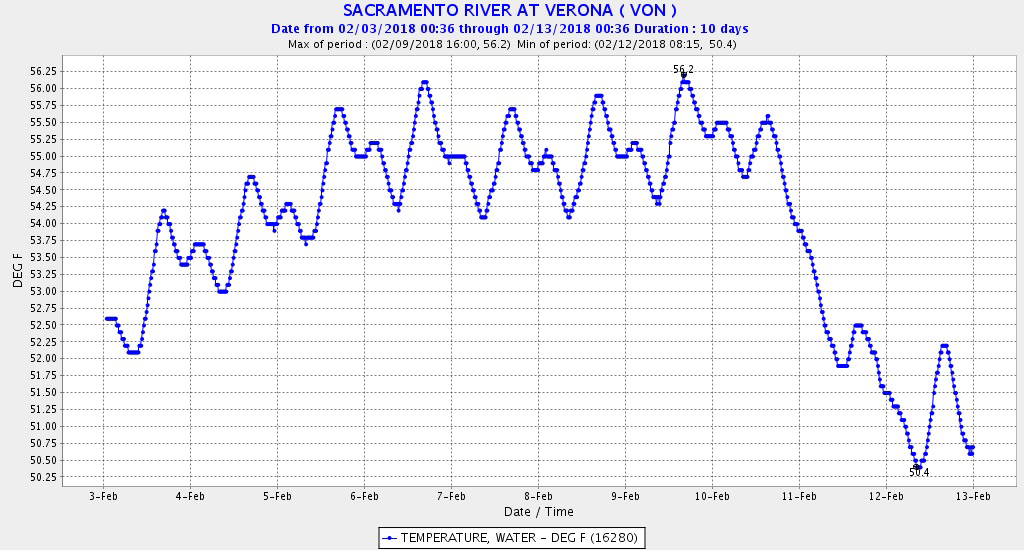
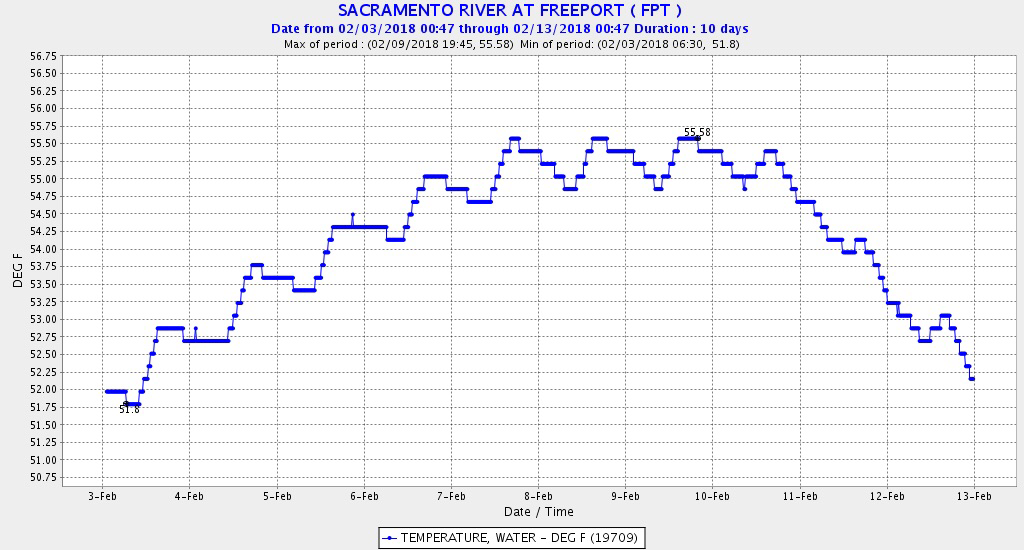
Hatchery smolt returns for brood year 2002 were good, with hatchery releases in the above-normal water year 2003. The good adult return performance is generally attributed to good river and ocean conditions in 2003. A closer look at release return rates (Figure 2) shows generally good returns (>1%) reflecting the good river and Delta conditions in 2003 and good ocean conditions, at least in 2003. Some return rates were very good (>2%), including late April to mid-May returns for Delta and Bay (non-pen) releases. The higher return rates occurred coincident with a late-April through mid-May flow pulse (Figure 3). During the flow pulse, releases to the Delta had return rates in the same high range as Bay releases. Most of the river releases had low rates of return (<1.0%) before the flow pulse; while during the pulse, most rates were 1.0-1.7%.
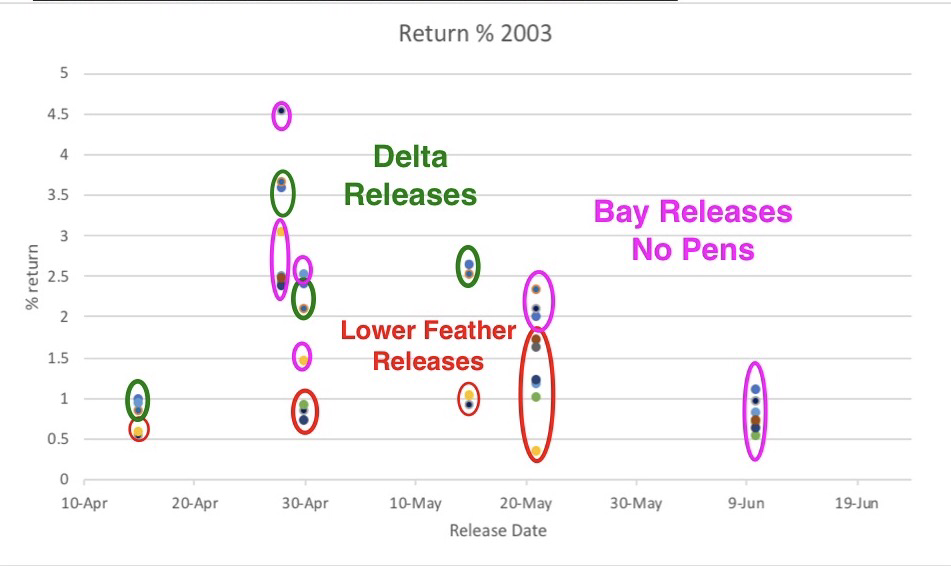
Figure 2. Feather River hatchery fall-run salmon return rates by release method for brood year 2002 (release year 2003). Source of data: http://www.rmpc.org/
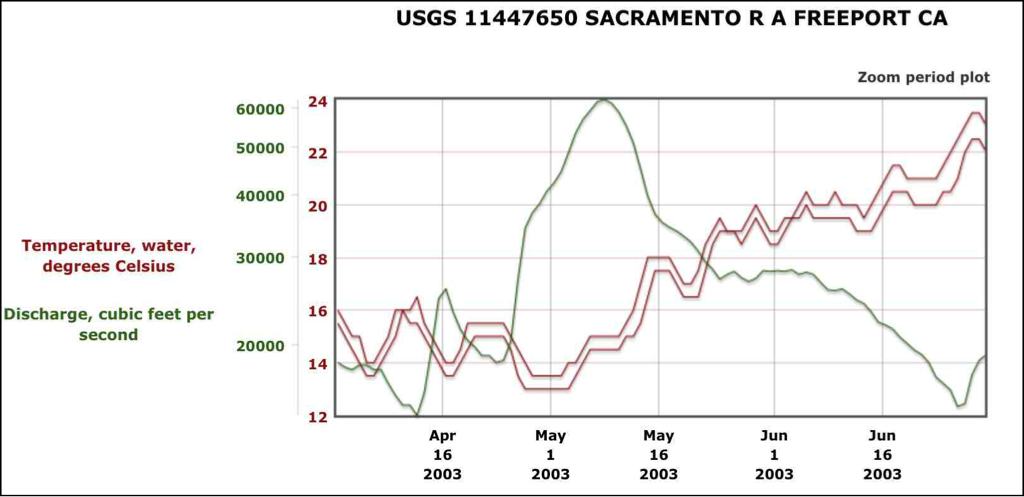
Figure 3. Water temperature and mean daily river flow in the lower Sacramento River channel of the Delta at Freeport in spring 2003. (USGS chart)
Brood Year 2003
Hatchery smolt returns for brood year 2003 were mediocre. The juvenile salmon were released in the below-normal water year 2004. The poor performance is generally attributed to poor river conditions in 2004 and poor ocean conditions in 2004-2006. A closer look at release return rates (Figure 4) shows few good returns (>1%); this reflects the poor river and ocean conditions. Some Bay-release return rates were good (>1%). The higher Delta-release and Bay-release return rates occurred with higher early-to-mid April flows (Figure 5). May river releases had near-zero rates of return. Overall, Bay-release return rates (all with net pens) far outperformed Delta and river releases, reflecting the advantage of bypassing poor river and Delta conditions after mid-April in 2004.
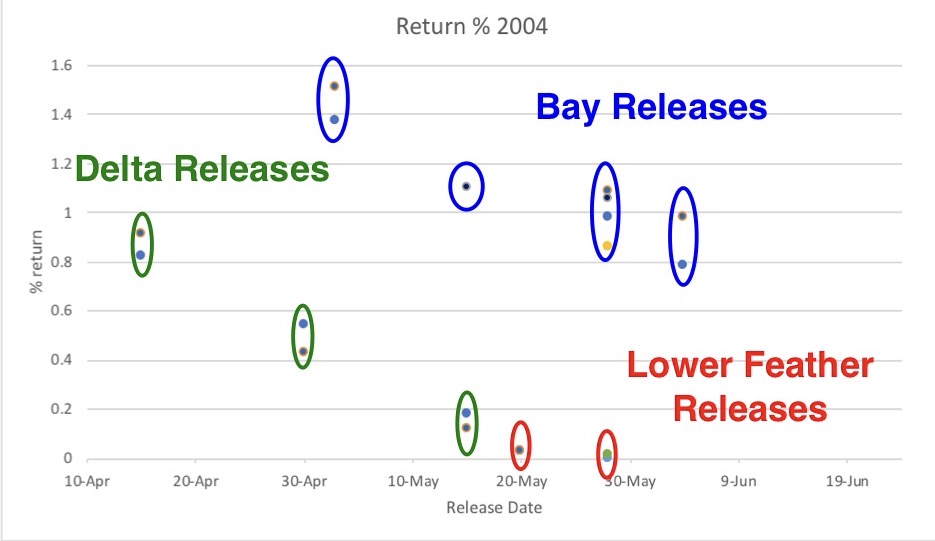
Figure 4. Feather River hatchery fall-run salmon return rates by release method for brood year 2003 (release year 2004).
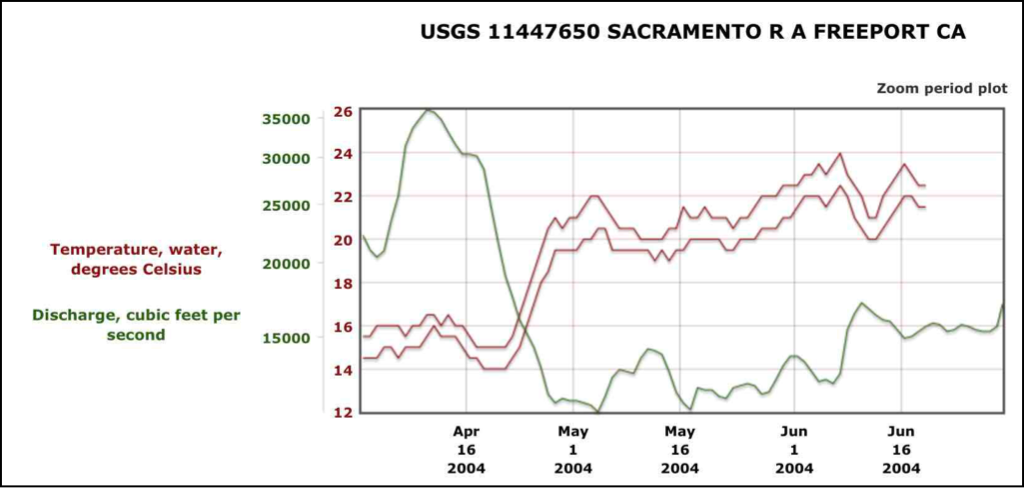
Figure 5. Water temperature and mean daily river flow in the lower Sacramento River channel of the Delta at Freeport in spring 2004. (USGS chart)
Brood Year 2004
Hatchery smolt returns for brood year 2004 were poor despite the fact that juvenile releases took place in the above-normal water year 2005. The poor performance is generally attributed to poor ocean conditions in 2005-06. A closer look at release return rates (Figure 6) shows poor returns (<1%) reflecting the poor ocean conditions. Some return rates were extremely poor (<0.01%). Compared to good return rates of 1-4% in other years (see Figure 1), these rates are extremely low. For example, a normal annual release of 4 million smolts from the Oroville Hatchery would return 40,000 adults at 1% and only 400 at 0.01%. A closer look at Figure 6 release rates and water conditions in spring 2005 (Figure 7) indicates higher survival of releases into the Feather River and Bay during the May flow pulse, although Bay release rates (all net pens) averaged twice those of river releases.
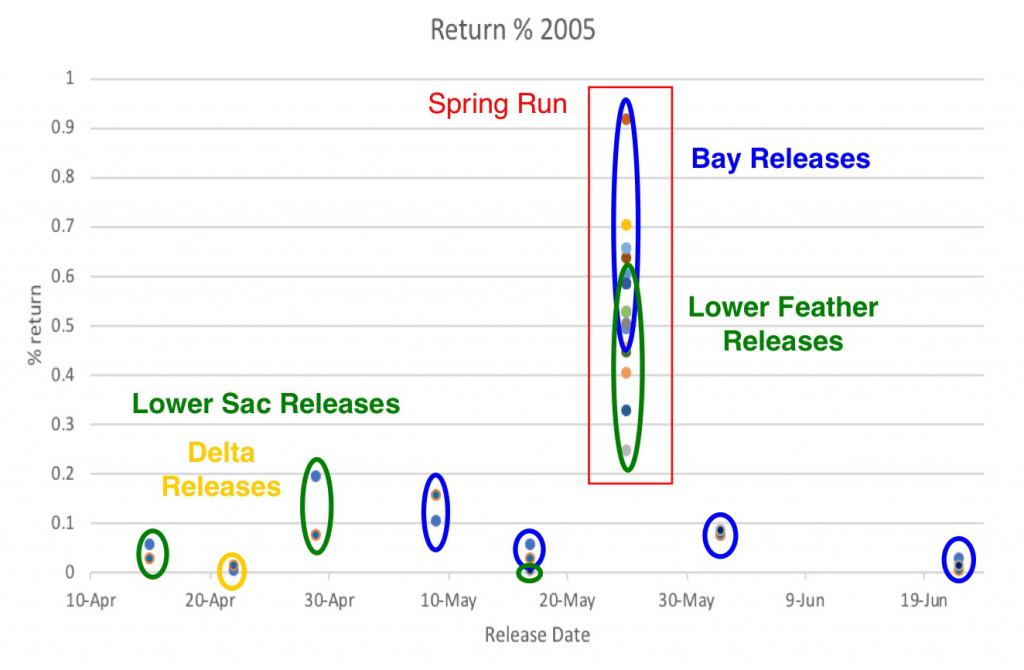
Figure 6. Feather River hatchery fall-run salmon return rates by release method for brood year 2004 (release year 2005).
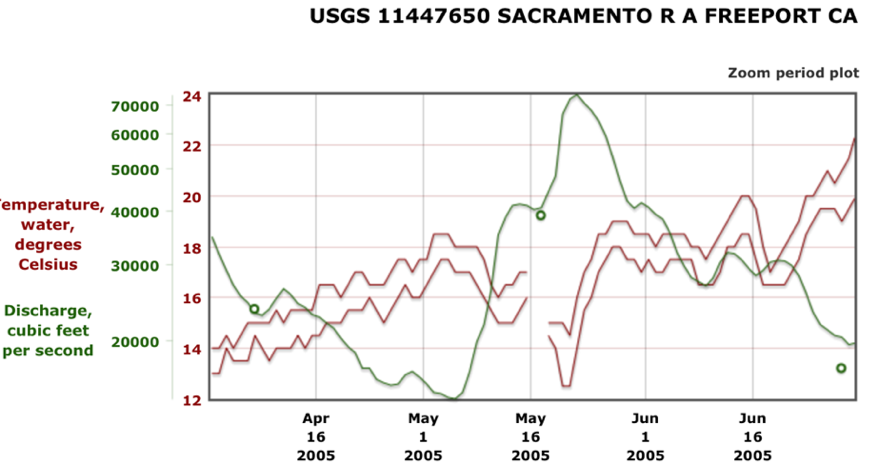
Figure 7. Water temperature and mean daily river flow in the lower Sacramento River channel of the Delta at Freeport in spring 2005. (USGS chart)
Brood Year 2005
Brood Year 2005 releases in the very wet year 2006 had return rates that were very poor for both Delta and Bay releases, reflecting very poor ocean conditions (no chart shown). Delta releases averaged 0.1 % return, with Bay releases (no pens) only slightly higher at 0.2 %. These low rates, along with similar low rates from other Central Valley hatcheries, contributed to the salmon fishery collapse of 2008.
Brood Year 2006
Hatchery smolt returns for brood year 2006 were poor (Figure 8). The poor performance is generally attributed to poor river, Delta, and Bay conditions in the 2007-2009 drought, and mediocre ocean conditions. Many return rates were very poor (<0.1%). Some of the higher returns came from earlier releases (April), when Delta inflow was higher and water temperatures were lower (Figure 9).
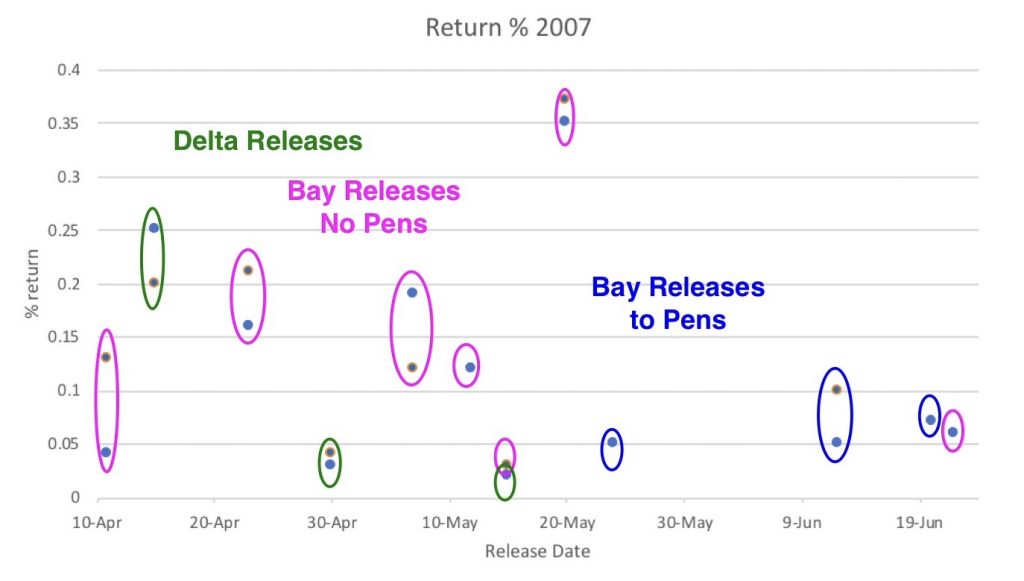
Figure 8. Feather River hatchery fall-run salmon return rates by release method for brood year 2006 (release year 2007).
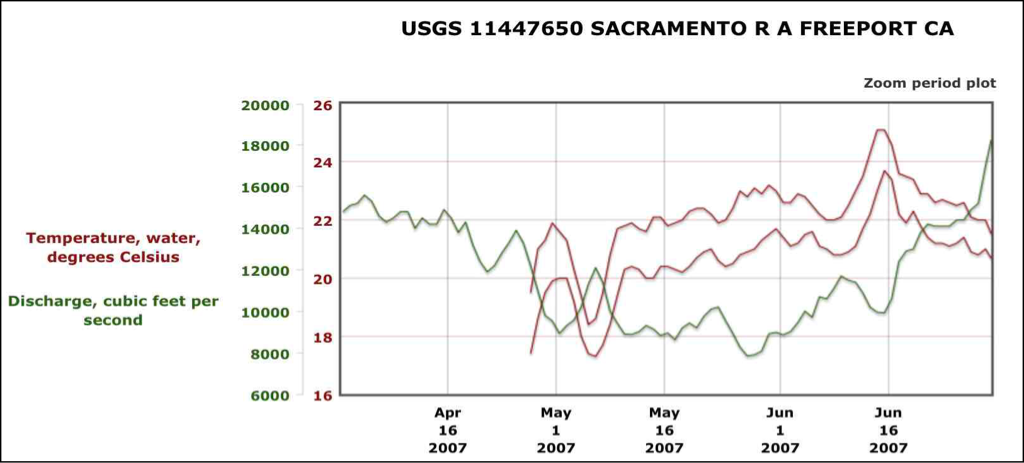
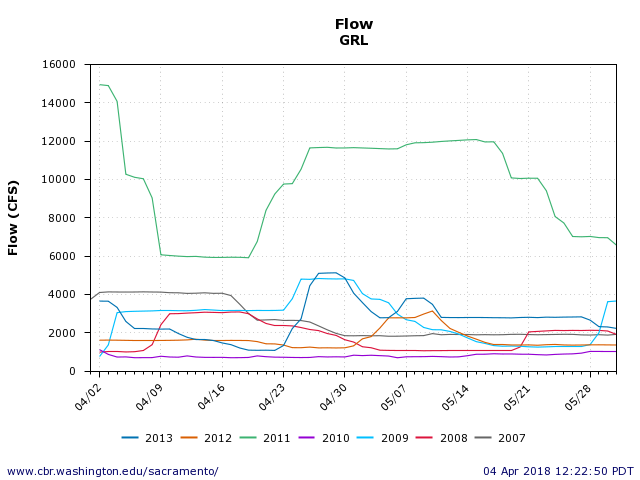
Figure 9. Water temperature and mean daily river flow in the lower Sacramento River channel of the Delta at Freeport in spring 2007. (USGS chart)
Brood Year 2007
Hatchery smolt returns for brood year 2007 were generally poor (Figure 10). The poor performance is generally attributed to poor river, Delta, and Bay conditions in the 2008-2009 drought, and relatively poor ocean conditions, except in 2010. Many return rates were very poor (<0.1%). Some Bay pen release return rates were good (>1.0%). Most of the lower return rates came from May river releases under poor conditions (Figure 11). Bay pen release return rates were generally substantially higher than non-pen Bay releases during May.
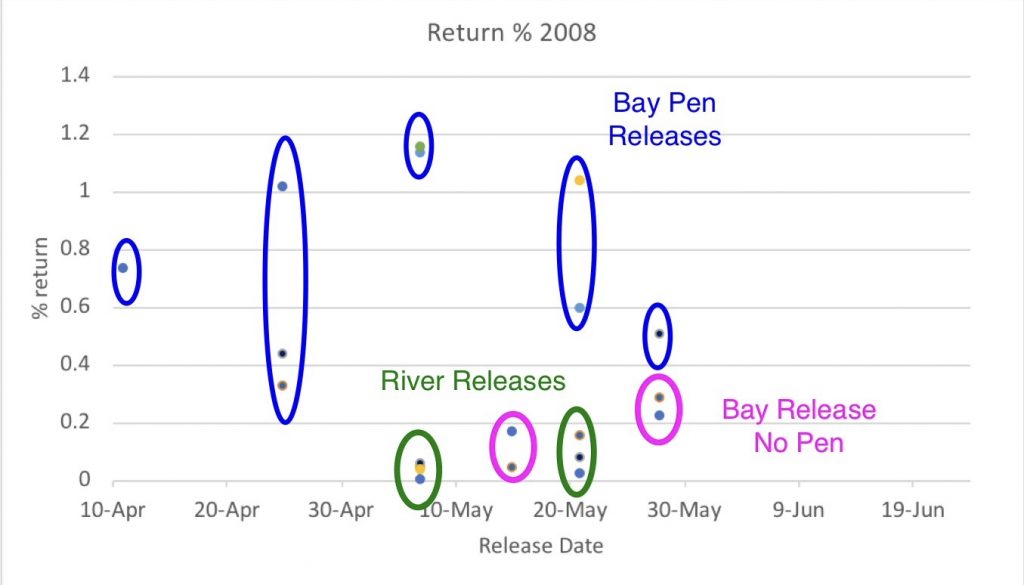
Figure 10. Feather River hatchery fall-run salmon return rates by release method for brood year 2007 (release year 2008).
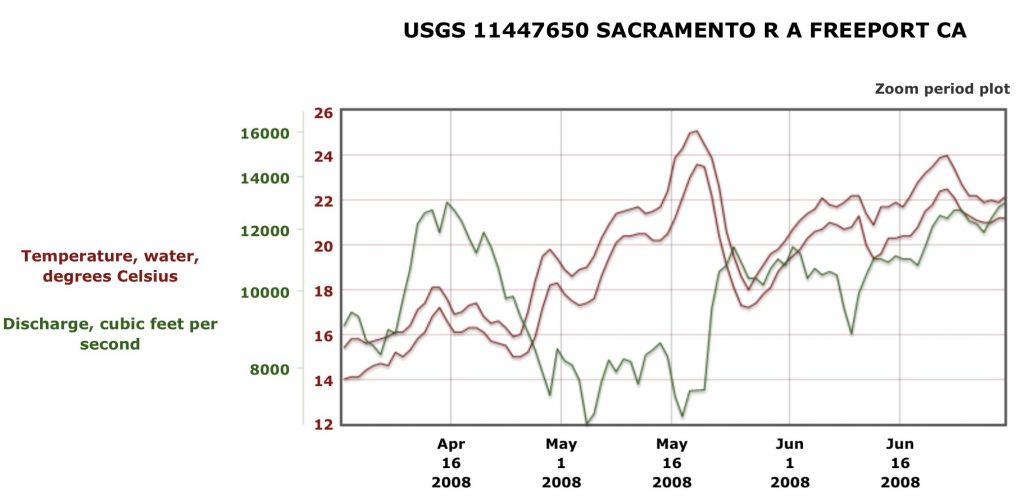
Figure 11. Water temperature and mean daily river flow in the lower Sacramento River channel of the Delta at Freeport in spring 2008. (USGS chart)
Summary and Conclusions
In summary, return rates from Oroville Hatchery fall-run salmon smolt releases vary greatly with ocean, river, Delta, and Bay conditions, within and among years. With up to 6 to 8 million fall-run smolts released each year, highly variable return rates result in highly variable catches of adult fish in coastal and river fisheries and spawner escapement to rivers and hatcheries. Good years can yield 1 or 2 percent total returns – producing 60,000-160,000 adult salmon returns. Poor years may yield only 0.1% or less – just 6,000-16,000 adult returns. Factors affecting the return rate include:
- Ocean conditions.
- River, Delta, and Bay conditions.
- Release location – Feather River, lower Sacramento River below mouth of Feather, north Delta, San Pablo/North Bay, and coastal bays north and south of San Francisco.
- Release method – trucked to river, Delta, or Bay boat ramps for direct release, trucked to acclimation pens in Delta or Bay, or trucked to feeding pens in coastal bays.
- Age/size of released smolts – February through July: early spring smolts, normal spring smolts (mid-April to mid-May), and advanced late spring smolts (mid-May to mid-June). Late spring releases are limited to the Bay because the rivers and Delta are too warm.
- Date of release – winter release of hatchery fry and fingerlings, spring release of smolts, late spring and summer release of advanced smolts.
The following actions by hatchery and resource managers can enhance returns to a limited extent, depending on conditions.
- Trucking to lower Sacramento River, Delta, Bay, or coastal bays.
- Acclimating trucked fish in pens prior to release.
- Timing releases to best available release conditions.
- Enhancing release conditions (e.g., flow pulses).
- Barging smolts to the Bay from the lower Feather River.
The most problematic situation for managers is improving returns in years with very poor ocean conditions (e.g., 2006). Under such conditions, trucking to Bay pens appears to be the best option and is the present management scheme. Barging smolts to the Bay may provide an added benefit. Under good ocean, Bay-Delta, and river conditions, releases to river and Delta locations with a supplemental flow pulse may provide good returns. Releases to lower Feather River locations generally provide poor returns regardless of conditions.
A further enhancement option is rearing hatchery fry in floodplain rice fields adjacent to the lower Feather River. Besides the obvious benefit of “natural” rearing, high growth would allow smolt release at least a month earlier than hatchery smolts. Such natural smolts could be trucked or barged to the Bay from near the rearing sites. A return rate of 5-10% from such smolts is conceivable, with the potential of contributing substantially to coastal and inland salmon fisheries.