The National Marine Fisheries Service’s biological opinion (NMFS BO) on the proposed “California WaterFix” (Delta Twin-Tunnels Project) concludes there will be no significant effect on protected salmon, steelhead, and sturgeon in the Central Valley. In this post, I address the conclusions in the NMFS BO on the potential effects of WaterFix on salmon and steelhead in the Delta. This is one in a series of posts on the WaterFix. Within that series, it is the second post of the series on the NMFS BO.
The NMFS BO concludes that WaterFix operations would have significant adverse effects on salmon, steelhead, and sturgeon and their critical habitat in the Central Valley from changes brought about by the WaterFix Twin Tunnels Project. In contrast, the NMFS BO also states that the WaterFix is not likely to jeopardize the species or adversely modify their critical habitat. How such contradictory conclusions are possible, especially for the rather demonstrable Delta effects, is simply beyond reason. Previous drafts of the BO had not made that jump. There is no amount of adaptive management within reason, especially given past poor performance in operating the water projects and managing effects on fish, that can alleviate the potential great risks to Central Valley fishes from the adding the WaterFix Twin Tunnels to the state and federal water projects.
The “new” NMFS BO focuses on changes in flow patterns in the Delta below the three proposed diversion points in the North Delta. The diversions of up to 9,000 cubic feet per second (cfs) would change flow and flow splits downstream in Steamboat, Sutter, and Georgianna sloughs and the Delta Cross Channel, as well as in the main Sacramento River channel. As a consequence, freshwater flows entering the interior Delta from the north Delta would also change, as would Delta outflow to the Bay to the west. Young salmon, steelhead, and sturgeon from the Sacramento River and San Joaquin River basins would be affected by these changes upon entering the Delta on their way to the Bay and ocean.
The NMFS BO concludes that the up-to-9000 cfs diversion of the WaterFix would reduce channel velocities below the intakes in the north Delta. “Under the PA [Proposed Alternative] water velocities in the north Delta would be lower…. This would increase migratory travel time and potentially increase the risk of predation for juvenile salmonids.” (p. 602) In the past, based on my own assessments, survival of hatchery and wild salmon and steelhead to the Bay may have been reduced by 50-to-90 percent based on differential survival of marked hatchery smolts released above and below the Delta under differing flow regimes. The NMFS effects assessment is based on survival of radio tagged, large, late-fall hatchery smolts during the winter; this indicates just a small differential in survival. The real effect is likely somewhere in between and highly variable depending on a wide range of circumstances. No doubt a serious concern remains for the future of the various listed species and success potential of future commercial and recreational fisheries.
The greatest risks are to pre-smolt winter-run salmon in the fall season and to juvenile spring-run and fall-run salmon and steelhead in the spring.
“In the South Delta, median velocities generally increase under the PA…. The positive change in velocity would decrease migratory travel time and reduce predation risk for juvenile salmonids.” (p. 602) The conclusion is that exports from the south Delta will decline from November through June because of WaterFix. That simply is not true, because south Delta exports are already constrained during those months. WaterFix would not change those overall constraints; it would only add to the overall diversion capacity. Export restrictions based on net flows will remain the same; thus there will be no changes in rules governing the south Delta exports. Furthermore, the 9,000 cfs taken by WaterFix will reduce Sacramento River freshwater inflow into the central and south Delta, increasing any effects of south Delta diversions on the interior Delta’s hydrodynamics. The relative effects on San Joaquin River Delta inflows will remain the same or even increase.
“In the Central Delta, there is little difference in magnitude of channel velocities between the NAA [No Action Alternative] and PA.” (p. 602) While it is true there is little difference for channel velocities in this highly tidally driven region, it is not true for freshwater inflow, salinity gradients, and water temperatures, or for relative flow signature differences for the San Joaquin and Sacramento Rivers within the central Delta. The loss of Sacramento River freshwater inflow into the central Delta via Georgianna Slough and the Delta Cross Channel (when open) is significant. Tidal inflows from the west Delta into the central and south Delta in the San Joaquin and False River channels will increase, potentially reducing survival of San Joaquin salmon and steelhead. Sacramento River salmon and steelhead survival, already reduced by lower flows below the tunnel intakes, would be further reduced by lower survival of fish that passed through Georgianna Slough or the Delta Cross Channel, or through cross-Delta movement through Three-Mile Slough.
“In the North Delta, reverse flows would increase in most water years and months…. In the North Delta, the PA had a higher proportion of each day with negative velocities (reverse flow) particularly in Steamboat Slough and Sacramento River downstream of Georgiana Slough”. (p. 602) The loss of freshwater inflow to the WaterFix Twin-Tunnel diversion would decrease the extent in location and timing of unidirectional flow in the tidal Sacramento River (Figure 1). Diversions during times when Freeport flows were in the range of 15,000-35,000 cfs would change the river from virtually non-tidal to tidal.
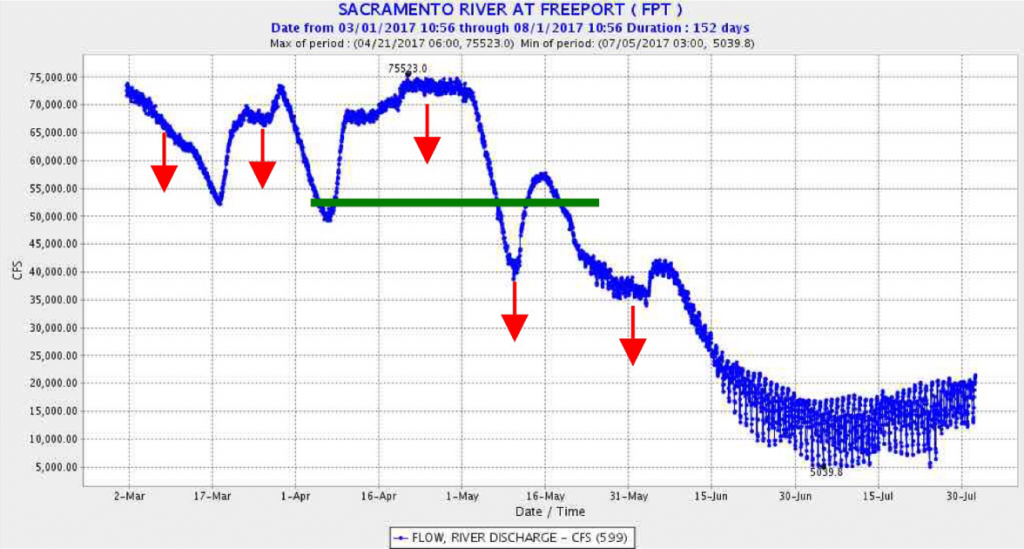
Figure 1. Example period: flows at Freeport March-July 2017. Red arrow denotes 9,000 cfs WaterFix tunnel diversions above the 35,000 cfs inflow. WaterFix diversions would be minimal below 15,000 cfs inflow. Green line denotes point at which flow would become tidally influenced with WaterFix as seen after June 15 when hourly flows varied from 5000 to 15,000 cfs during a tidal cycle. Note: for location of gages, see Figure 4 map.
The effect downstream at the flow splits of the Sacramento River at Georgianna Slough and Steamboat Slough is even more pronounced (Figures 2 and 3). In the Sacramento River below the Georgianna Slough split, flood tides would turn negative earlier in the season with upstream WaterFix diversions (Figure 2). Likewise, Steamboat Slough flood tides would turn negative with WaterFix when Freeport flows fall to 25,000 cfs. In 2017, that would have meant negative flows nearly a month earlier with WaterFix (Figure 3). Not only do WaterFix diversions reduce flows in the northern Delta channels, they would turn migration period conditions poorer (reverse flows and higher water temperatures) nearly a month earlier than under present conditions. “In order to more thoroughly evaluate the impact of reverse flows on migrating salmon, NMFS undertook an additional analysis. The likelihood of juvenile fish entering migratory routes with reduced survival increases with the daily probability of flow reversal, or with increases in the proportion of each day with flow reversals. The probability of juvenile Chinook salmon getting entrained into migratory routes of lower survival like Georgiana Slough and the Delta Cross Channel is highest during reverse-flow flood tides (Perry et al. 2015). In addition, the proportion of fish entrained into Georgiana Slough on a daily basis increases with the proportion of a day that the Sacramento River downstream of Georgiana Slough flows in reverse (Perry et al. 2010). Consequently, diverting water from the Sacramento River could increase the frequency and duration of reverse-flow conditions, thereby increasing travel time as well as the proportion of fish entrained into the interior Delta where survival probabilities are lower than in the Sacramento River (Perry et al., 2010 and 2015)…. In the north Delta, increase in flow reversals downstream of Georgiana Slough are of concern for migrating salmonids…. Increases in flow reversals would likely reduce the survival probability of outmigrating smolts by moving them back upstream, increasing their exposure to junctions that lead to migratory routes of lower survival, such as in Georgiana Slough.” (p. 603)
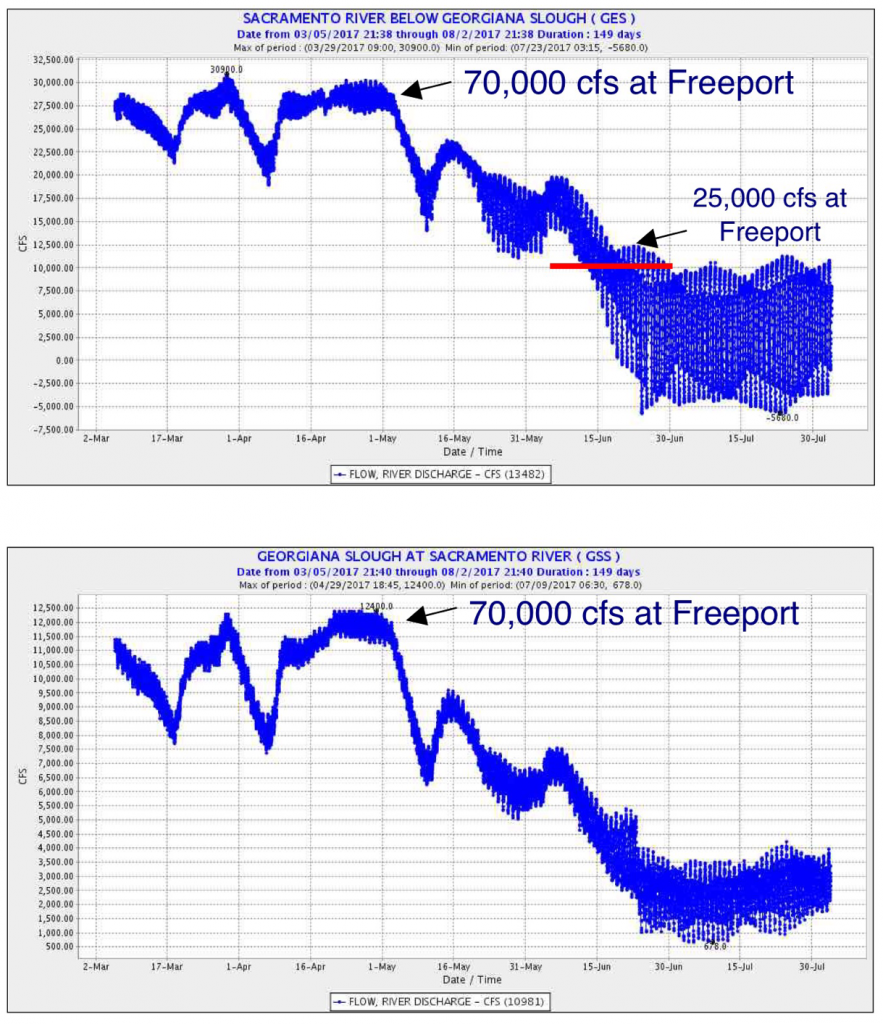
Figure 2. Example period: flows at Georgianna Slough flow split March-July 2017. Red line notes when condition in Sacramento River below Georgianna Sough at which flood tides reverse river flow – when Freeport flow is below 25,000 cfs. In contrast, flows in Georgianna Slough would not become negative.
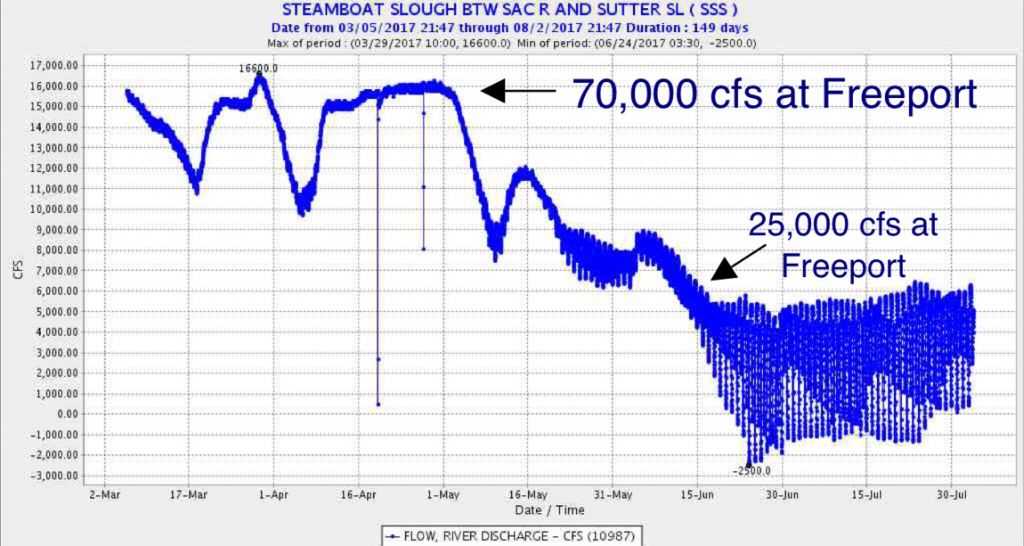
Figure 3. Example period: flow in Steamboat Slough below split March-July 2017. Flow in Steamboat Slough becomes negative when Freeport Sacramento River flow falls below 25,000 cfs. Under WaterFix, Steamboat Slough flows could become negative at Freeport flows below 34,000 cfs.
“The proposed NDD bypass rules include a commitment to an operational constraint that the amount of flow withdrawn at the NDD cannot exacerbate reverse flows (i.e., increase the frequency, magnitude, or duration of negative velocities) at the Georgiana Slough junction from December through June beyond what would occur in NAA. However, the BA does not describe the methods or the modeling that would show how this would be achieved. Specifically, the BA does not describe: 1. The extent that the proposed NDD bypass rules may affect the frequency, magnitude and duration of reverse flows in the lower Sacramento River; 2. The description of how real-time monitoring could be implemented to meet the criteria of not increasing reverse flows; 3. The modeling simulations that would show how this criteria is being met and therefore provide reasonably accurate bypass flow levels.” (p. 603).
In the example shown in Figures 2 and 3 above, WaterFix diversions would exacerbate reverse flows unless no diversion was allowed below a 35,000 cfs Freeport flow, a commitment not made in WaterFix proposal.
This is a major flaw in the NMFS BO assessment. Even NMFS acknowledges this fact: “The probability of a flow reversal in the Sacramento River downstream of Georgiana Slough occurring at some time during a 24-hour period is one hundred percent when Sacramento River flows at Freeport are less than 13,000 cfs (Figure 2-118 top panel). Likewise, when flows are greater than 23,000 cfs, flow reversals are not expected to occur at the Georgiana Slough junction.” (p. 606) A flow of 23,000 cfs would occur below the tunnel diversions when Freeport flow is 32,000 cfs.
“The following assumptions were used: 1) the NDD bypass rules are applied based on mean daily Sacramento River discharge at Freeport, and 2) water is diverted at a constant rate over an entire day such that the bypass flow is constant over the day. The analysis adheres to a strict interpretation of the NDD bypass rules and does not include flow variations at sub-daily timescales.” (p. 606) Note that diverting 9000 cfs on a flood tide with Freeport flow at 30,000 cfs would cause a flow reversal in Steamboat Slough and in the Sacramento River below the split at Georgiana Slough (Figures 2 and 3).
“October-November operations can greatly increase the probability of reverse flow; for example, when flows at Freeport are between 20,000 to 25,000 cfs there would be ~100% increase in flow reversals under the PA (Figure 2-124)… .(p. 606) The months with the largest increases in travel time for both the PA and L1 occur during the off-peak Chinook salmon migratory months of October, November, and June. During the peak Chinook salmon migratory window of December through April, February and March have the largest increases in travel time under the PA.” (p. 615) Such flows may occur in October-November from early storms, and a large influx of winter-run salmon pre-smolts would be expected to enter the north Delta under these circumstances. NMFS expects that restrictions on diversions during early pulses and changes to Delta Cross Channel operations would protect winter-run.
“However, if flow in November becomes sufficient through storm runoff events to trigger winter-run emigration towards the Delta, a pulse protection will apply that will limit diversions to low level pumping for a certain amount of days or until fish presence is not detected based on real-time management criteria. Without this protection, early emigrating winter-run would be subject to some of the more extreme diversion levels allowed, probability of reverse flows would increase, and winter-run Chinook salmon would face greater risk of entrainment into interior Delta and overall lowered survival.” (p. 625) WaterFix does not propose to protect all fall pulses, nor winter flow pulses. There would be no restrictions on south Delta diversions, which would be 11,400 cfs under these conditions. The WaterFix would thus exacerbate the existing level of impacts, which are quite serious in the fall of wetter years.
NMFS also notes potential serious consequence to spring-run and fall-run salmon: “May has a unique set of NDD bypass rules that is slightly less protective than the diversion rules in December through April because Level 2 or 3 could be enacted if bypass flow criteria have been met. 5% to 13% of spring run Chinook salmon smolts are expected to be in the Delta during this month (Table 2-171). They may experience slightly longer travel times than smolts traveling during earlier months given the same inflow at Freeport. This would be due to lower velocities that may result from less restrictive diversions as defined by the NDD bypass rules.” (p. 631) Most Sacramento Valley hatchery fall-run smolts are released into rivers or the Delta in late April and early May – they too are vulnerable to WaterFix-induced reverse flows in the Delta.
- NMFS eventually concludes that reductions in survival in the north Delta are balanced by increased survival in the south Delta: “Interpretation of these analyses must also consider that small changes in absolute survival could translate to a large effect to a population, especially in years when overall Delta survival is low. The 2-7% increase in Delta survival that would occur if entrainment into the interior Delta were eliminated (Perry et al. 2012) resulted in a 10-35% relative change in survival for five of the six release groups in that study.” (p. 663) First, there is no basis to the assessment findings that Delta exports, already restricted in the December to June period, would be further restricted with WaterFix. Second, the assessment of the south Delta effects did not take into account the added stress of reduced inflow of Sacramento River water into the interior Delta because of WaterFix. NMFS qualifies its own conclusion: “The extent to which management actions such as reduced negative OMR reverse flows, ratio of San Joaquin River inflow to exports, and ratio of exports to Delta inflow affect through-Delta survival is uncertain.” “Uncertainty in the relationships between south Delta hydrodynamics and through-Delta survival may be caused by the concurrent and confounding influence of correlated variables, overall low survival, and low power to detect differences.” (p. 687)
NMFS concludes no adverse effects: “After reviewing and analyzing the current status of the listed species and critical habitat, the environmental baseline within the action area, the effects of the proposed action, any effects of interrelated and interdependent activities, and cumulative effects, it is NMFS’ biological opinion that the proposed action is not likely to jeopardize the continued existence of Sacramento River winter-run Chinook salmon, CV spring-run Chinook salmon, CCV steelhead, Southern DPS of North American green sturgeon or destroy or adversely modify designated critical habitat for these listed species.” (p. 1111) The basis for these conclusions appears to be balancing of north Delta negative effects with south Delta benefits, as well as the adaptive management capability offered by WaterFix.
In summary, then:
- NMFS has understated the potential effect of the WaterFix on salmon migration survival through the Delta and the potential to minimize tidal effects based on WaterFix’s proposed rules and commitments. “(I)n the May 2016 Revised PA, DWR committed to Delta habitat restoration at a level that RMA Bay-Delta modeling indicates could prevent exacerbation of reverse flows in the north Delta due to the PA by changing the tidal prism in the Delta (see Section 2.5.1.2.7.1.2 NDD Bypass Flows and Smolt Entrainment Analysis).” (p. 623)
- NMFS has overestimated the potential benefits of changes in the south Delta.
- Based on past experience, NMFS’s assumption that real-time management of Delta operations by DWR and Reclamation (USBR) can overcome potentially damaging conditions is unfounded.
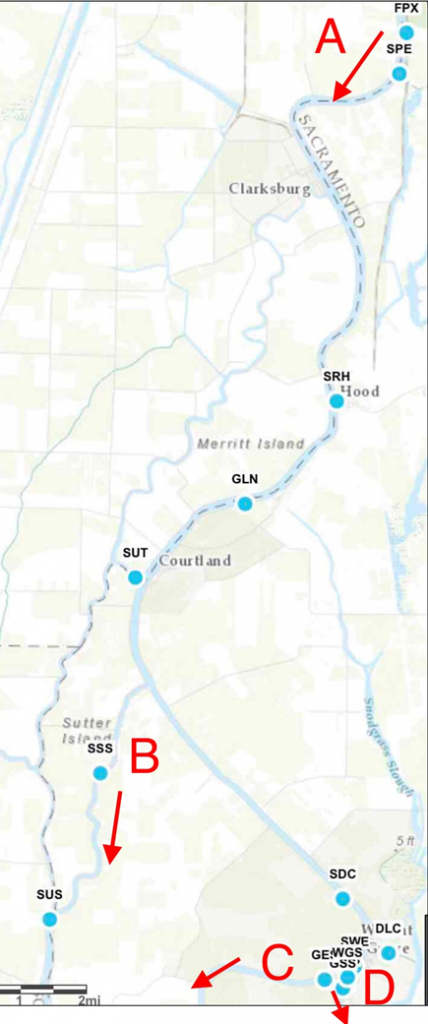
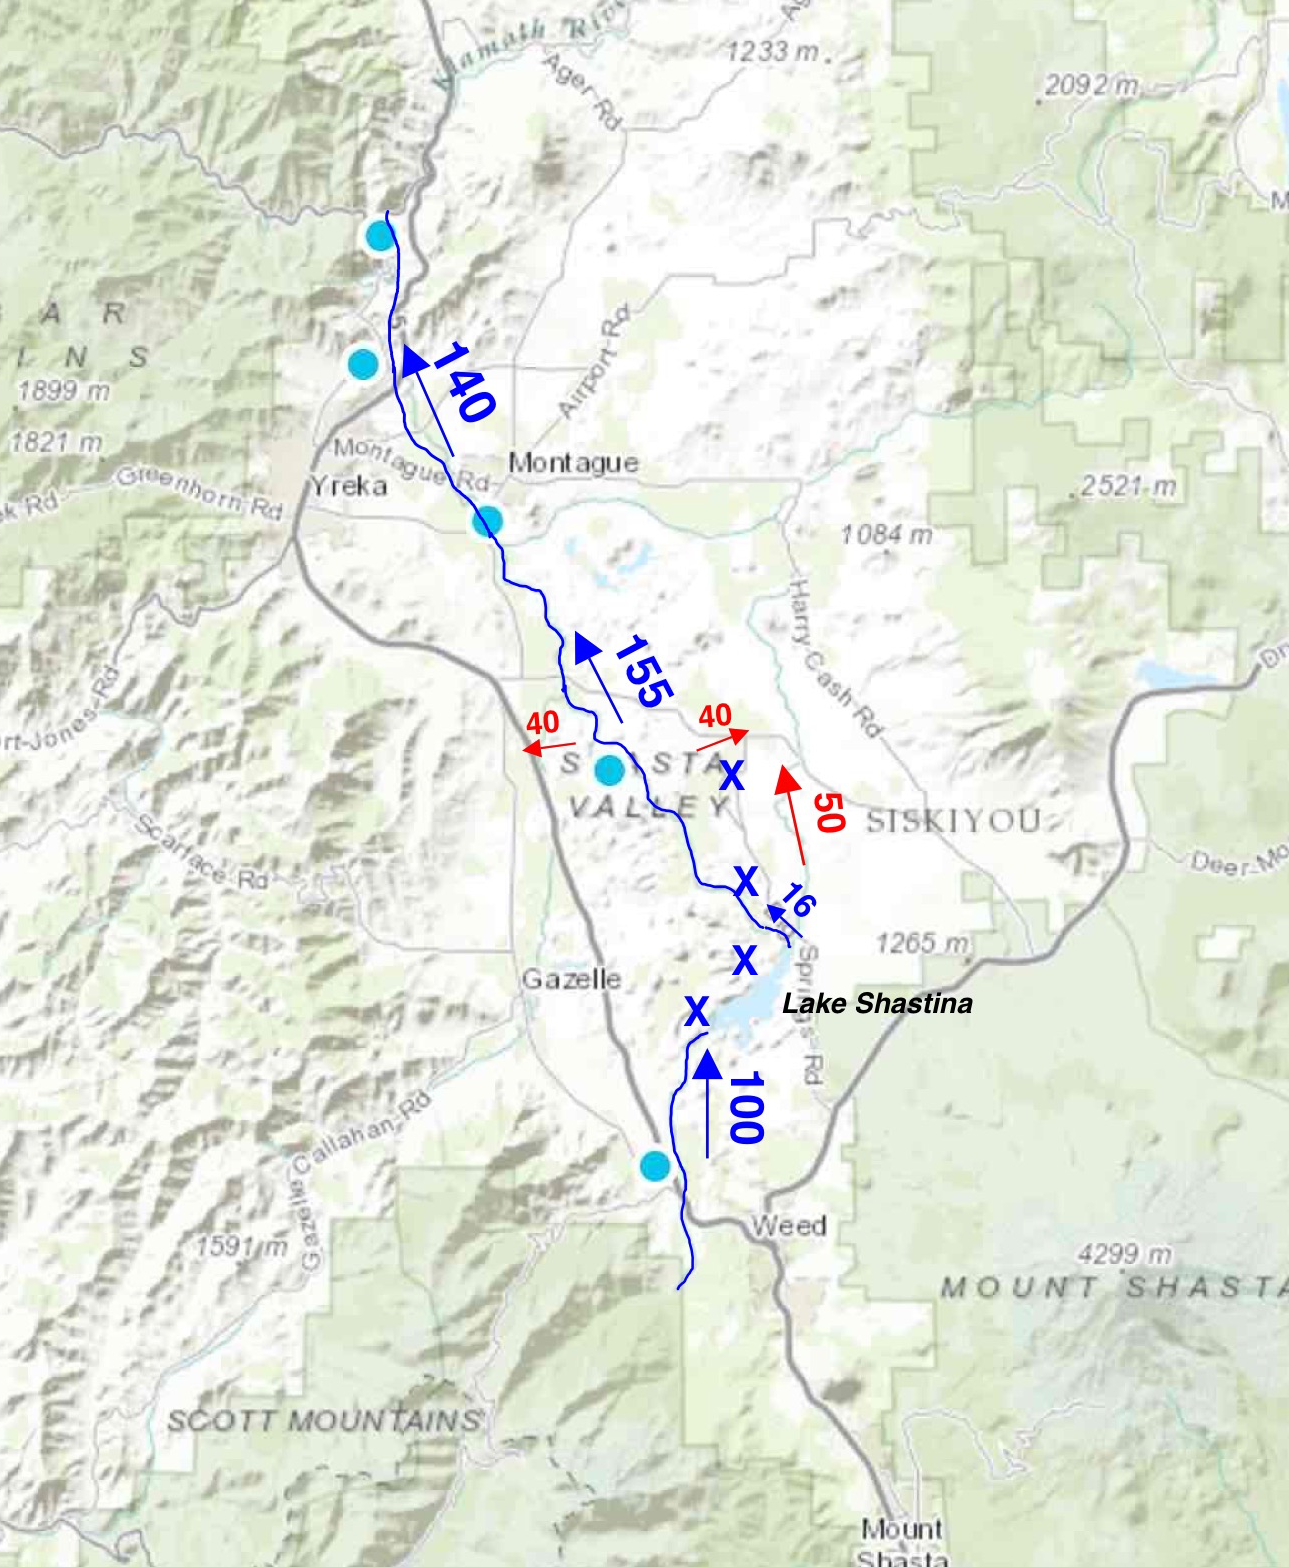
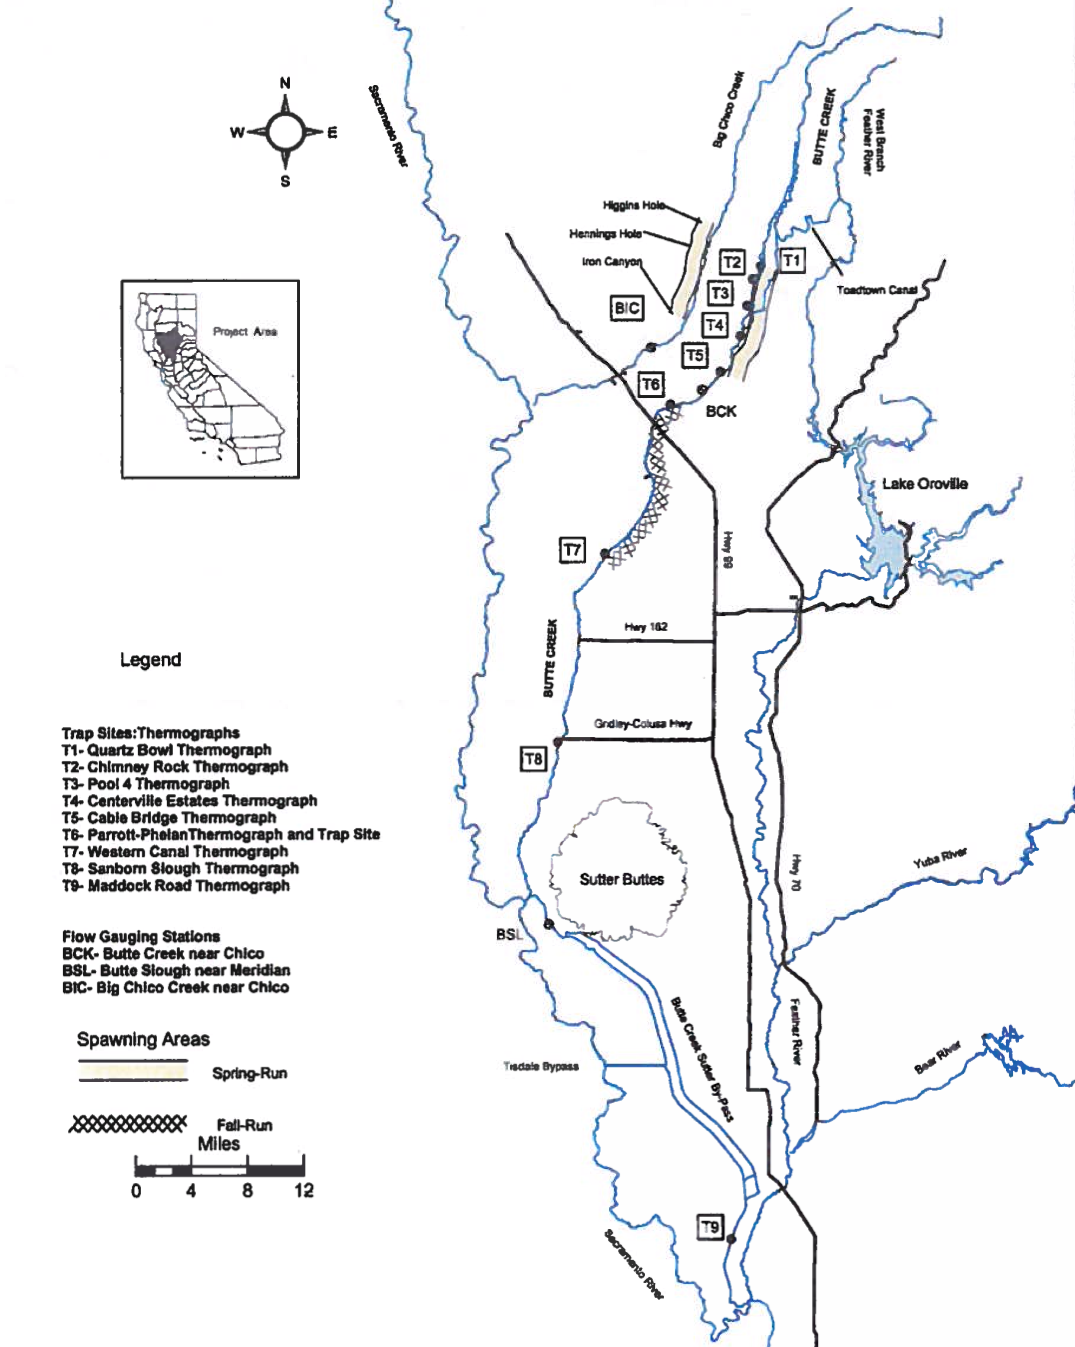
Figure 4. Map of key north Delta flow measurement locations.
“A” is Sacramento River at Freeport.
“B” is Sutter-Steamboat Slough.
“C” is Sacramento River below outlet to Georgiana Slough.
“D” is Georgianna Slough.