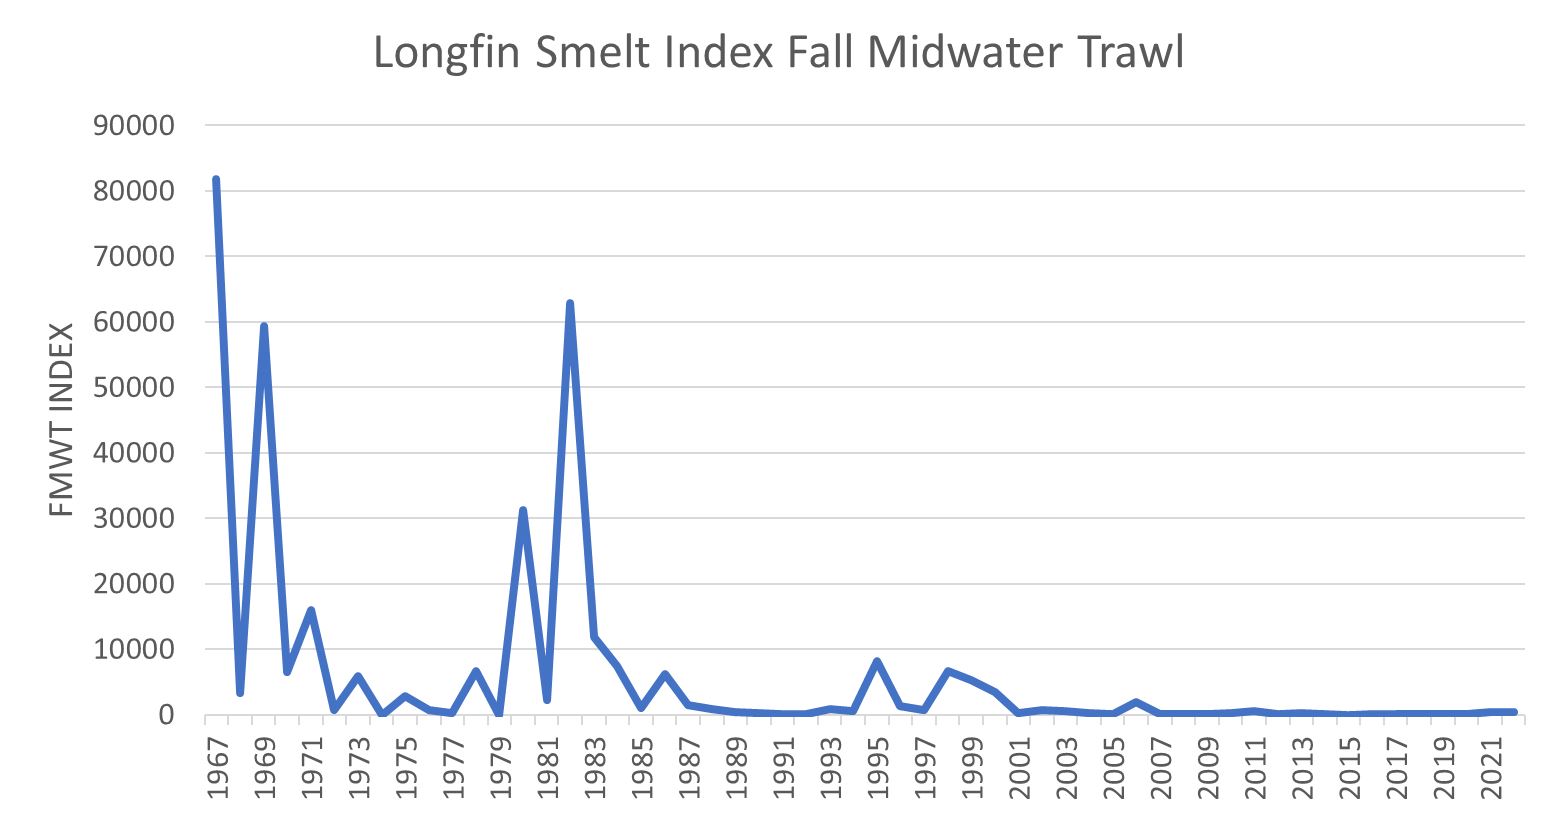
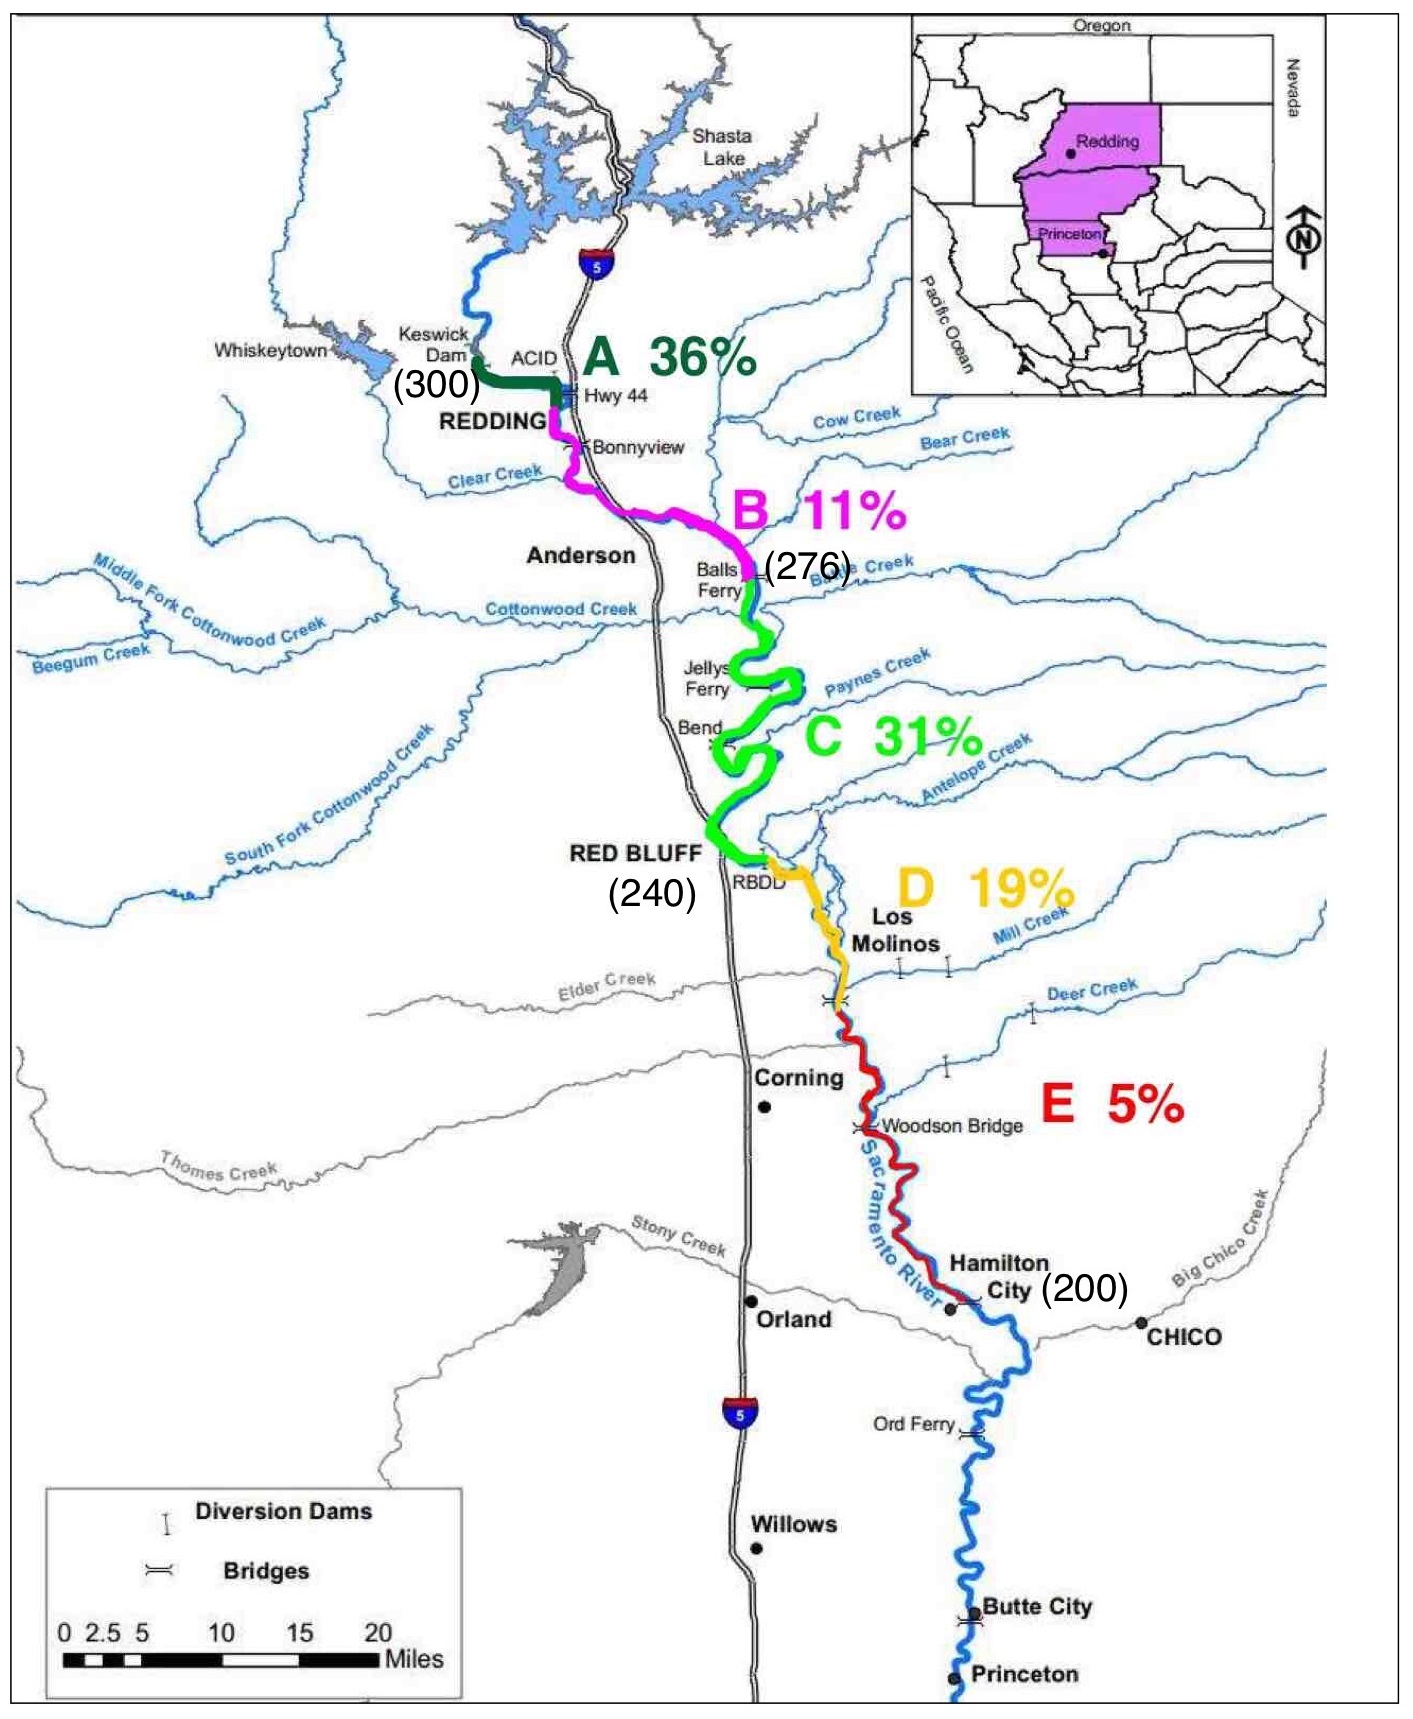
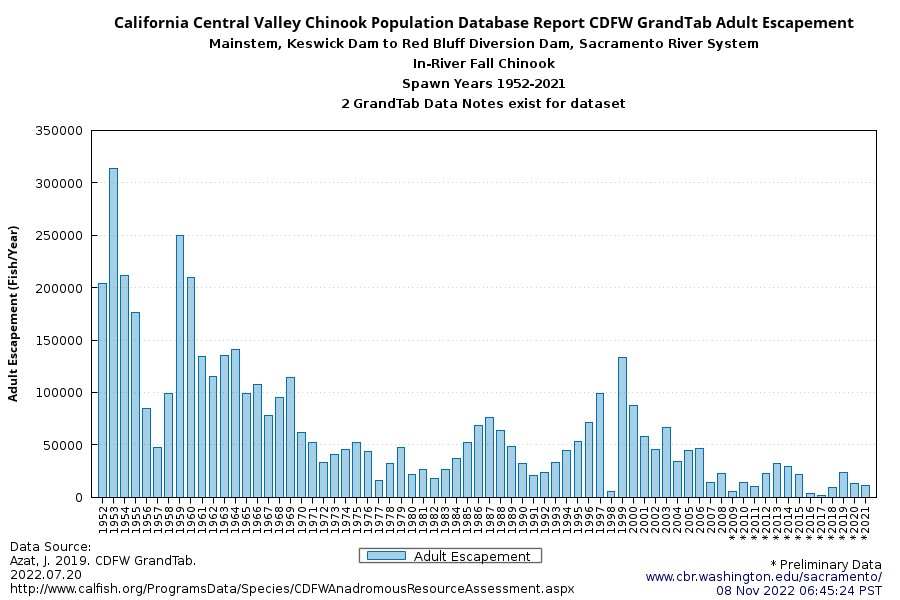
The harvest of Sacramento River fall-run salmon – the largest of California’s dwindling salmon runs – is managed by both state and federal agencies and is based on past-to-present figures of long-term adult escapement (i.e., fish that aren’t caught and survive to spawn) (Figure 1).
The harvest is coordinated under the Pacific Fishery Management Council (PFMC), because many of the ocean fisheries take mixed stocks from both the US states and Canadian provinces. The “fishable” Sacramento River fall-run population is defined as the total number of adults in the ocean and rivers available for harvest in the ocean and rivers. The harvestable stock is defined as adults. It does not include grilse (salmon returning to freshwater after a single season at sea), whose harvest is generally not allowed.
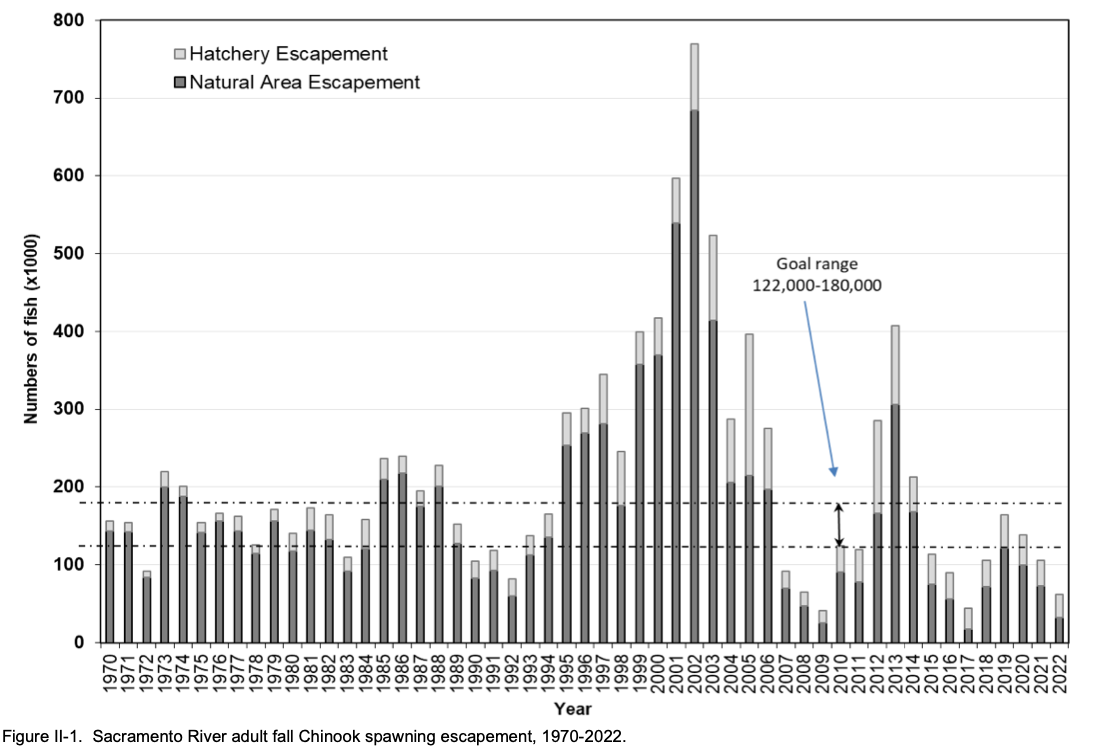
Figure 1
The PFMC has declared an adult salmon escapement of 122,000-180,000 as a target goal range, a figure that theoretically provides a sustained yield for the fishery. However, because escapement estimates are not made until the end of the fishery harvest, total escapement has usually fallen below the maintenance goal – especially during drought years or after multiyear droughts.
In some years, sanctioned harvests have led to over-fishing (e.g., 2007, Figure 2). This is because the harvest control rules the PFMC employ are often based on inaccurate estimates of the size of the harvestable stocks and the relative effectiveness of the fisheries – how good the fisheries are at catching salmon (very good, it turns out).
Together, these harvest model errors and biases have led to over-fishing. This is not a new problem. Excessive harvests contributed to closure of the ocean salmon fishery off California in 2008 and 2009.
The PFMC and its constituent states and provinces are now developing harvest control rules for the 2023 fisheries. For the Sacramento River fall-run population, the preliminary estimate of the 2023 harvestable stock is approximately 180,000 fish; accordingly, the PFMC is anticipating a sanctioned harvest, and is now preparing harvest control rules.
But it would be a grave mistake to authorize a 2023 Sacramento River fall-run harvest; there should be no harvest allowed this year. Why? There are multiple reasons.
First, the 2019 to 2022 population trend was decidedly downward (Figure 1), and the salmon stock was overharvested in 2021 and 2022. Also, water year 2021 was a critical drought year that led to poor survival of the 2020 brood year fish. Due to drought conditions, 2021 brood year salmon experienced poor spawning, incubating, rearing, and emigration conditions. As a result, the fishable brood year 2020 and 2021 stocks now in the ocean are likely small, and their return to their natal rivers will likely be minimal. Indeed, the return (escapement) numbers for the 2020 brood year fish could be even lower than those for 2009, 2017, or 2022 – all abysmal years for returning salmon.
The bottom line: prospects for recovering a wild or natural-born salmon population in the Sacramento River and its tributaries will be substantially diminished if a salmon fishery is allowed in California this year.
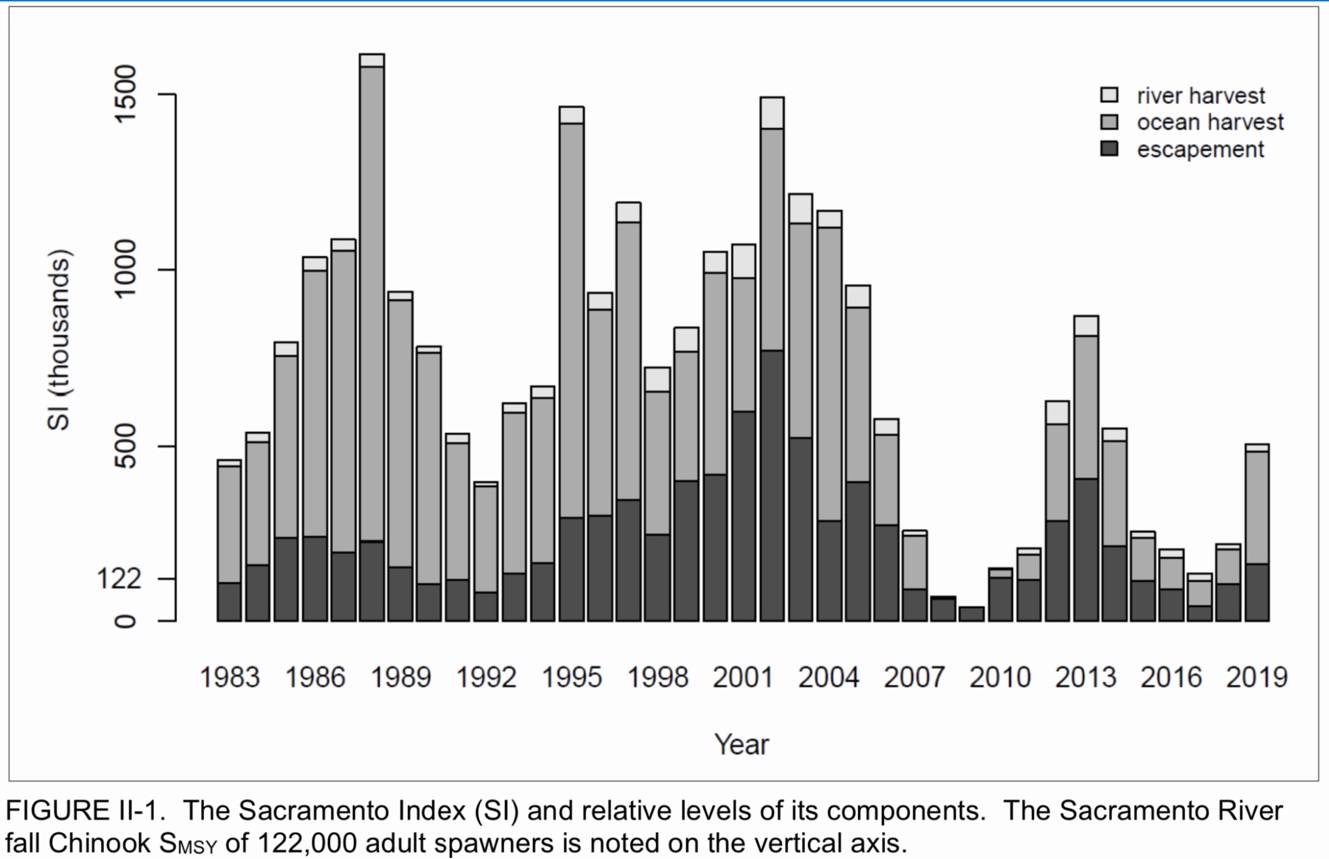
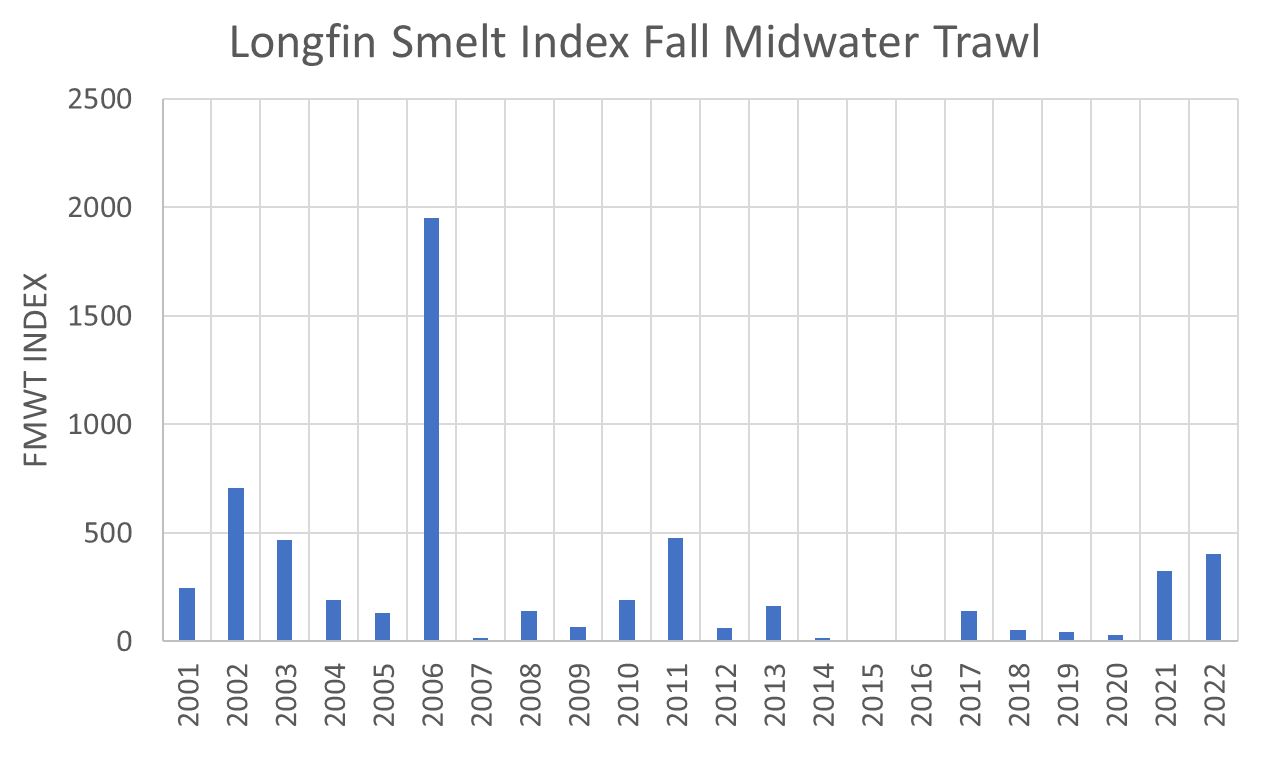
Figure 2. Note harvest in 2007 and 2015-2017 resulted in failure to meet escapement goal of 122,000 adult salmon.
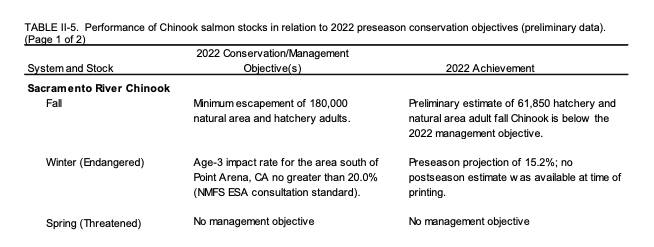
Figure 3. There was a fishery in 2022. Note 60,000 escapement for 2022 was only a third of the target goal of 180,000.