
The Bay-Delta longfin smelt population, listed as threatened under the California Endangered Species Act, is having another poor year because of the Bay-Delta habitat conditions in critically dry year 2021. Winter spawning and early rearing habitat conditions were poor due to low Delta outflow. Spring conditions have been similarly poor, with low Delta outflows and high water temperatures. Summer conditions will be even worse.
Winter
As in prior dry years, longfin spawned in the Delta in winter 2021. Their newly hatched pelagic larvae accumulated in the low salinity zone in eastern Suisun Bay close to Chipps Island near the city of Pittsburg (Figures 1 and 2). In wetter years, longfin larvae accumulate further west in western Suisun Bay and San Pablo Bay, and are also more likely to spawn in Bay tributaries, especially the Napa River. With Delta export pumps diverting about one-third of winter freshwater inflow to the Delta and Bay, significant numbers of larval longfin smelt were susceptible to being drawn into the central and south Delta, away from their low salinity zone nursery area in eastern Suisun Bay.
Spring
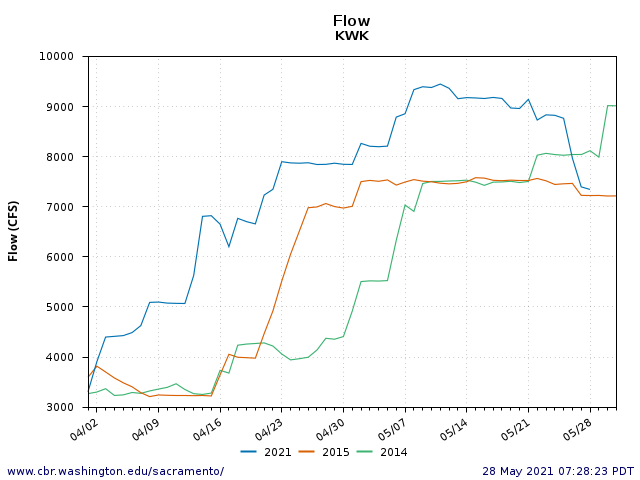
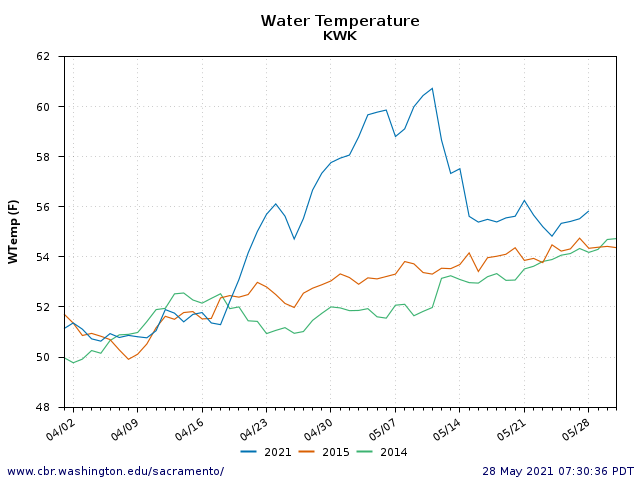
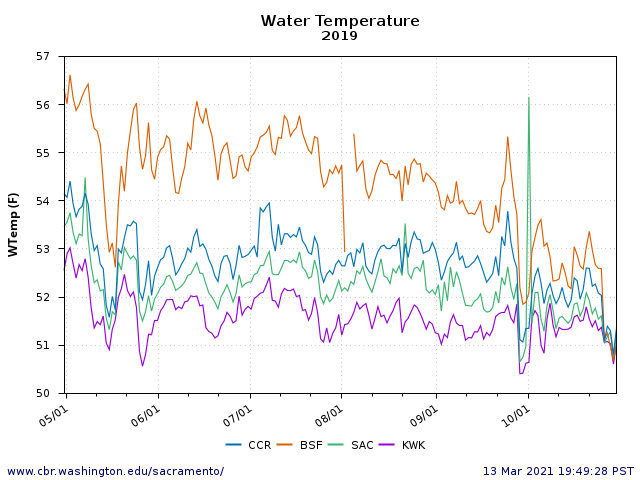
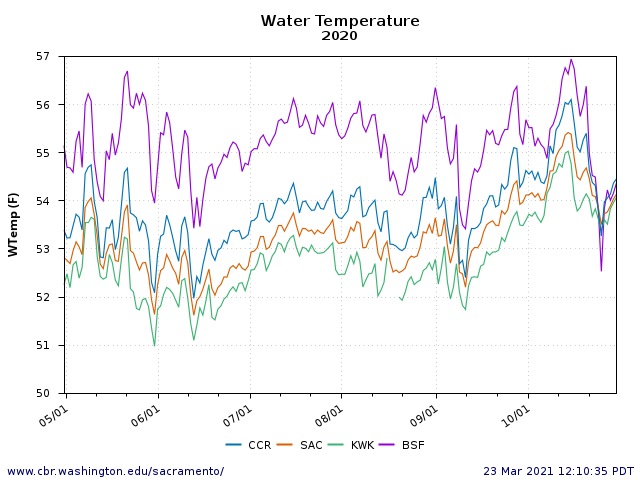
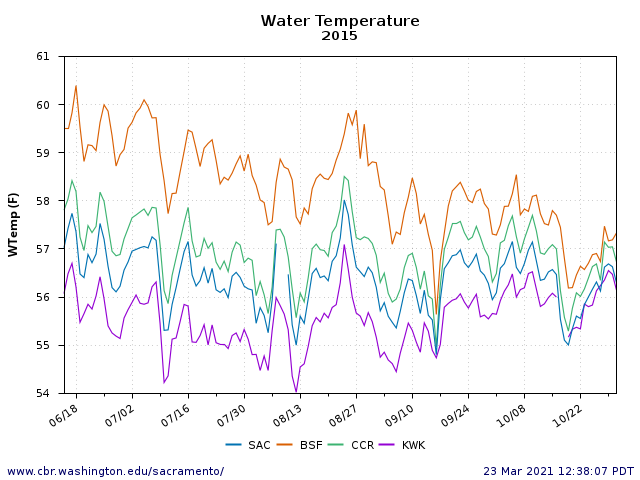
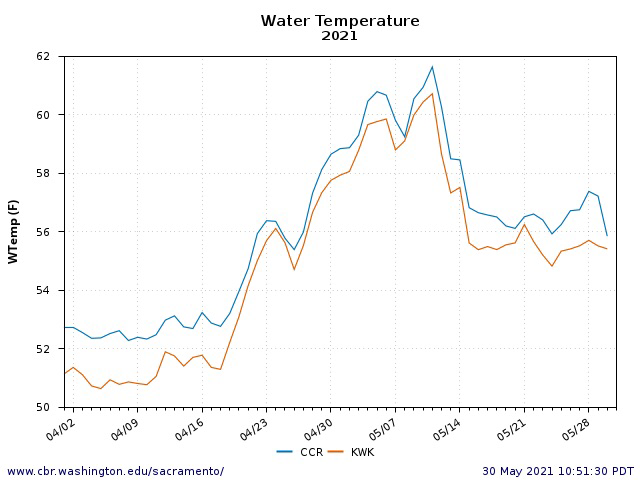
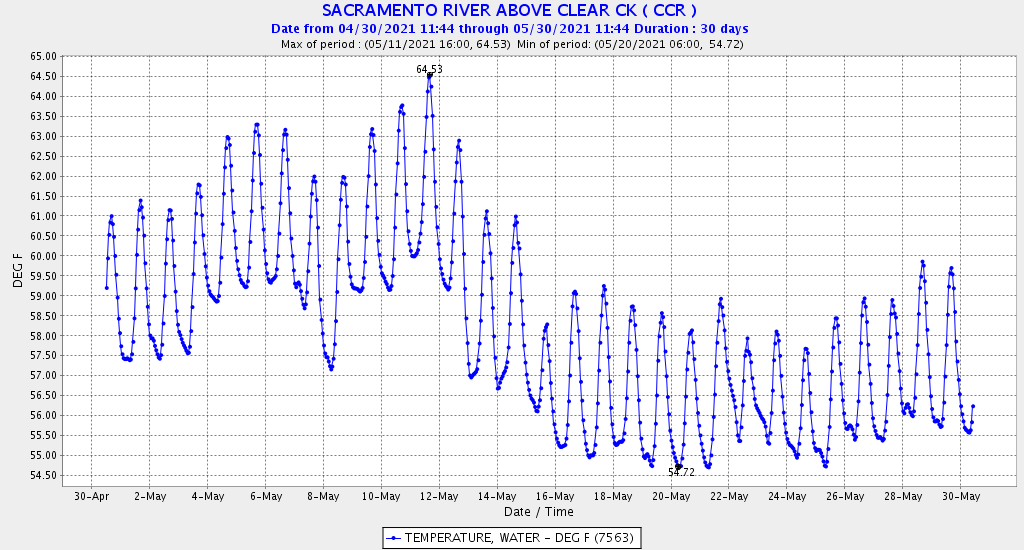
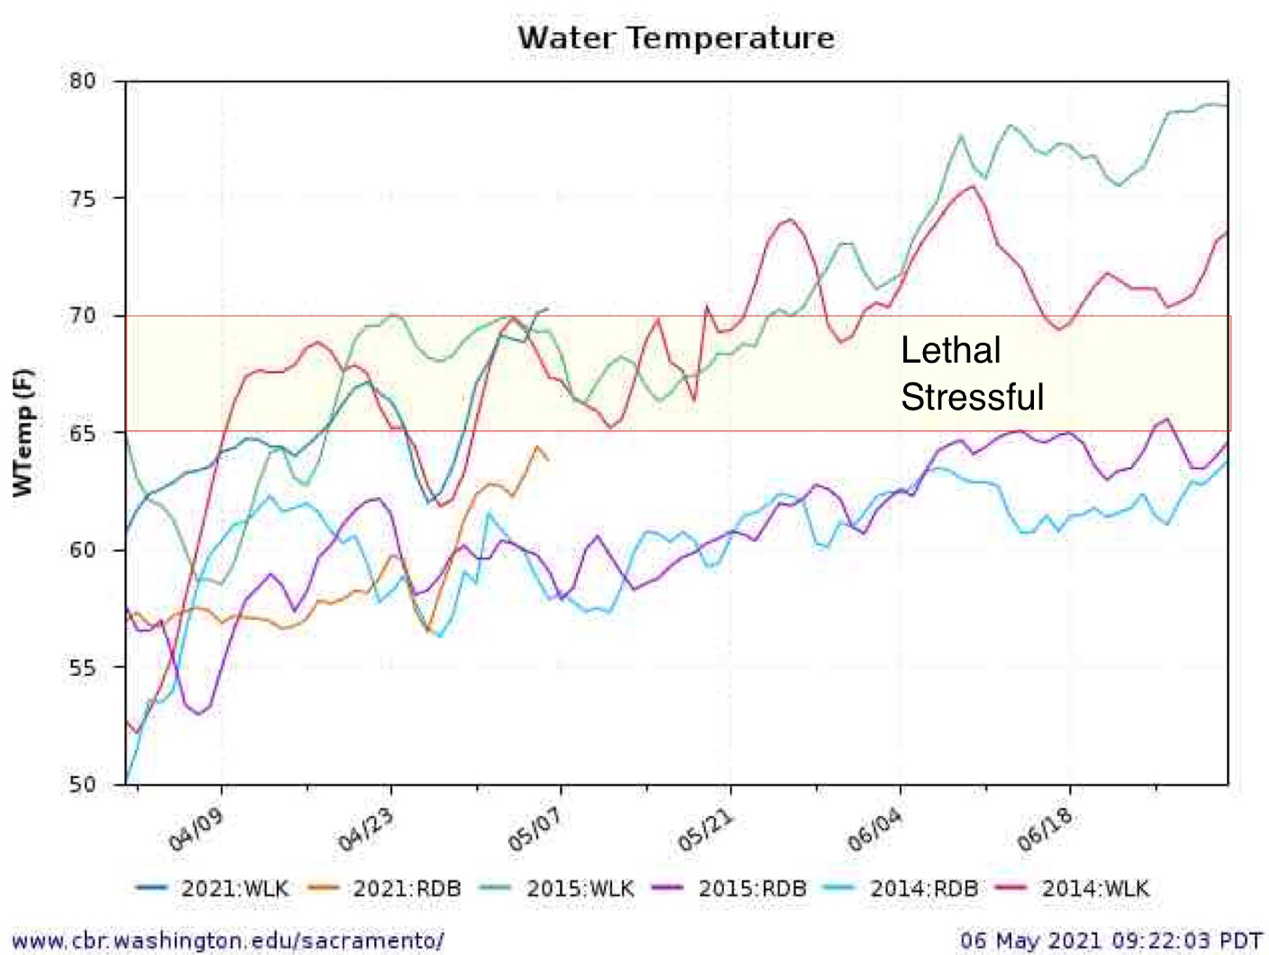
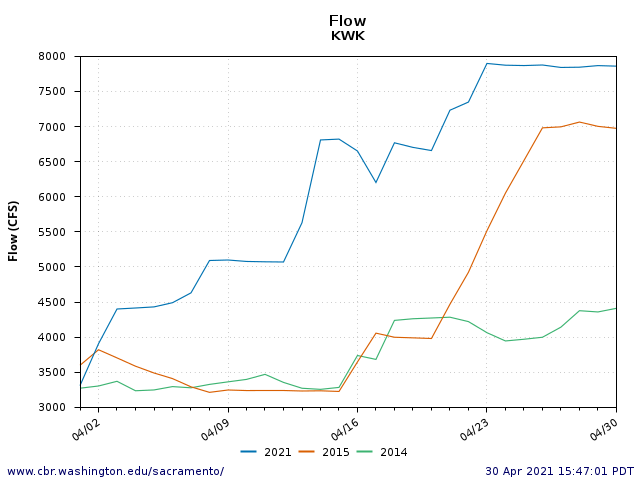
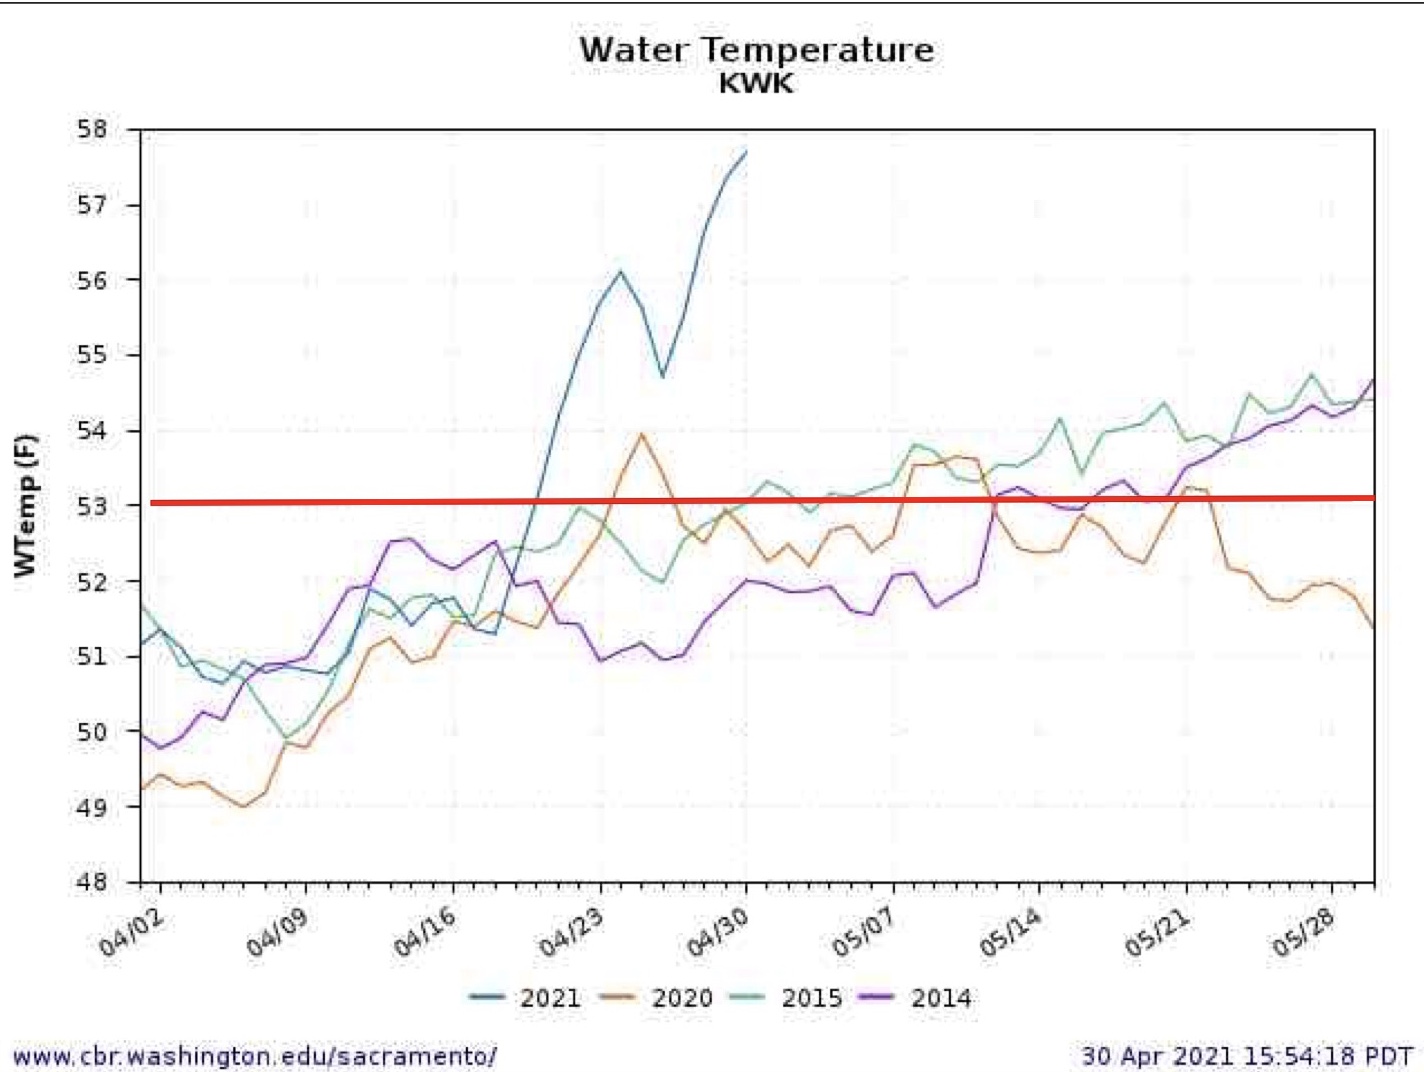
With low spring Delta outflows of 3000-6000 cfs, similar to critical drought years 2014 and 2015 (Figure 3), longfin juveniles were concentrated in the low salinity zone in the western Delta (Figure 4). In that location, they are more vulnerable to Delta exports than in the prior winter, and are also subjected to warmer water temperatures (Figure 5) detrimental to their survival (Jeffries et al. 2016).1
Summer
The prognosis for the summer is grim, given expected water temperatures over 68ºF under low flows allowed under the Temporary Urgency Change Petition (Figure 5).
Population Response
The combination of low outflow (poor habitat), vulnerability of larval and juvenile longfin smelt to export, and reduced numbers of adult spawners that have survived in recent years leads to low population recruitment (Figure 3).2
Summary and Conclusions
In a critically dry year like 2014, 2015, or 2021, Delta outflows should not fall below 6,000-8,000 cfs on a daily or tidally filtered basis (Figure 3). Such outflows keep the low salinity zone west of the Delta in Suisun Bay, where water would be cooler and longfin would be less likely to be drawn into the central and south Delta. State recovery planning for longfin smelt should also proceed as has been recommended.3
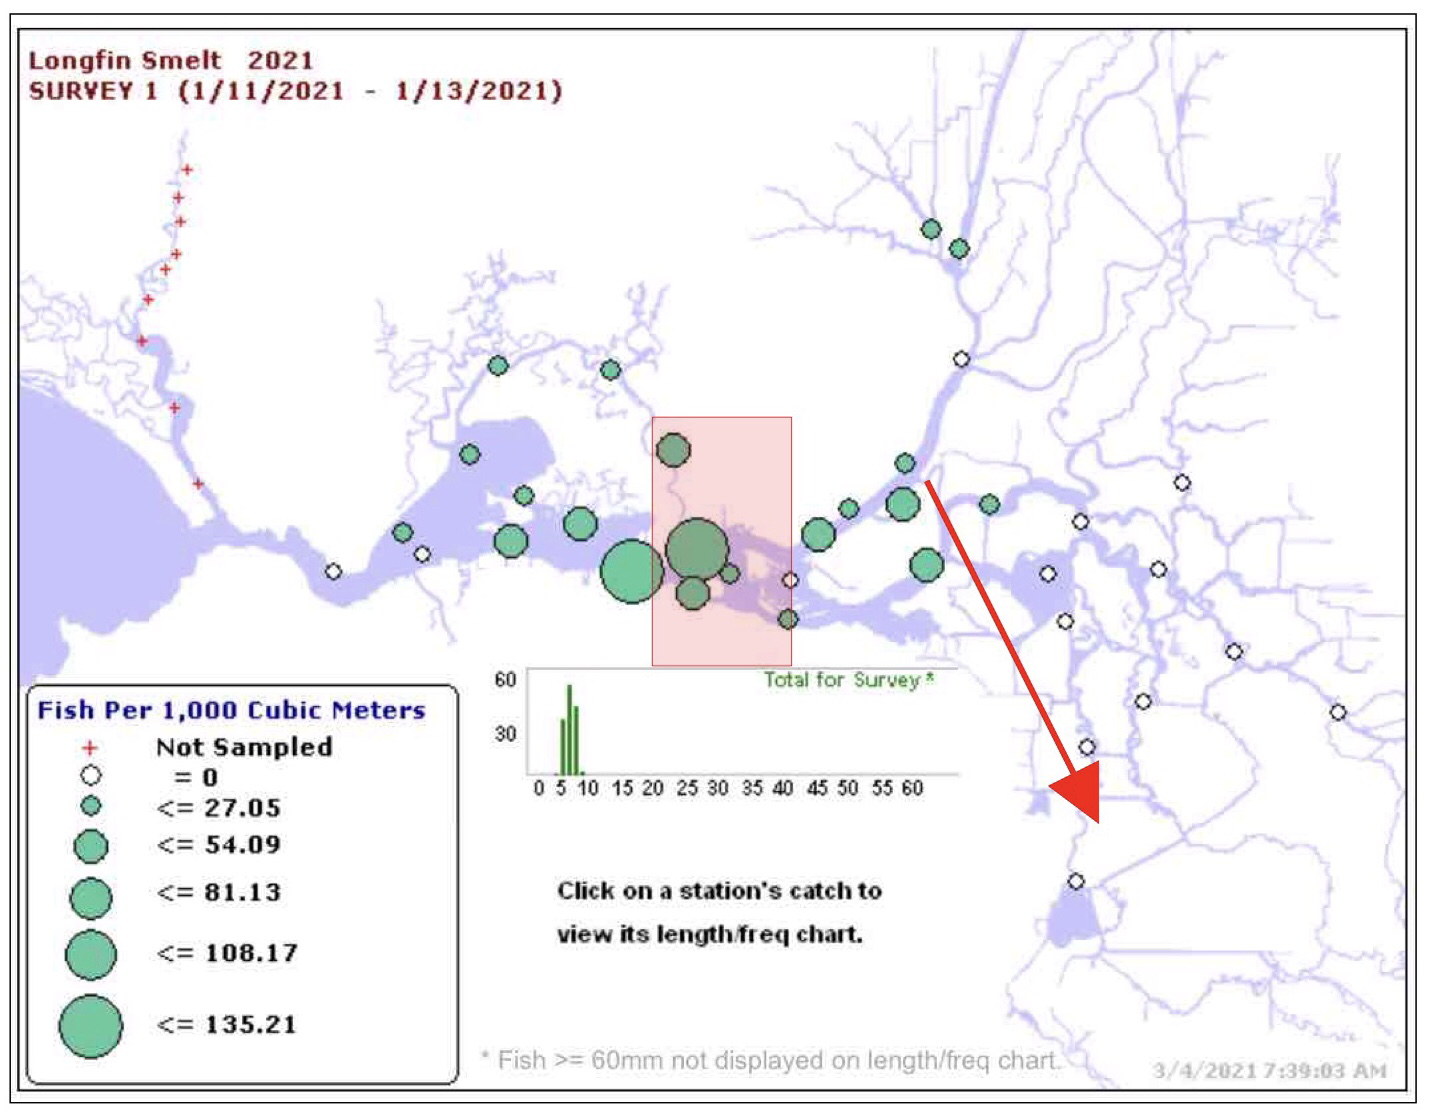
Figure 1. Catch distribution of larval longfin smelt in the mid-January 2021 larval fish survey. Red area is approximate location of low salinity zone. Red arrow is net direction of west Delta flow toward south Delta export pumps. Data Source: CDFW survey online report.
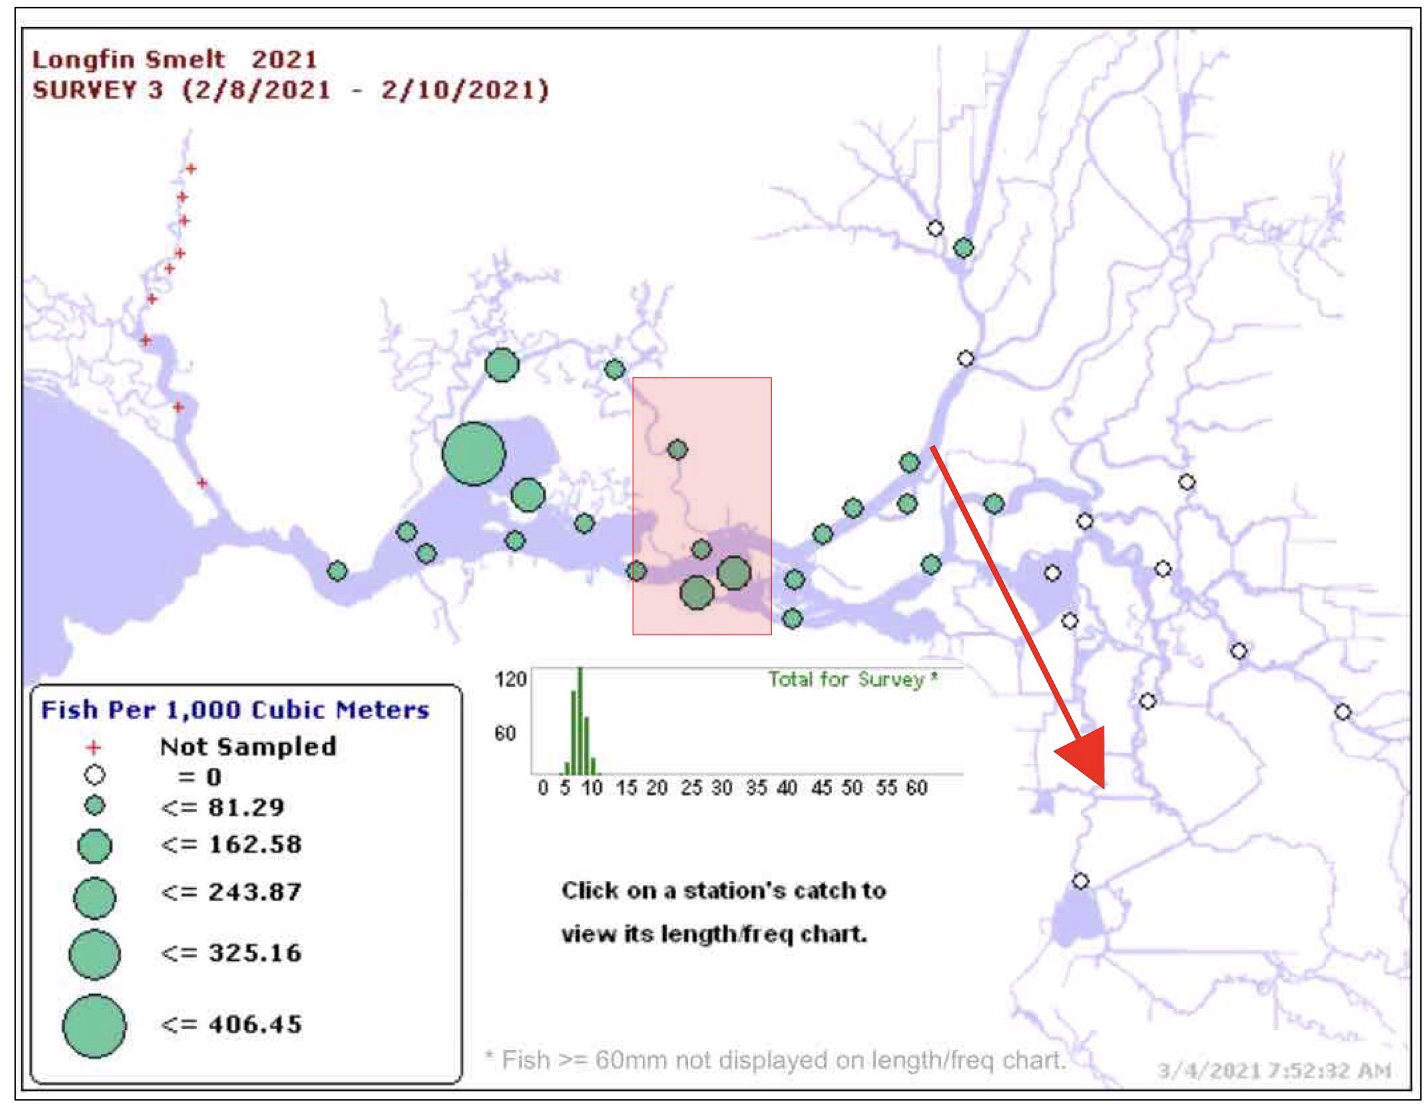
Figure 2. Catch distribution of larval longfin smelt in the February 2021 larval fish survey. Red area is approximate location of low salinity zone. Red arrow is net direction of west Delta flow toward south Delta export pumps. Data Source: CDFW survey online report.
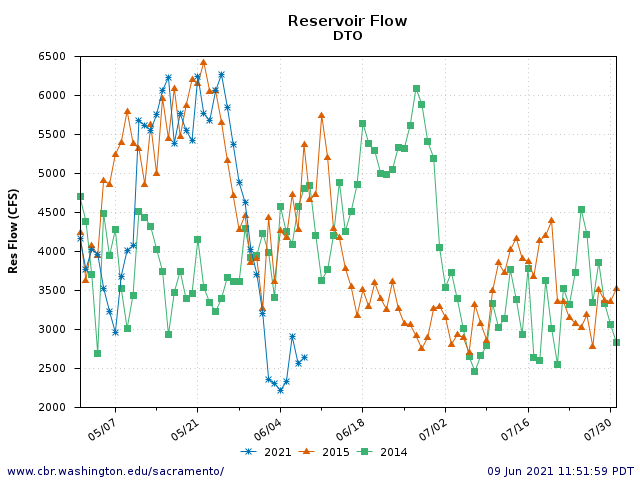
Figure 3. Delta outflow in spring and early summer 2014, 2015, and 2021. Note the sharp decline in late May 2021 (blue line) following approval of Temporary Urgency Change Petition (TUCP).
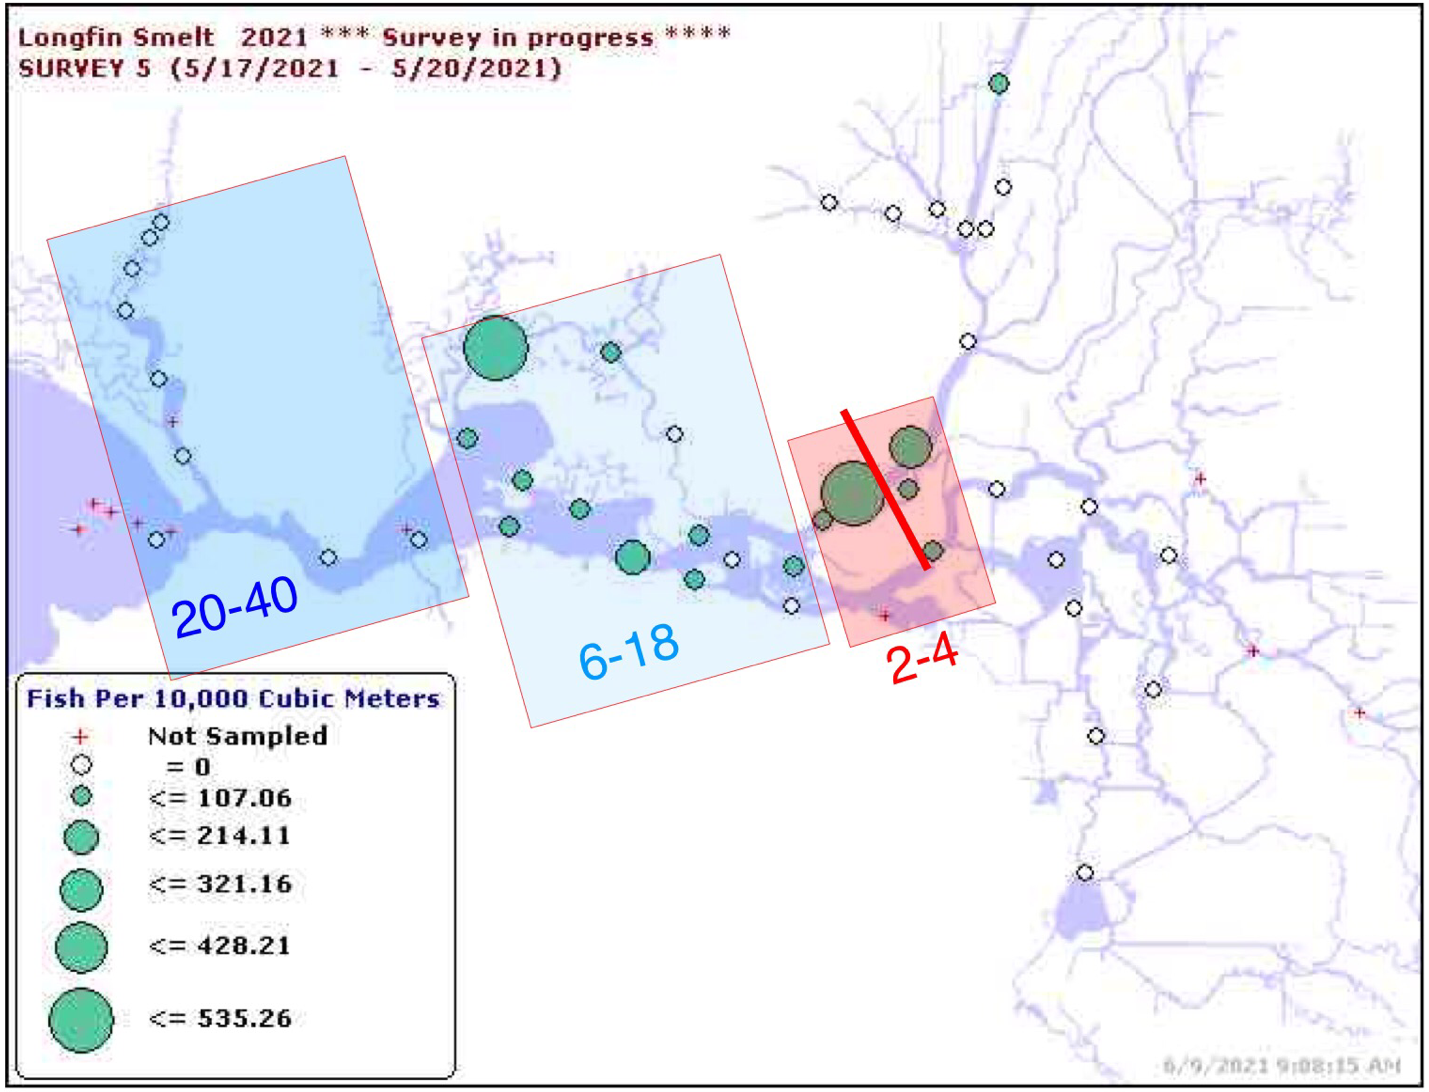
Figure 4. Catch distribution of larval longfin smelt in the May 2021 20-mm fish survey #5. Red area is approximate location of low salinity zone (2-4 EC). Blue areas are higher salinity zones in Bay. Red line is approximate location of X2. Data Source: CDFW survey online report.
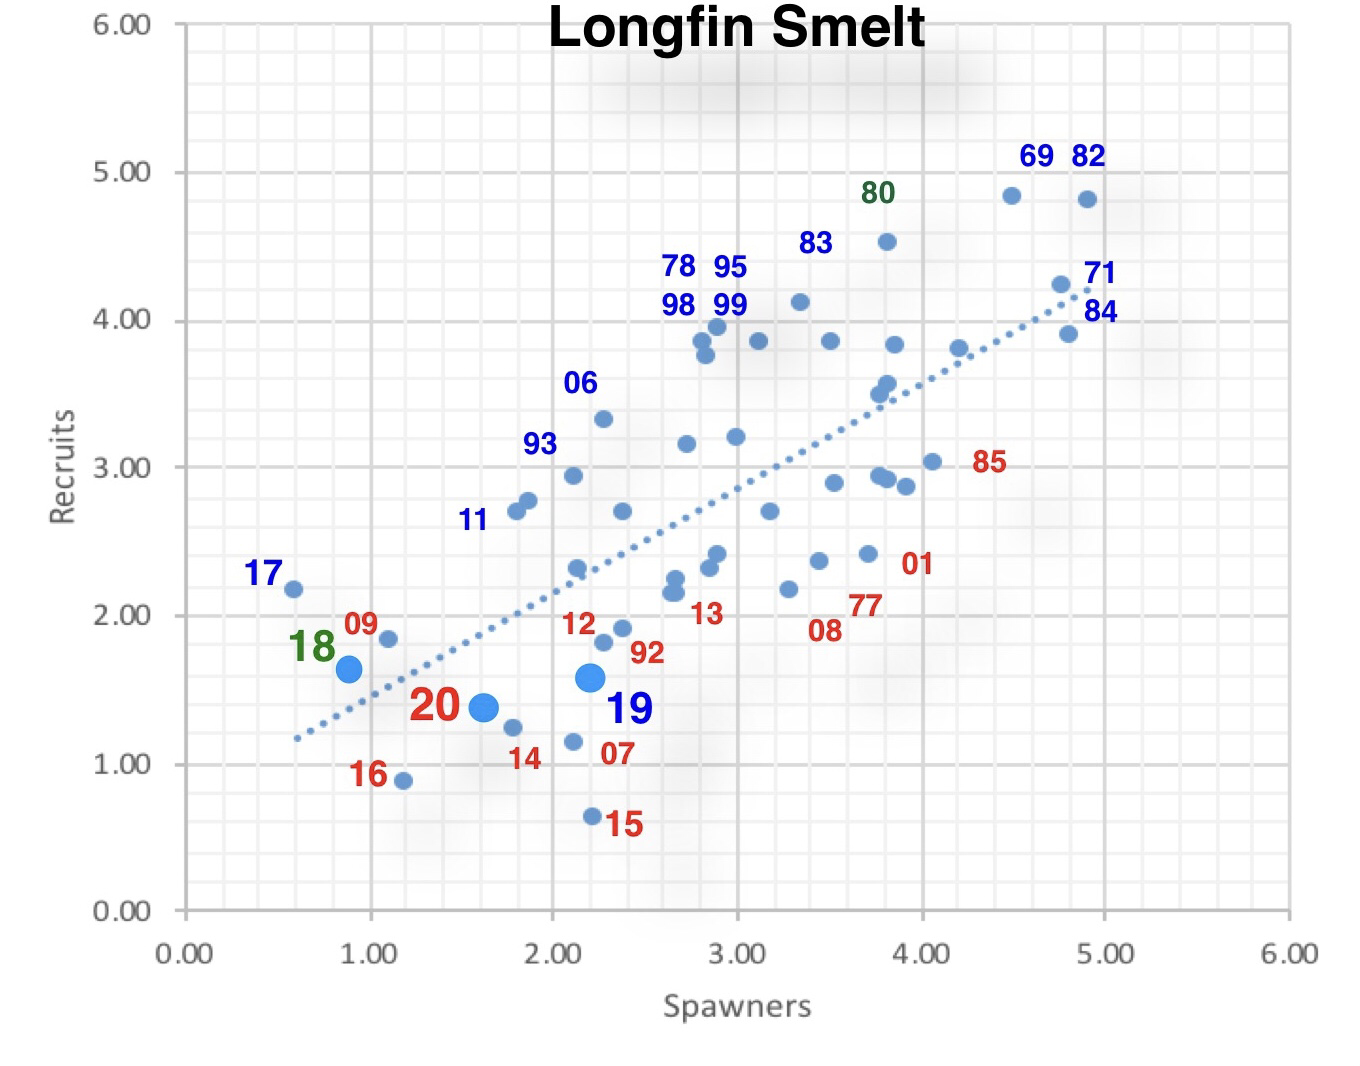
Figure 5. Longfin Recruits (Fall Midwater Trawl Index) vs Spawners (Index from two years prior) in Log10 scale by water year. The relationship is very strong and highly statistically significant. Adding Delta outflow in winter-spring as a factor makes the relationship even stronger. The 2019 brood year index was lower than expected, given the potential number of spawners (from the relatively high 2017 index) and 2019 having been a wet year. The 2020 index is as expected for a dry year, with low spawner numbers.
- “Our data suggest that chronic exposures to temperatures ≥20°C may be unsustainable for juvenile longfin smelt.”. https://journals.biologists.com/jeb/article/219/11/1705/15168/Effects-of-high-temperatures-on-threatened ↩
- https://calsport.org/fisheriesblog/?p=3456, https://calsport.org/fisheriesblog/?p=3073 ↩
- https://escholarship.org/content/qt2k06n13x/qt2k06n13x.pdf ↩
