Operation of the Central Valley Project’s Shasta-Trinity Division is governed in part by the State Water Board’s Water Right Order (WRO) 90-5. Issued in 1990, this Order prescribes reasonable protection for Sacramento River salmon, steelhead, and sturgeon even under today’s conditions. The problem in recent years is that “requirements” are not being met by the Bureau of Reclamation.
Even in the past three non-drought years, including record wet 2017 and this year’s normal classification, Reclamation has not met requirements. This has caused significant impacts to salmon, steelhead, and sturgeon, which I have documented in prior posts. In the past three years, Reclamation has used its poor performance during the 2013-2015 drought and global warming as excuses to prioritize preserving water storage in Lake Shasta over meeting water temperature requirements for the Sacramento River under WRO 90-5. But while Reclamation has argued it must preserve Shasta Reservoir’s cold-water pool, Reclamation has maintained full deliveries to its Sacramento Valley contractors.
The State Board has a whole website dealing with the issue and problems dealing with Reclamation on the issue: (https://www.waterboards.ca.gov/waterrights/water_issues/programs/drought/sacramento_river/ ).
In a March 14, 2018 letter to Reclamation, the State Board’s Deputy Director for Water Rights wrote to Reclamation on compliance with WRO 90-5,1 stating:
As you know, Order 90-5 requires Reclamation to maintain a daily average temperature (DAT) of 56 degrees Fahrenheit (F) in the Sacramento River at Red Bluff Diversion Dam during times when higher temperatures will be detrimental to fish, unless factors beyond Reclamation’s reasonable control prevent it from maintaining such temperatures. If Reclamation is unable to meet the temperature requirement at Red Bluff Diversion Dam throughout the temperature control season, Reclamation must develop an operations plan for approval by the Chief of the State Water Board’s Division of Water Rights (Deputy Director). The plan, which is required to be developed in consultation with the California Department of Fish and Wildlife, U.S. Fish and Wildlife Service, National Marine Fisheries Service (NMFS) (collectively fisheries agencies), and the U.S. Western Area Power Administration (WAPA), must designate a location upstream of Red Bluff Diversion Dam where the temperature requirement will be met. Order 90-5 includes specific monitoring and reporting requirements in addition to a general requirement (Condition 3) that Reclamation conduct such monitoring and reporting as is required by the Deputy Director to ensure compliance with the terms and conditions of Order 90-5.
Given potential concerns with temperature management this year and the degraded status of the winter-run Chinook salmon population following the drought, Reclamation should be aware that operational changes may be needed beyond those proposed by Reclamation in their TMP to minimize impacts to winter-run Chinook salmon and avoid redirected impacts to other native species. Reclamation should acknowledge those needs in its TMP and provide for a process for continually evaluating conditions and operations to ensure that needed adjustments to temperature control operations are considered in a timely manner.
On April 2, 2018, Reclamation responded2:
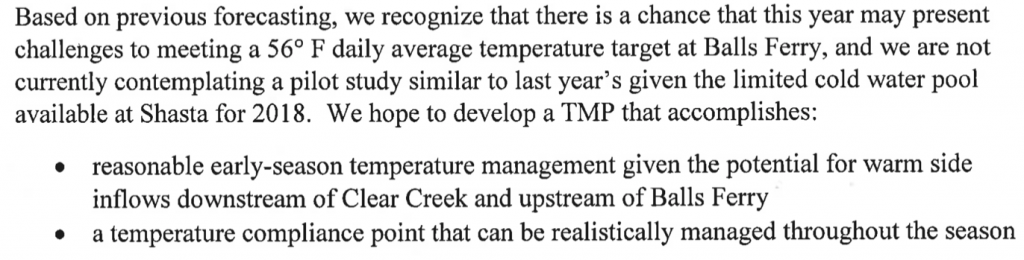
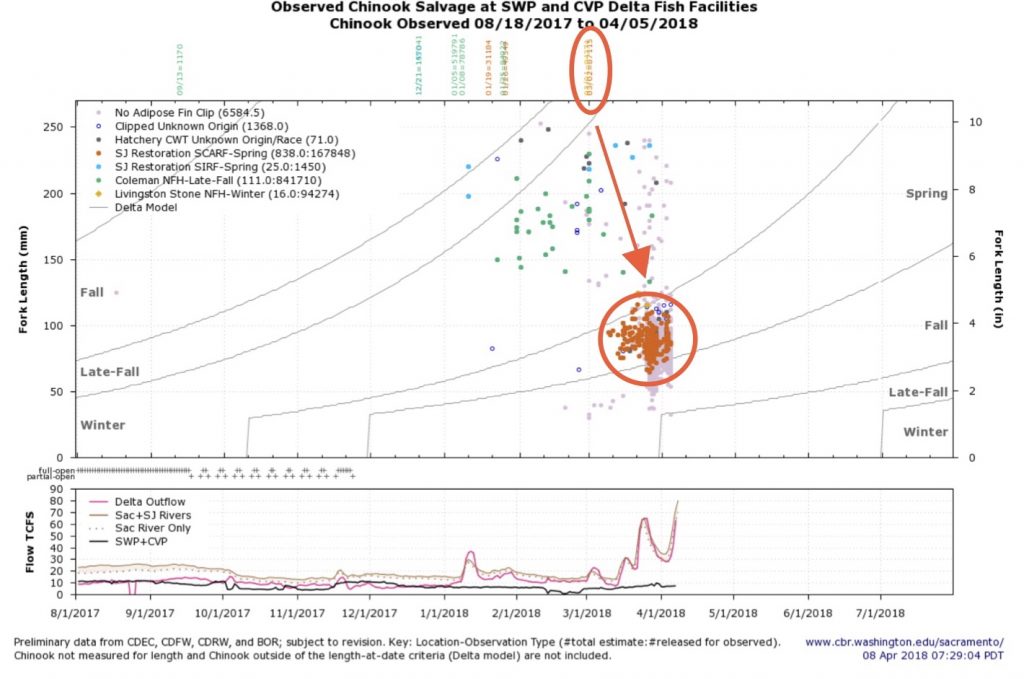
This response not only states that Reclamation will not meet WRO 90-5 water temperature requirements at Red Bluff (river mile 243), but also that it will not meet these requirements at Balls Ferry (river mile 276), 30 miles upstream and half way to Keswick Dam. In fact, Reclamation to date has blatantly kept the promise of not meeting requirements (Figure 1), despite the fact that Shasta Reservoir is full of cold water. It is not even May yet!
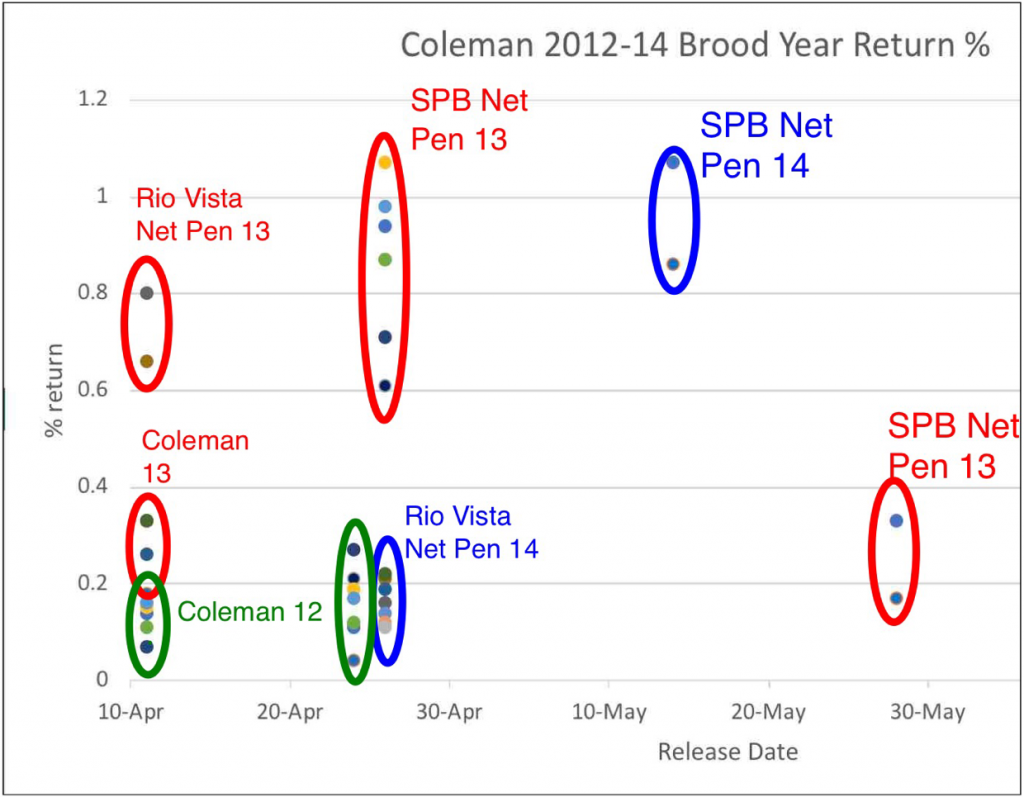
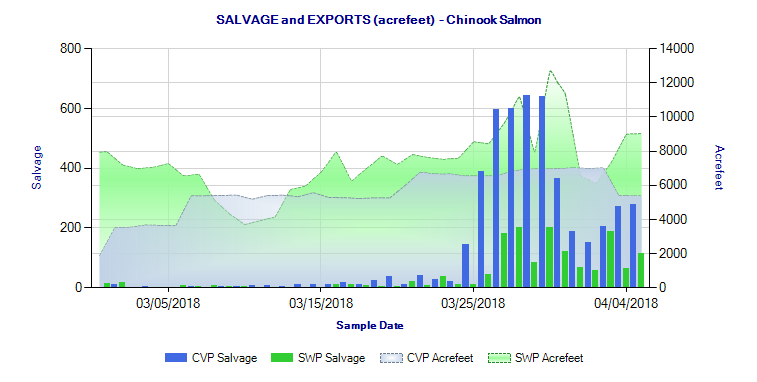
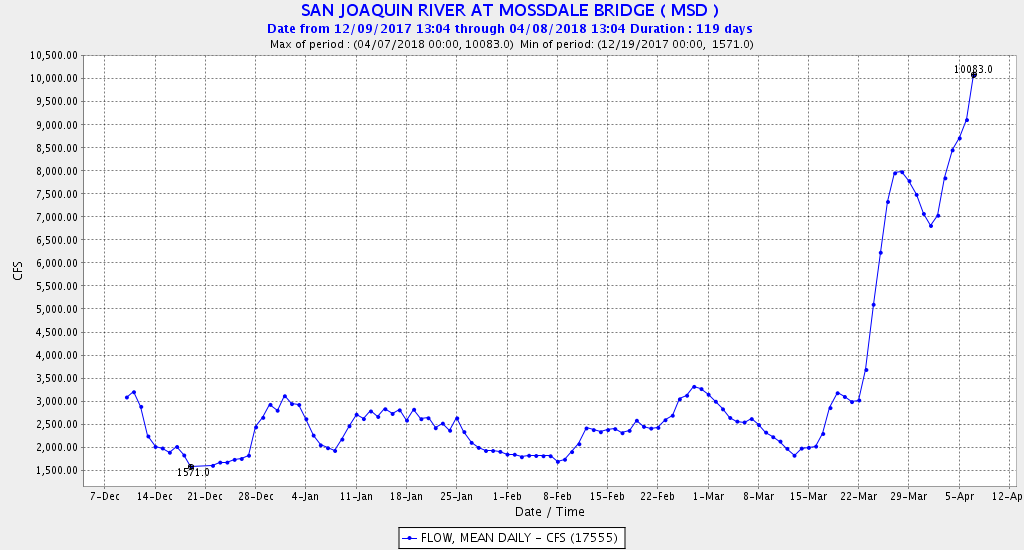
The Coleman Fish Hatchery just stocked 4 million fall-run salmon hatchery smolts at Battle Creek upstream of Red Bluff, with another 2 million soon to follow.3 The recently released hatchery fish (and their wild counterparts) are being subjected to highly stressful conditions in their 200-mile journey to San Francisco Bay (Figures 2 and 3).
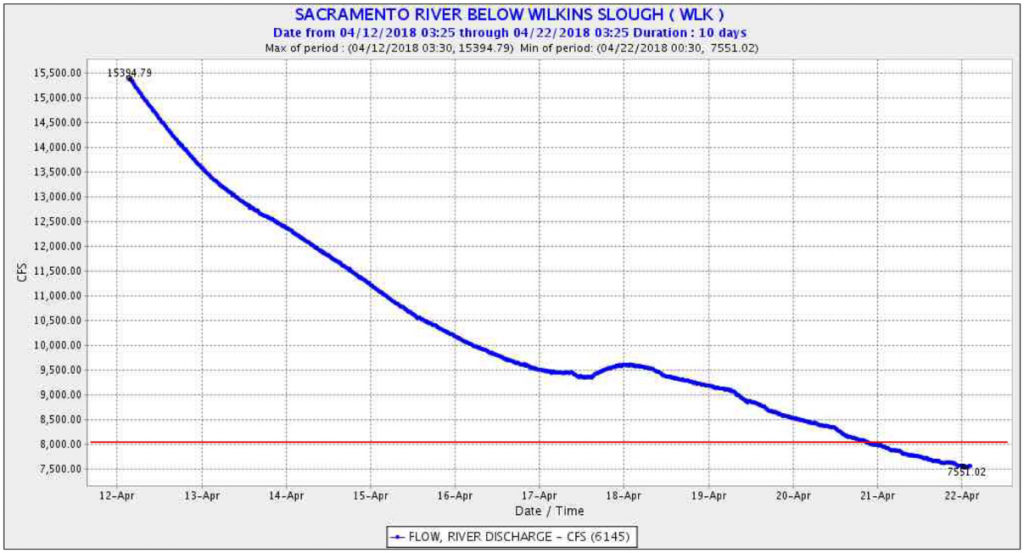
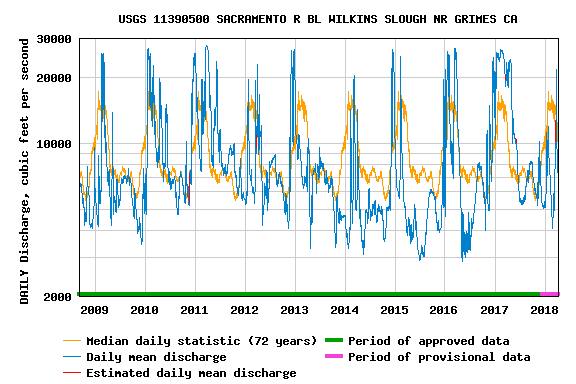
There is plenty of cold water in Shasta Reservoir (Figures 4 and 5) to meet the flow and temperature needs of salmon in the lower Sacramento River through the summer, as required by WRO 90-5. It would take a total release of about 6000 cfs from Shasta to meet WRO 90-5 requirements at this time just at Balls Ferry. Reclamation increased releases in the past several days to 5300 cfs to meet water contractor demands. The problem remains that this water is not reaching the lower river, where water temperatures now hit 70°F and exceed the WRO 90-5 limits of 68°F (Figure 3). It will take an added 2000-3000 cfs at Wilkins Slough to keep the lower river below its 68°F limit This added release would represent about one foot of Shasta Reservoir water-surface elevation per week (Figure 4).
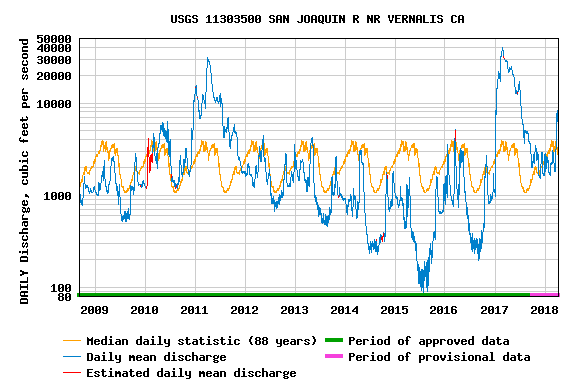
Sacramento Valley contractors have been given a 100% water allocation. South of Delta San Joaquin CVP contractors have been allocated only 40%. Reclamation is fully capable of meeting WRO 90-5 requirements, as it did historically. It is up to the State Board to enforce the CVP permit requirements. Given the state of the salmon populations, there should be no compromise on the permit requirements.
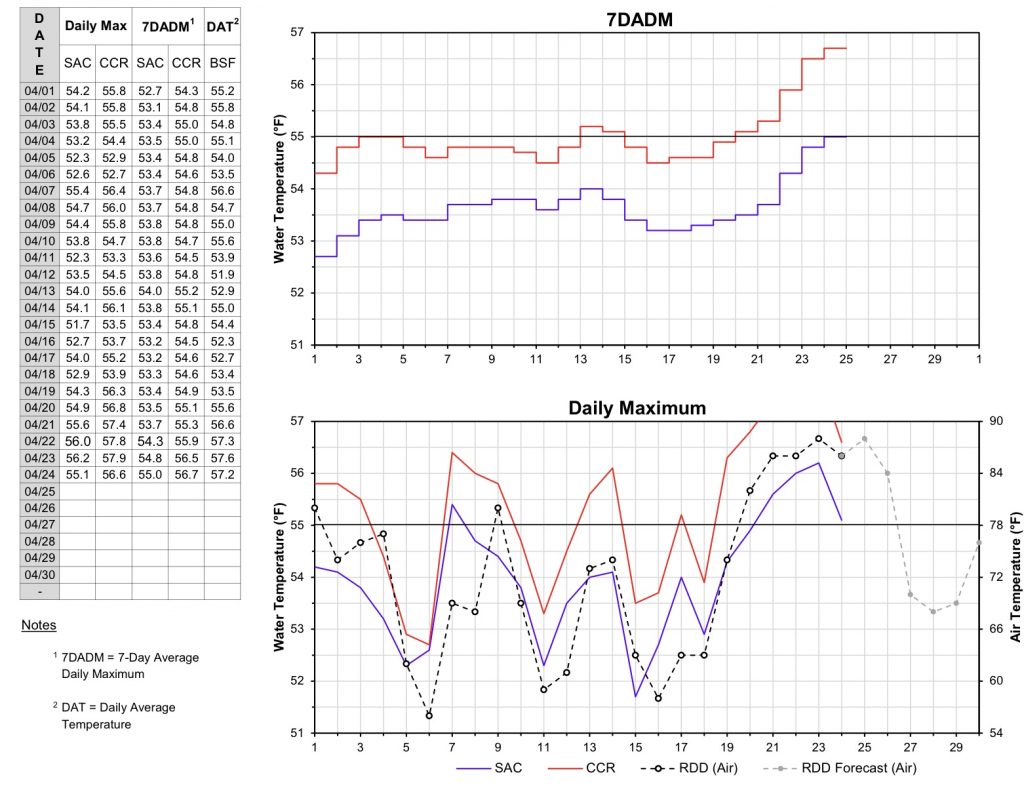
Figure 1. Reclamation report on Sacramento River temperatures through 24 April, 2018. Source: https://www.usbr.gov/mp/cvo/vungvari/sactemprpt.pdf
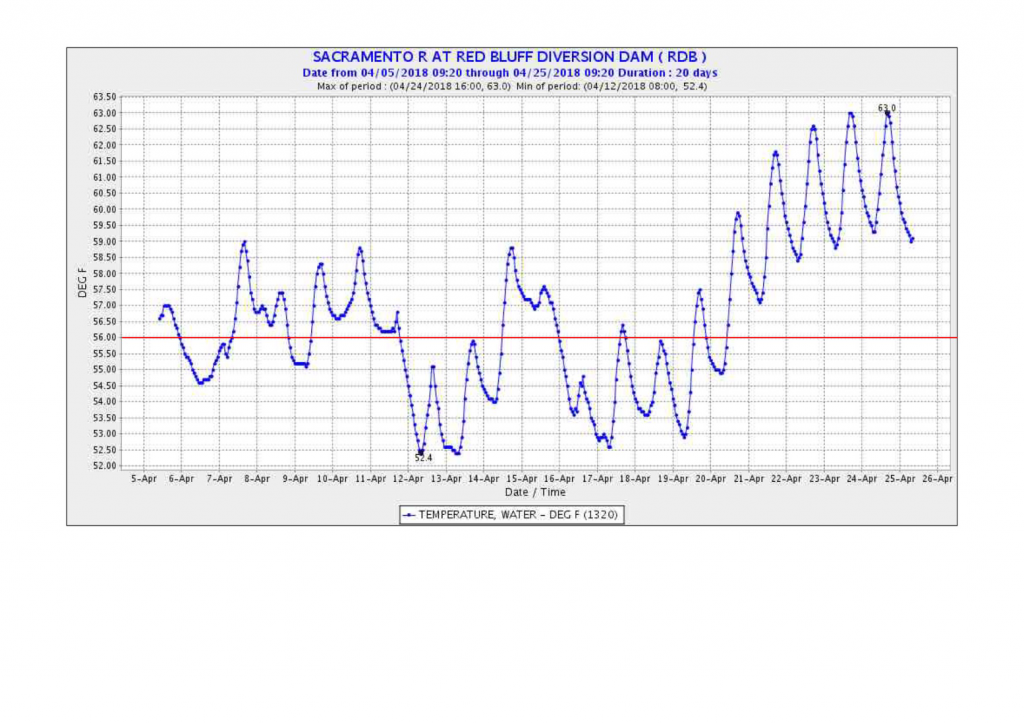
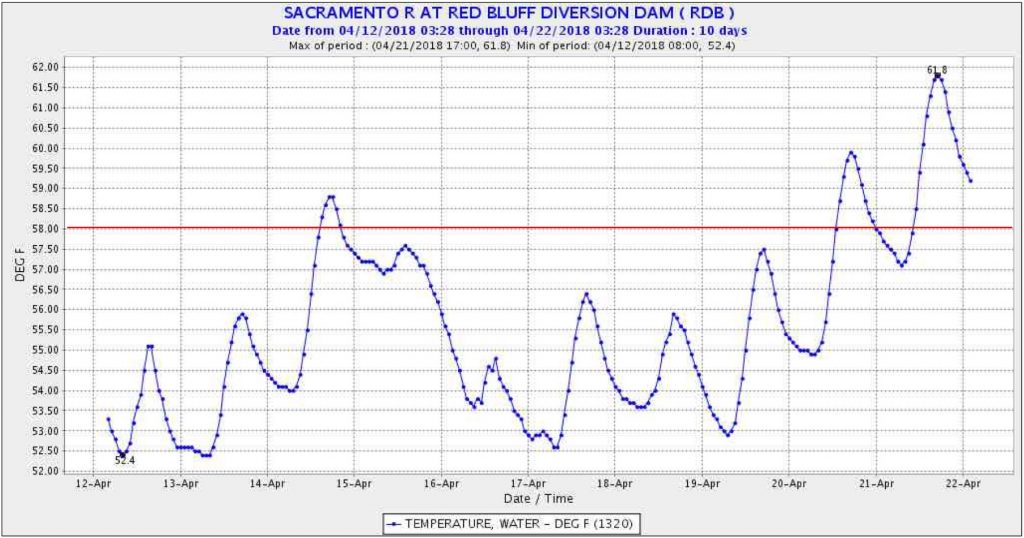
Figure 2. Water temperature at Red Bluff (RM 243), April 2018. Red line is limit requirement in WRO 90-5. Source: cdec.
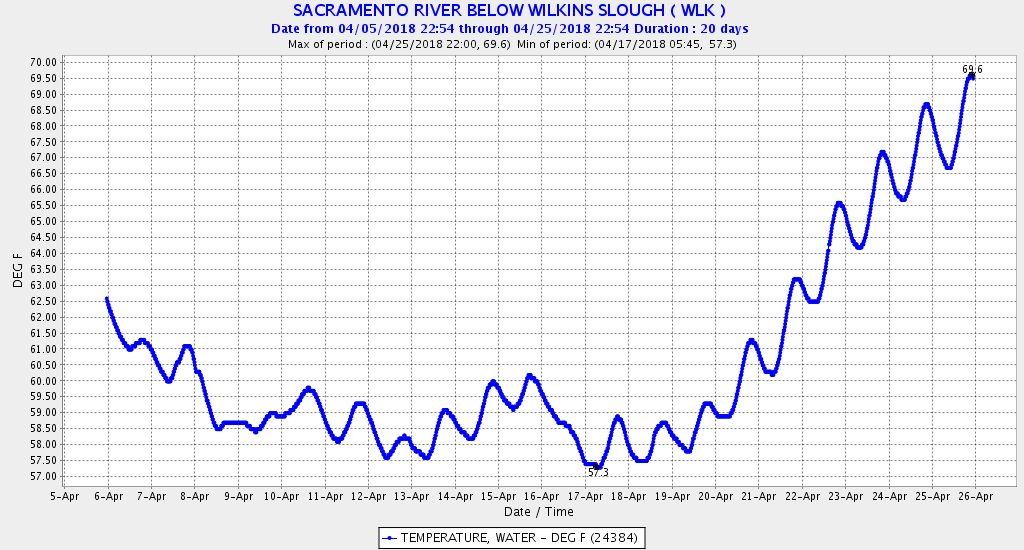
Figure 3. Water temperature at Wilkins Slough (RM 118) April 2018. WRO 90-5 limit is 68°F. Water temperatures in excess of 65°F are highly stressful to juvenile salmon. Source: cdec.
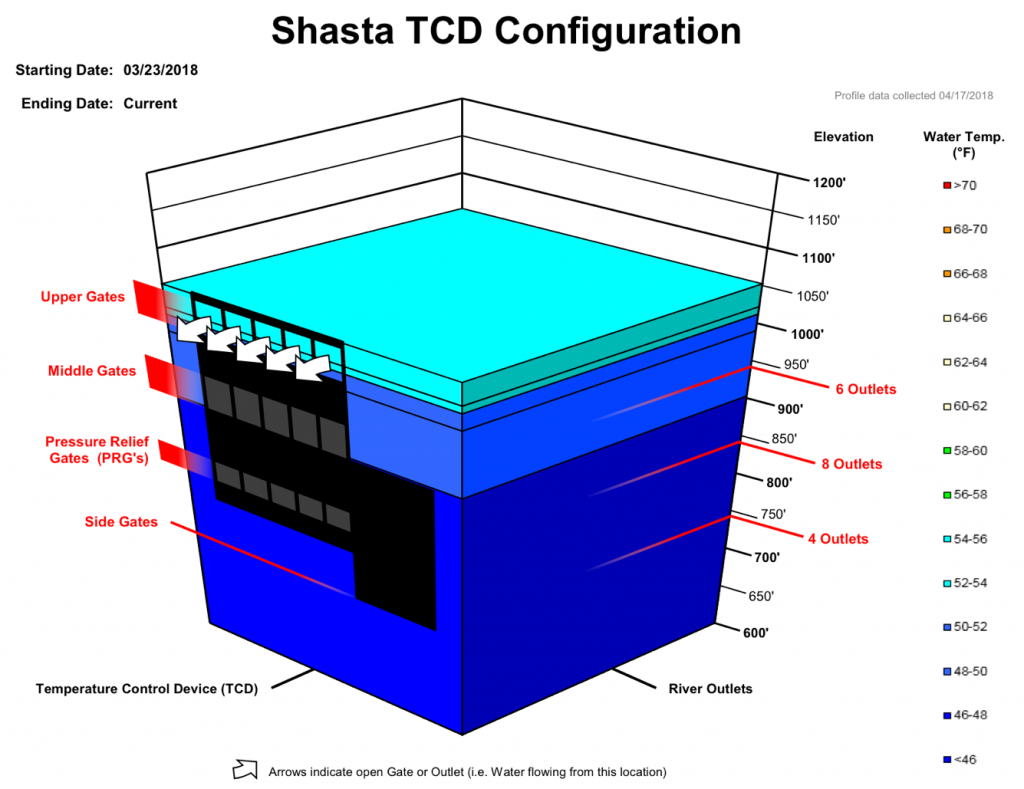
Figure 4. Shasta storage characterization for water at the dam’s temperature control device (TCD), March 23 – April 22, 2018. Source: https://www.usbr.gov/mp/cvo/vungvari/ShastaTCD2018.pdf (See link for updates.)
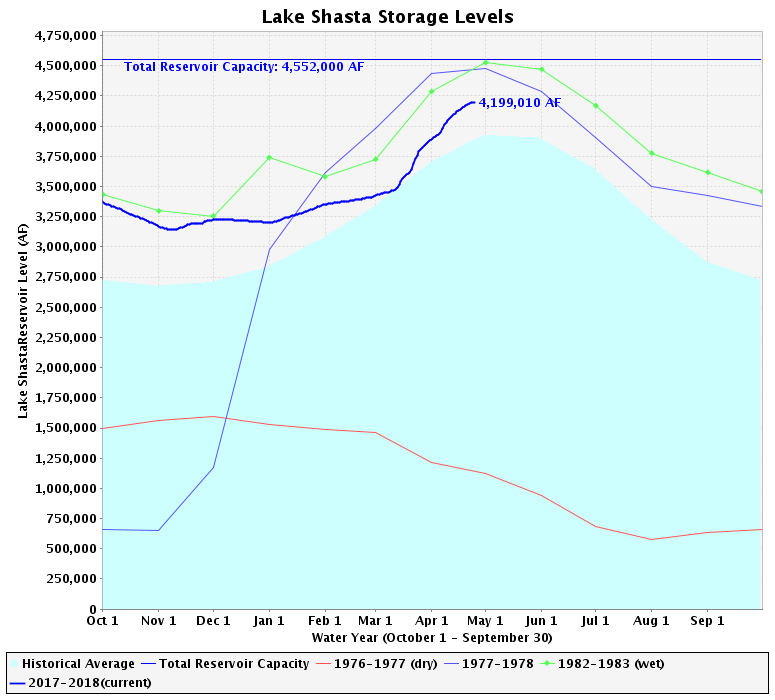
Figure 5. Shasta Reservoir storage as of April 24, 2018.
Source: http://cdec.water.ca.gov/resapp/ResDetail?resid=SHA
- https://www.waterboards.ca.gov/waterrights/water_issues/programs/drought/sacramento_river/docs/2018/03142018_sac_temp_plan_ltr.pdf ↩
- https://www.waterboards.ca.gov/waterrights/water_issues/programs/drought/sacramento_river/docs/2018/04022018response_90_5.pdf ↩
- Note that Coleman Fish Hatchery on Battle Creek normally stocks 12 million fall-run smolts, but brood year 2014 salmon did not provide sufficient spawners (eggs for hatchery), and the hatchery thus produced only 6 million smolts in 2017. Hopefully, the 2 million smolts that have not yet been released will be trucked to the Bay. ↩