Another biological problem with the Twin-Tunnels’ intakes: Like gigantic vacuum cleaners, the flow pulled through the river intakes will likely suck baby salmon up against the fish screens (called “impingement”). To minimize this problem, low through-screen water velocities (also called approach velocities) are necessary to hopefully prevent young salmon from encountering physical, injurious contact with fish screens. The WaterFix proponents “promise” to keep those velocities low. The biological problem with this premise is that juvenile salmon are weak swimmers on a sustained basis and cannot tolerate swimming against approach velocities through the screens for long periods. When naturally migrating downstream, the small fish essentially “go with the flow” and do not aggressively fight against the current, except in unavoidable desperation (see: Struggling Salmon). To avoid impingement, the salmon suddenly have to fight against the flow entering the WaterFix intakes. The small salmon can only combat the currents for short periods until fatigue sets in and eventually succumb to the water flowing into the screens.
In the not-so-distant past, to minimize this fish impingement problem, a federal criterion mandated that young salmon should not be exposed to fish screens for more than 60 seconds, even with low approach velocities. The biological concept is to move salmon very quickly past the screens before the fish surrender to the through-screen velocities, come into contact with the screens, and eventually die from abrasions and physical injury. With large, long screens, this poses a very serious predicament. In case of the Twin-Tunnels’ screens, it will not be possible to get the salmon away from the screens in less than a minute because of the large surface area and great length necessary to keep the through-screen velocities low while simultaneously maintaining high water diversion rates. The salmon can only escape if swept by the long screens extremely fast. In this regard, the Twin-Tunnels’ fish screens will perform miserably. Because of the poor locations of the intakes discussed in the first of this series, salmon will be exposed to the proposed screens for long periods because of severely low sweeping flows. Analyses conducted for the project revealed that young salmon could be exposed to each of the three individual WaterFix screens for an astounding one-hour period (not a typo) … not exactly the original 60 seconds criterion mentioned above.
Additionally, it will not be possible to maintain uniform through-screen velocities along the entire length for each of the three screens. Therefore, WaterFix proposes to install “flow-control baffles” directly behind the screens. These would typify tall vertical Venetian blinds (Figure 1). The WaterFix idea is that if too much flow (and therefore unacceptably high through-screen water velocities) occurs in a particular area (“hot spots”), the baffles would be pinched down to restrict flow entering that particular area of the screens. The problem, in reality, is this proposed engineering solution will be like chasing ghosts. As river flows and diversions change dramatically, the through-screen velocities and complex secondary currents will also change significantly over the entire area of the fish screens. Tweak the baffles upstream, then it’s time to adjust the baffles downstream, and so on. Once done, everything changes hydraulically and you have to start all over again … a never-ending battle of futile attempts to achieve the fairytale of flow uniformity over the entire screen face under all river and water diversion conditions. Whew! I would not want to be the poor workers chasing back and forth over the combined ¾ of a mile of fish screens constantly tweaking baffles 24 hours a day, 7 days a week when water is being diverted into the Twin Tunnels.
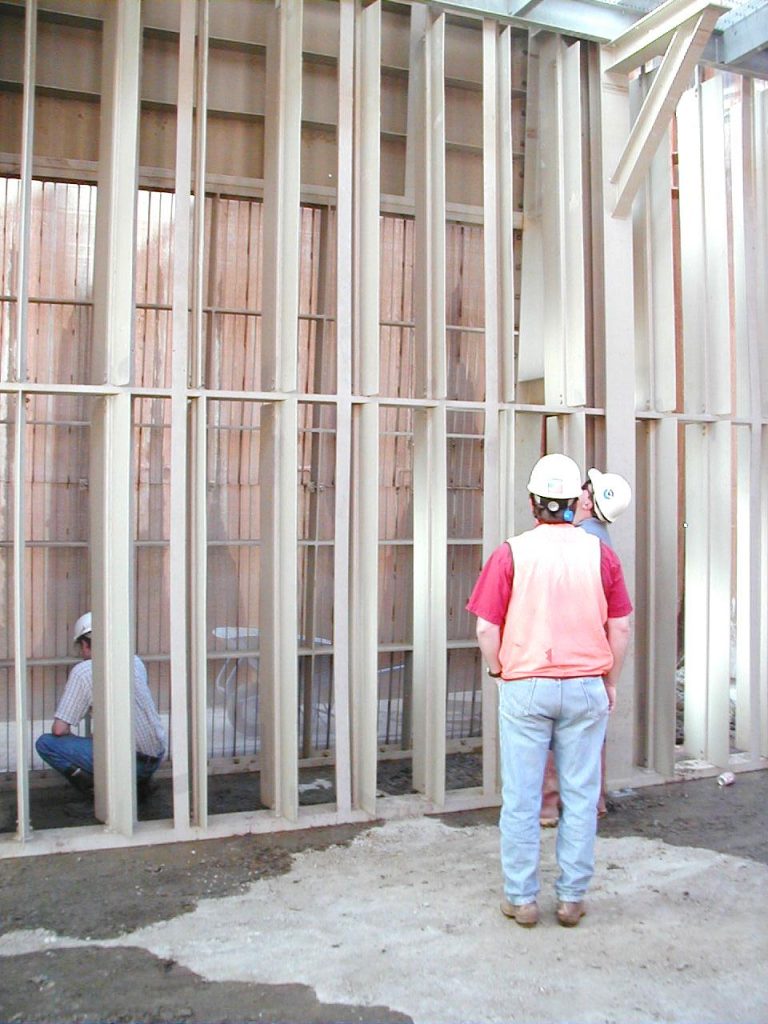
Figure 1. Picture of flow-control baffles in the open position (foreground) and flat-plate screens in the background. Entire structure dewatered during construction. Picture by Dave Vogel.
Unlike agricultural diversions in upstream areas that primarily divert water during the spring, summer, and fall, the Twin-Tunnels’ intakes will be diverting water over the winter season under high-flow conditions. Unfortunately, this will undoubtedly cause unavoidable massive debris loading on the screens. In attempts to deal with the plugged screen openings caused by debris, enormous vertical “wiper blades” will be in continuous operation going back and forth against the screen surfaces. Envision giant tooth brushes constantly scrubbing in a futile attempt to stop the persistent “plaque” build-up (Figure 2). Some existing smaller flat-plate screens used in upstream areas (where debris loading is far less and sweeping flows are very high) have successfully employed such wiper blades, but those situations are far different than envisioned with the proposed Twin-Tunnels’ intakes during the winter. The Twin-Tunnels’ unfortunate reality is that with the poor sweeping flows, it will be extremely difficult, if not impossible, to get rid of the debris. And where will it go? The detritus will merely drift downstream and continue to plug the next screen panel, then the next, etc., etc. The increased debris loading during high river flows is likely to be enormous1, overwhelming the wiper blades … WaterFix has not adequately addressed this dilemma. And … for those hapless, fatigued young salmon struggling against or impinged on the screens when the robotic wiper blades bear down on the fish under the cover of darkness and muddy water? … Squish.
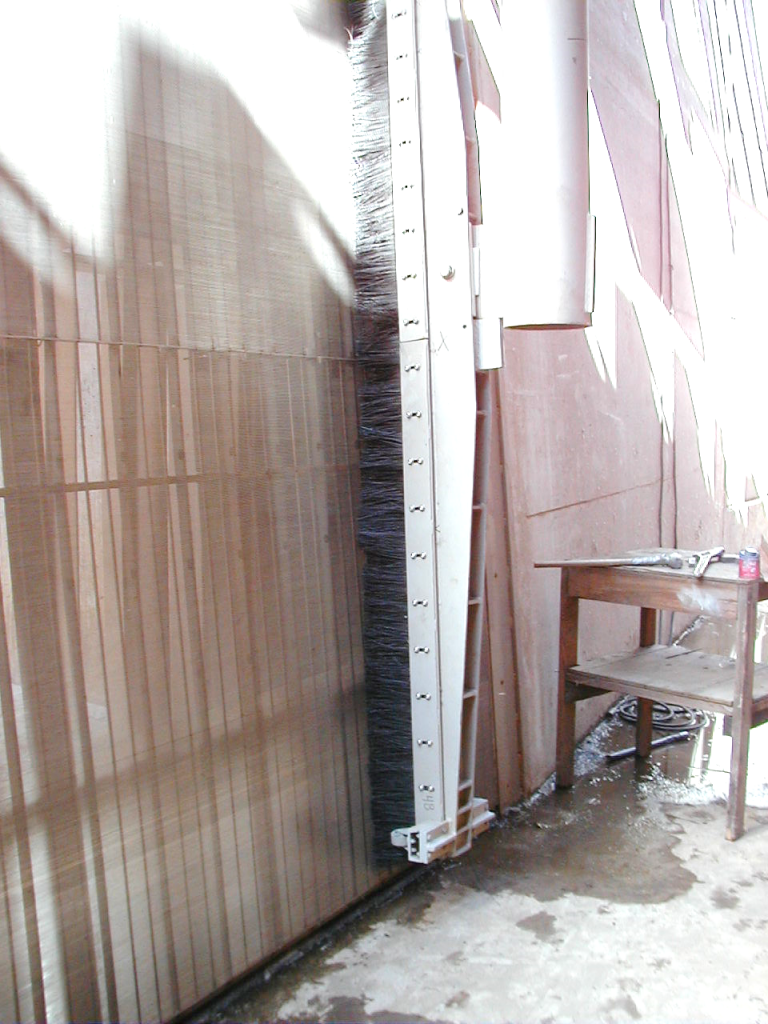
Figure 2. Picture of a flat-plate screen wiper blade. Entire structure dewatered during construction. Picture by Dave Vogel.
Next in the series: The myth of the Twin-Tunnels’ salmon “motels”.
- E.g, see pages 133 – 134 “Working Conditions in the Field” in Lufkin (ed.) (1990) ↩