Spring-Run Chinook Salmon – why they fail to recover

Spring-run are the most prized of the four runs of Central Valley, West Coast, and Alaska Chinook because they leave the ocean with the biggest stores of fat energy and strength to sustain them through to spawning. They are prized for sport and table value.

Spring-run are perhaps best adapted of the four runs to California’s Central Valley because they migrated upstream with the snowmelt in spring. Dependable high cold flows allowed access to colder-summer mountain habitats. Yearling smolts emigrated to the ocean in the same snowmelt period.

Construction of rim dams captured the snowmelt and blocked migrations, leading to dramatic declines in run size. Runs were confined to a few un-dammed streams (e.g., Mill and Deer creeks) or below dams (e.g., Shasta Dam). Reservoir storage and water diversions in many Valley streams further blocked migrations and reduced flows (Chart 1) and raised water temperatures.

Central Valley runs that once numbered in the hundreds of thousands or more are now down to a few thousand. Multimillion dollar efforts have been underway now for several decades to restore spring-run. The spring run goal for the Central Valley Project Improvement act of 1992 is 59,000 spring-run below Shasta in the Sacramento River. The average run size from 1992-2012 was 684. The primary reason for lack of recovery is low flow and high water temperatures in spring in the lower Sacramento River and spawning tributaries. No river or creek has been unaffected, and so the spring-run have rapidly declined. (See references for early reports on spring-run and their decline.)

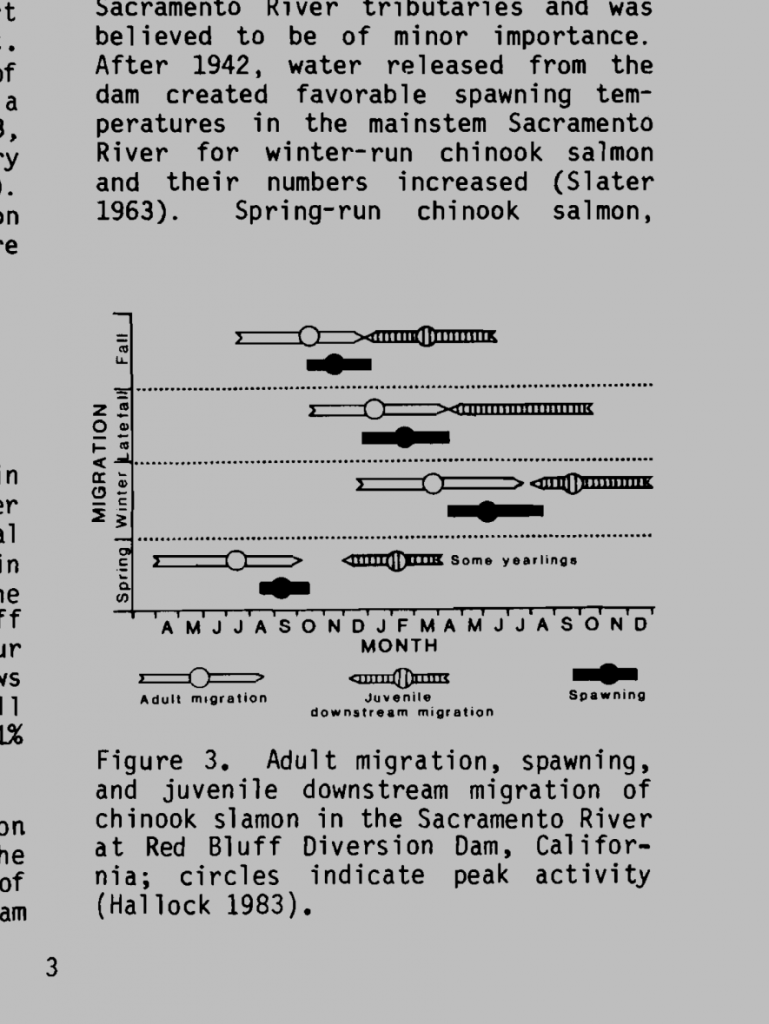
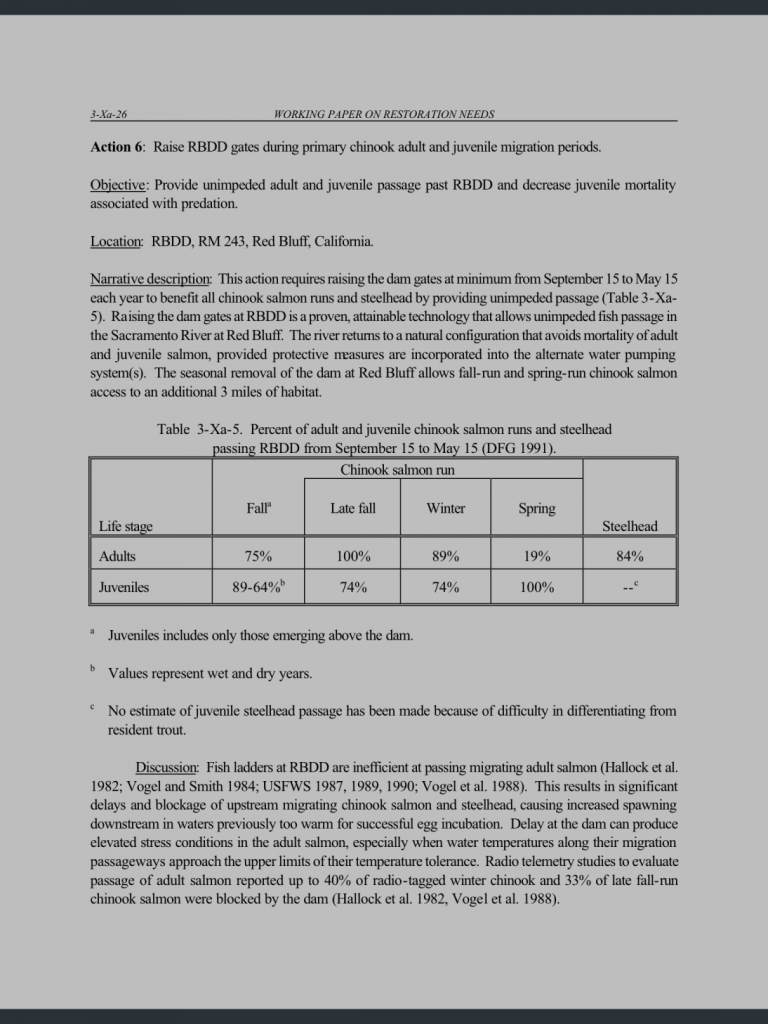
Peak migration of adult spring-run Chinook into the upper Sacramento occurs in May and June.1 About 80% of the spring-run passes Red Bluff after May 15. The adults oversummer in the upper Sacramento River and its tributaries before spawning in September and October. During migration and oversummering they require cold-water habitat for survival and the maturation of their gonads. Lack of cold water habitat reduces the viability of their eggs and sperm and subjects adults to poor survival from disease, energy loss, and heat stress.
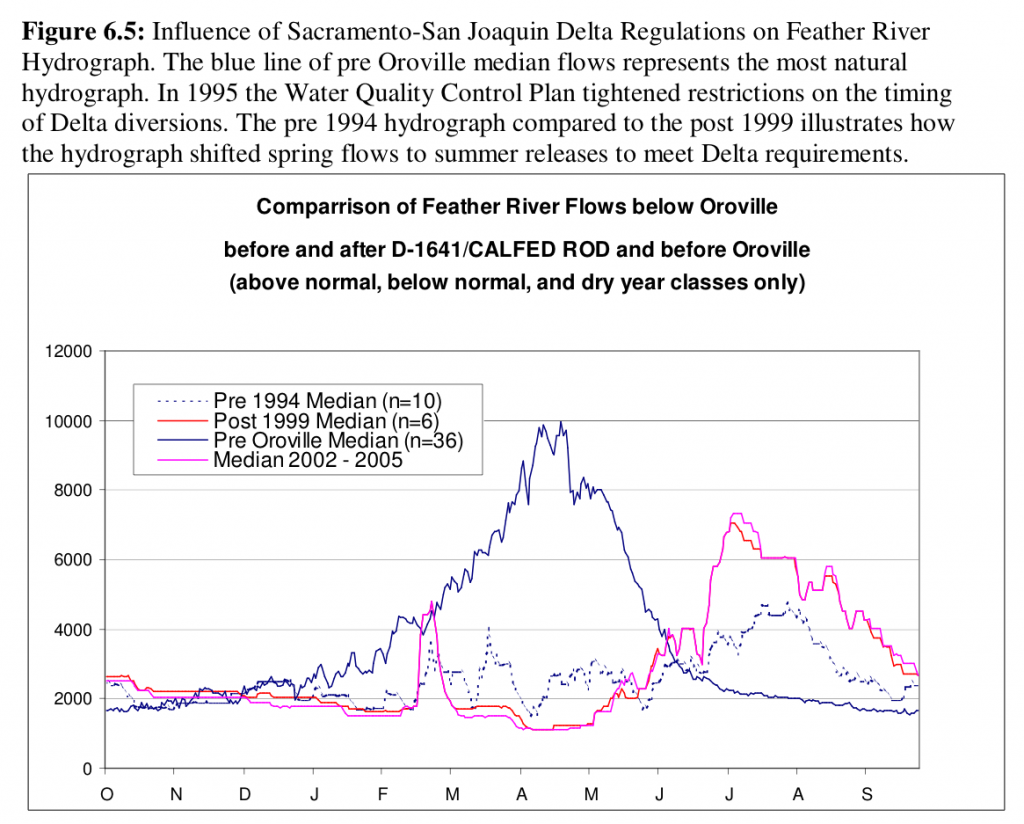
Chart 1. Example of spring snowmelt being captured by dams – Feather River. (Source: NHI 2008 )

Chart 1. Example of spring snowmelt being captured by dams – Feather River. (Source: NHI 20082)
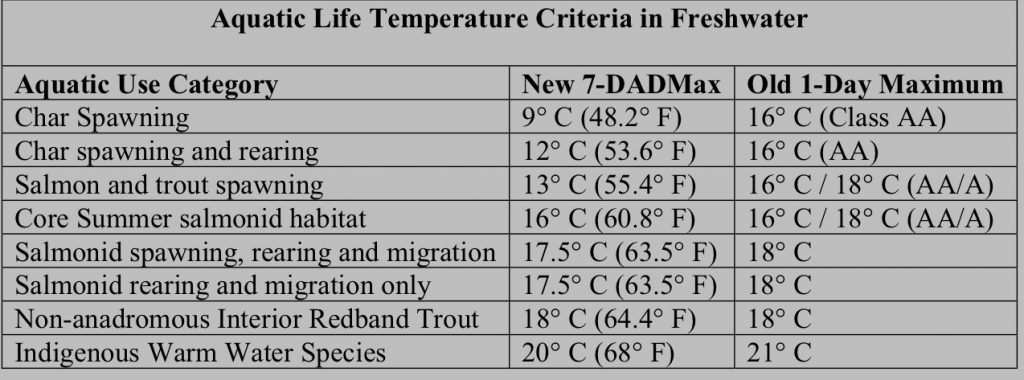
Of the four runs, spring-run are also the hardest to recover. The main reason is because they migrate from the ocean to their spawning rivers in spring, they are increasingly at risk to warm spring water temperatures in the lower Sacramento River. Water temperatures of 70°F or higher are detrimental to migrating salmon, and spring-run are especially at risk because much of the Valley’s cold snowmelt is captured and held in rim dam reservoirs. Those spring-run headed for un-dammed tributaries must still pass through the lower Sacramento River. NMFS’s criteria that define water temperature habitat degradation are shown in Chart 2 below. Water temperatures above 65°F are unsafe for salmon migration. In the Basin Plan the water temperature standard set by the State for the lower Sacramento River is 68°F to protect migrating salmon and other cool-water dependent fish (e.g., sturgeon and steelhead). Water temperatures of 72-74°F can block or severely delay migration.3 An excellent review of water temperature requirements of salmon by CDWR and Stillwater Sciences4 describes water temperatures above 65°F as being detrimental to migrating spring run salmon.

Chart 2. Aquatic life temperature criteria for freshwater. 7DADMax is the seven running average of the daily maximum water temperature. 1-Day Maximum is the daily average water temperature. (Source: NMFS).

Chart 2. Aquatic life temperature criteria for freshwater. 7DADMax is the seven running average of the daily maximum water temperature. 1-Day Maximum is the daily average water temperature. (Source: NMFS).

Water temperatures typically exceed 68°F in spring in the lower Sacramento River (Charts 3 and 4). In drier years high water temperatures may even block migration (72-74°) or kill adult salmon (>75°F). The high spring water temperatures are due in large part to low flows above (3000-5000 cfs) and below (5000-7000 cfs) the mouth of the Feather River at Verona (RM 80). A closer look at 2016 at Wilkins Slough (Charts 5 and 6) and Verona (Charts 6 and 7) show the relationship between flow and water temperature. While air temperatures and tributary water temperatures (particularly the Feather River at Verona) likely also played a part in patterns observed, the overall pattern from 2008 to 2016 indicates higher water temperature are a consequence of low river flows. Flows of 10,000 cfs and higher in May-June of 2010 and 2011 led to to water temperatures below 65°F. Intermediate flows (8000-10,000 cfs) in May-June 2012 and 2013 led to water temperatures from 68-70°F.

The issue of low river flows and high water temperatures in spring has received little consideration in drought management plans, salmon biological opinions, and the NMFS Central Valley Recovery Plan. The only consistent attention has been centered around reducing Shasta releases and lowering flows at Wilkins Slough to save Shasta storage and cold-water pool in dry years. Even this spring, with a full Shasta Reservoir, the overwhelming concern for saving the Shasta cold-water pool has led to minimum releases and Wilkins Slough flows near 3000 cfs. Mention is rarely made of meeting the Basin Plan 68°F criterion for the lower Sacramento River. If anything was mentioned, it was for allowing a reduction in spring flows below Keswick and at Wilkins Slough to 3000-4000 cfs to save Shasta storage and cold-water pool. Most of the required water for Delta inflow has come from the Feather and American Rivers.

Another problem rarely mentioned is warm water discharges, especially agricultural drainage into the lower Sacramento River in spring. Water temperatures from these considerable sources can easily exceed 80°F. The Knights Landing Outfall of the Colusa Basin Drain is one such source. I once measured 80°F on May 1 at the mouth of the Feather River during the peak season of the Feather’s substantial spring-run.

The operations that imperil spring-run create a serious issue that deserves much more attention. Increasing Wilkins Slough flows by several thousand cfs would go a long way to reducing this year’s problem. This would require up to 200,000 acre-ft of Shasta storage, or about 5% of the 4.2 maf of present storage. The added flow would help maintain winter-run spawning near Redding in June and improve Delta inflow/outflow and perhaps exports. At present, 7,000 cfs is being released at Keswick, with only 3000 cfs reaching Wilkins Slough. The difference is being diverted from the upper river by CVP water contractors.

Chart 3. Water temperature of the Sacramento River at Wilkins Slough (RM 125) from May 2008 to early June 2016. Higher water temperature in May-June 2014 and 2015 drought years and 2016 occurred at May flows of 3000-5000 cfs.

Chart 3. Water temperature of the Sacramento River at Wilkins Slough (RM 125) from May 2008 to early June 2016. Higher water temperature in May-June 2014 and 2015 drought years and 2016 occurred at May flows of 3000-5000 cfs.

Chart 4. Water temperature of the Sacramento River at Verona (RM 80) from May 2008 to early June 2016. Higher water temperature in May-June 2014 and 2015 drought years occurred at flows of 5000-7000 cfs.

Chart 4. Water temperature of the Sacramento River at Verona (RM 80) from May 2008 to early June 2016. Higher water temperature in May-June 2014 and 2015 drought years occurred at flows of 5000-7000 cfs.

Chart 5. Water temperature of the Sacramento River at Wilkins Slough (RM 125) from May to early June 2016.

Chart 5. Water temperature of the Sacramento River at Wilkins Slough (RM 125) from May to early June 2016.

Chart 6. Flow in the Sacramento River at Wilkins Slough (RM 125) from May to early June 2016.

Chart 6. Flow in the Sacramento River at Wilkins Slough (RM 125) from May to early June 2016.

Chart 7. Water temperature of the Sacramento River at Verona (RM 80) from May to early June 2016.

Chart 7. Water temperature of the Sacramento River at Verona (RM 80) from May to early June 2016.

Chart 8. Flow in the Sacramento River at Verona (RM 80) from May to early June 2016.

Chart 8. Flow in the Sacramento River at Verona (RM 80) from May to early June 2016.

References

Hallock, R.J. 1983. Sacramento River king salmon life history patterns a t Red Bluff, California. Unpubl. Central Valley Project report, California Department of Fish and Game, Red Bluff.

Hallock, R.J.., and D.H. Fry. 1967. Five species of salmon, Oncorhynchus, in the Sacramento River, California. Calif. Fish Game 53:5-22.

Hallock, R.J., and W. F. Van Woert. 1959. A survey of anadromous fish losses in irrigation diversions from the Sacramento and San Joaquin Rivers, Calif. Fish Game 45:227-296.

Hallock, R.J., R.F. Elwell, and D.H. Fry. 1970. Migrations of adult king salmon, Oncorhynchus tshawytscha, demonstrated by the use of sonic tags. Calif. Fish Game Fish Bull. 151. 92 pp.

Anadromous Fish Restoration Program of CVPIA – http://www.fws.gov/stockton/afrp/

image10

image9

  1. Yoshiyama, R. M., F. W. Fisher, and P. B. Moyle. 1998. Historical abundance and decline of Chinook salmon in the central valley region of California. North American Journal of Fisheries Management. 18(3):487–521.
  2. http://www.n-h-i.org/uploads/tx_rtgfiles/FINAL_Sacramento_and_Feather_Env_Flows_Doc.pdf
  3. http://www.tandfonline.com/doi/abs/10.1577/T09-171.1?journalCode=utaf20
  4. http://www.water.ca.gov/pubs/environment/fish/ upper_yuba_river_watershed_chinook_salmon_and_ steelhead_habitat_assessment/yuba_salmon.pdf

Sturgeon are being Decimated by Water Management in Spring 2016

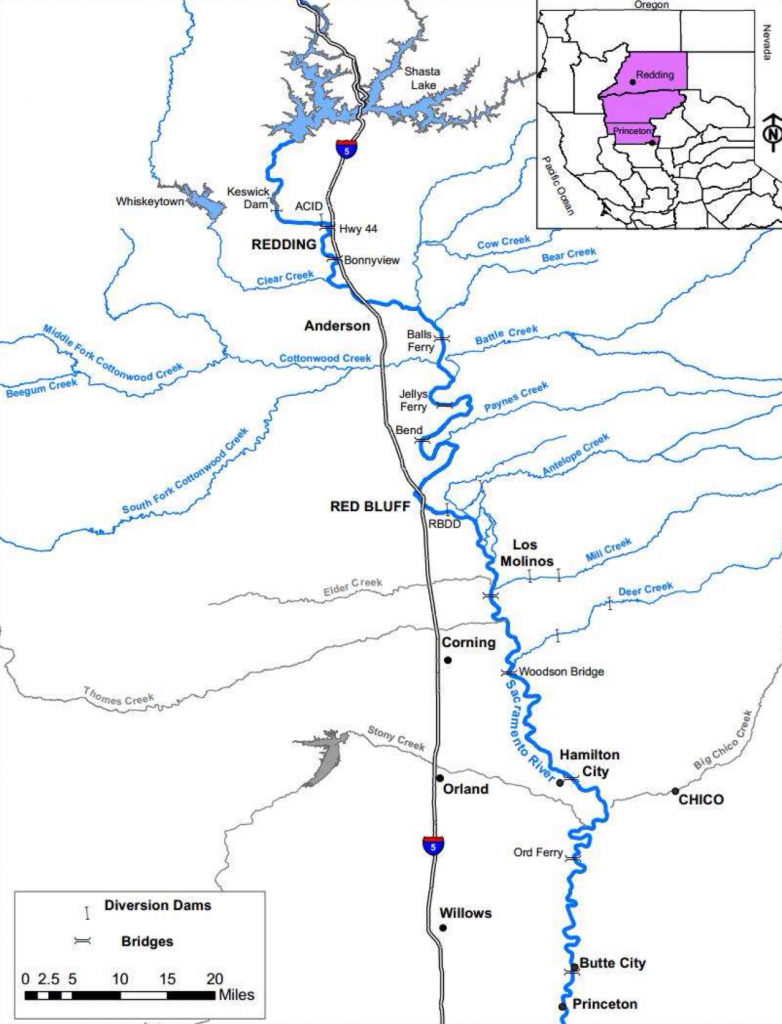
Green and White sturgeon spawn in the Sacramento River in spring, usually in April and May. Green sturgeon spawn predominantly above Red Bluff (RM 243) to near Redding (RM 264); they also spawn below Red Bluff, downstream to Hamilton City (RM 200) (see Figure 1). White sturgeon spawn primarily below Hamilton City in the lower river above and below Wilkins Slough (RM 125, downstream of area shown on map). Like other endangered fish in the Central Valley, sturgeon too were hurt during the recent four years of drought 1 by low flows and high water temperatures.

Figure 1. Map of the upper Sacramento River Basin (Princeton Ferry to Keswick Dam)

Figure 1. Map of the upper Sacramento River Basin (Princeton Ferry to Keswick Dam)

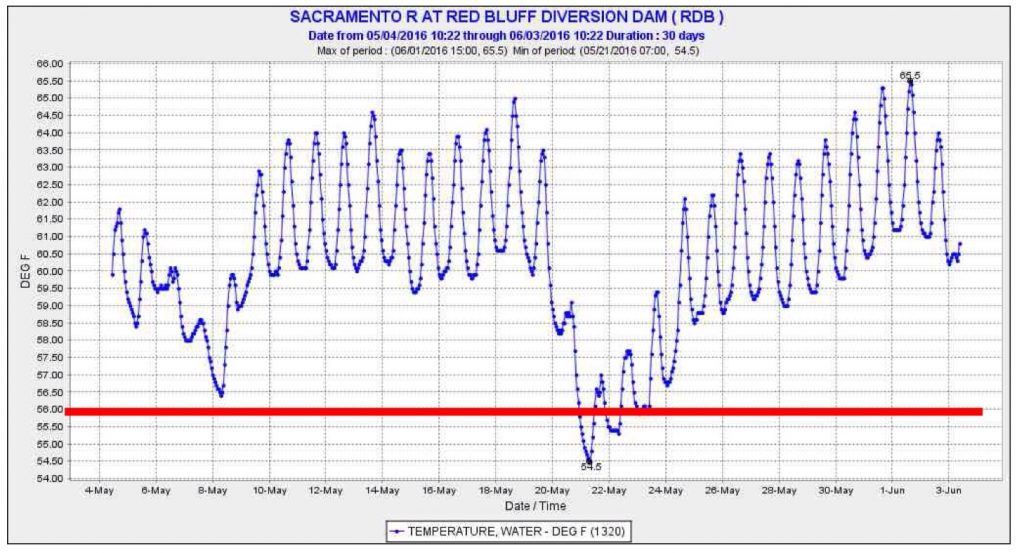
But this year is supposed to be different. Water Year 2016 is a wetter year (designated “Below Normal” for Sacramento Valley), and Shasta Reservoir is nearly full. Reclamation’s Central Valley Project should be able to meet the criteria set forth in the Basin Plan, Water Right Order 90-05, and the salmon and green sturgeon Biological Opinion that are designed to maintain habitat for salmon and sturgeon in the Sacramento River. Those criteria have a common element of maintaining Red Bluff (RM 243) spring-summer water temperature below a daily average of 56°F. The Basin Plan extends the criteria downstream to Hamilton City (RM 200) and adds a 68°F criterion from there downstream to Sacramento (RM 60) to protect salmon, sturgeon, and other fish. The criteria have been in place for decades, and are based on extensive science. Salmon spawning requires daily average water temperatures below 56°F. Water temperatures above 68°F are lethal to juvenile sturgeon.2 Governing requirements in each of the documents cited above allow the applicable criteria to be applied further upstream in drier years when Shasta storage and cold-water pool resources are less than adequate.

This year, the responsible agencies have apparently decided that the cold-water pool volume is inadequate despite the fact that Shasta is virtually full. The agencies have set the Control Point at Redding, with a 58°F daily average limit. By allowing the Red Bluff 56°F objective to be substantially weakened, the National Marine Fisheries Service (NMFS), the federal agency responsible for salmon and sturgeon, is thus accepting great risk not only to Winter Run salmon (decimated over the past two years), but also to green and white sturgeon.

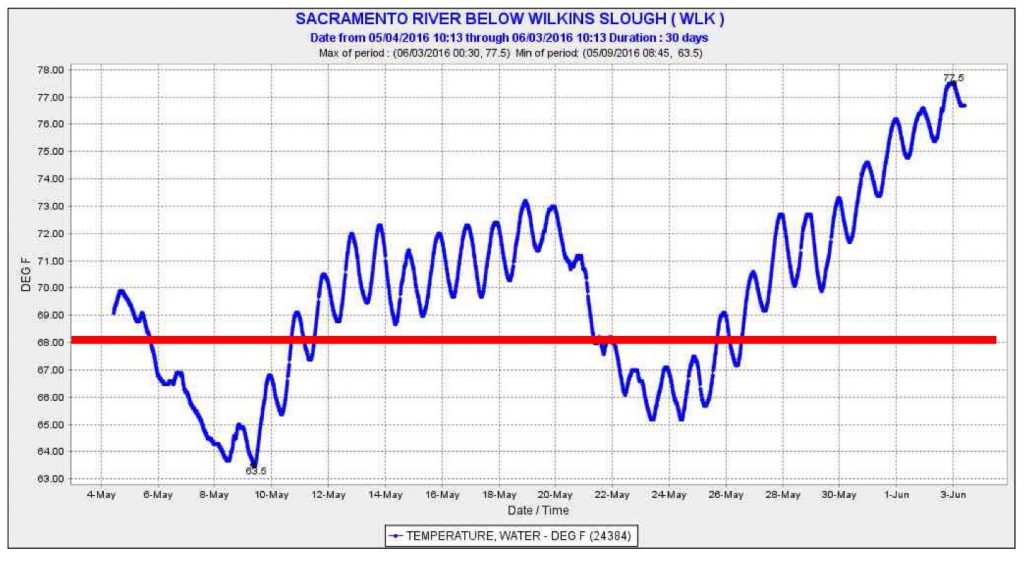
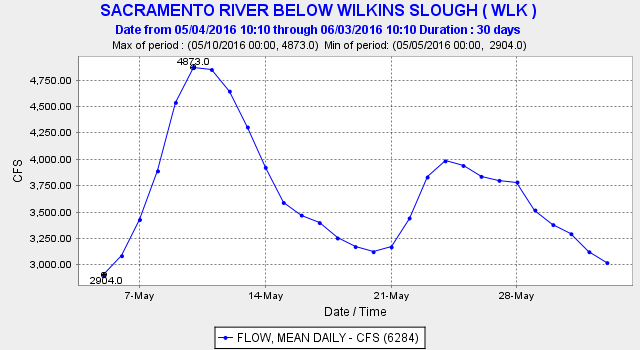
To save the Shasta cold-water pool, Reclamation has been releasing a minimum amount of water from Shasta and is taking the water primarily from the upper warm surface layers of the reservoir.3 This has resulted in water temperatures in the lower river at Red Bluff in excess of 56°F (Figure 2). It has also resulted in water temperatures below Red Bluff (Figure 3) that exceed 65°F, the upper thermal optima for sturgeon embryo development, and even 68°F, the lethal level for newly hatched sturgeon juveniles.4 The warm water in the lower river is also a consequence of unusually low seasonal flows in the lower Sacramento River in spring 2016 (Figures 4 and 5).

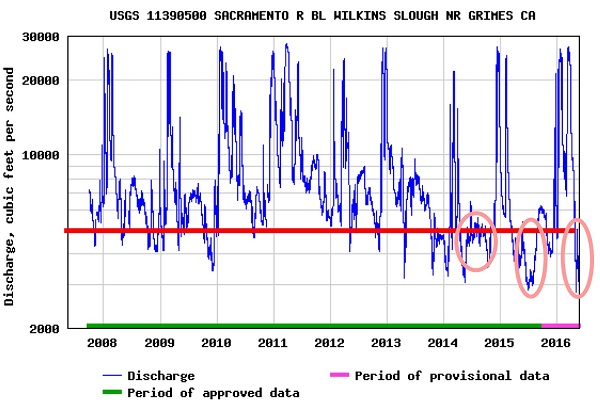
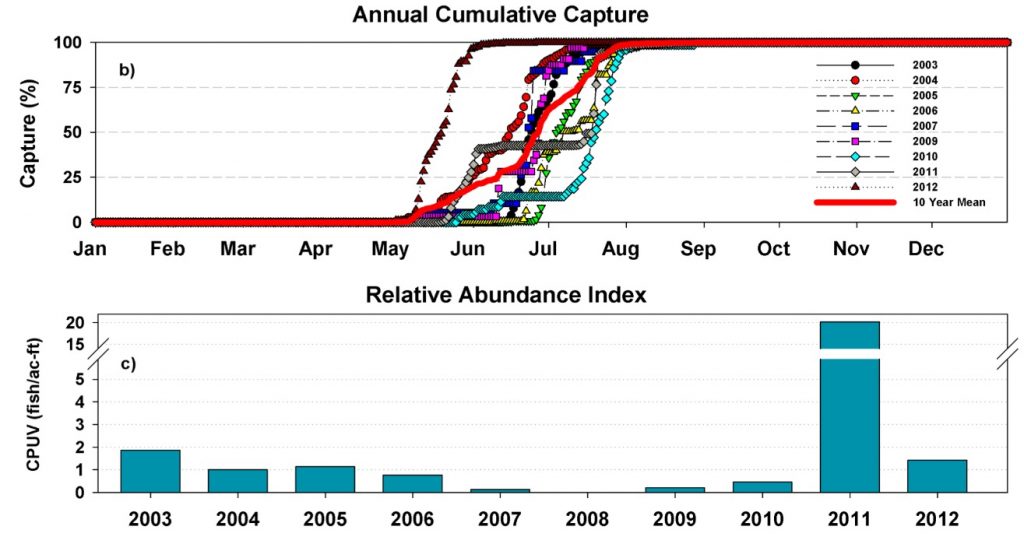
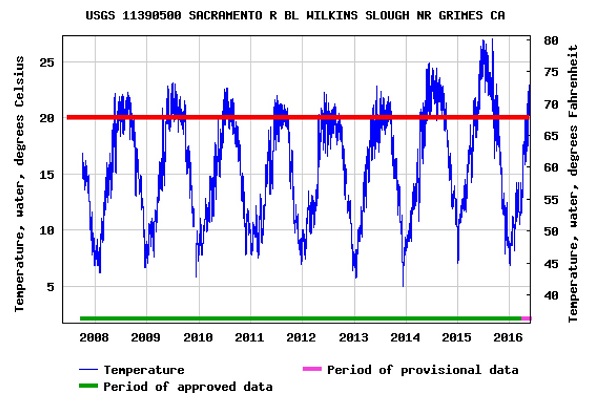
May and June are precisely the months of concern for the sturgeon. Sturgeon begin spawning when water temperatures start to exceed 55°F, which generally occurs in April. Green sturgeon young spawned above Red Bluff pass downstream through Red Bluff in May and June (Figure 6). Those passing Red Bluff and those spawned between Red Bluff and Hamilton City likely encountered their upper thermal optima of 65°F during May and early June. White sturgeon spawned in the lower river were subjected to lethal water temperature during much of May 2016. Lethal water temperatures predominated in May 2014 and 2015 (Figure 7), Critically Dry years, as well as in Below Normal 2016 (Figures 3 and 7). River flows at Wilkins Slough were also very low in these same years (Figure 5). In contrast, higher flows and lower water temperature were maintained in spring of years 2008-2013, which included four drought years.

The overall risk is greatest to White sturgeon, which spawn in the lower river where water temperatures are highest. That high risk is the result of unusually low seasonal river flows from a seemingly overzealous need by Reclamation to conserve Shasta storage this year. This effect is compounded by the fact that, of the 7000 cfs being releases from Shasta, only 3000 cfs is reaching the lower river. The rest is diverted by Reclamation’s north of Delta contractors, who received 100% of their allocations this year.

The sturgeon deserve 100% of their needs as well. That would require colder water and higher releases from Shasta to get flows at Wilkins Slough into the range of 5000-7000 cfs that was achieved in drought years 2008, 2009, 2012, and 2013 (Figure 5). That would amount to 4000-8000 acre-feet per day (0.1-0.2%/day) of a nearly full Shasta Reservoir (currently with 4,200,000 acre-feet of stored water). Such releases will be required in any event to meet export demands from the Delta in June.

For more detail on the issue see the following:

  1. http://www.waterboards.ca.gov/waterrights/water_issues/programs/drought/sacramento_river/
  2. http://www.norcalwater.org/wp-content/uploads/2011/12/swrcb_summary_apr_2014.pdf
Figure 2. Water temperature of Sacramento River at Red Bluff (RM 243) in May and early June 2016. Target for salmon and other fish is 56°F (red line).

Figure 2. Water temperature of Sacramento River at Red Bluff (RM 243) in May and early June 2016. Target for salmon and other fish is 56°F (red line).

Figure 3. Water temperature of Sacramento River at Wilkins Slough (RM 125) in May and early June 2016. Target for sturgeon and other fish is 68°F (red line).

Figure 3. Water temperature of Sacramento River at Wilkins Slough (RM 125) in May and early June 2016. Target for sturgeon and other fish is 68°F (red line).

Figure 4. Daily average Sacramento River flow at Wilkins Slough (RM 125) in May 2016.

Figure 4. Daily average Sacramento River flow at Wilkins Slough (RM 125) in May 2016.

Figure 5. Sacramento River flow at Wilkins Slough (RM 125) 2008-2016. Circles denote unusually low flows 2014-2016.

Figure 5. Sacramento River flow at Wilkins Slough (RM 125) 2008-2016. Circles denote unusually low flows 2014-2016.

Figure 6. Capture patterns of young Green sturgeon in USFWS traps at Red Bluff 2003-2012.

Figure 6. Capture patterns of young Green sturgeon in USFWS traps at Red Bluff 2003-2012.

Figure 7. Water temperature in the Sacramento River at Wilkins Slough 2008-2016. The Basin Plan objective and the lethal water temperature for young sturgeon of 68°F is depicted with red line.

Figure 7. Water temperature in the Sacramento River at Wilkins Slough 2008-2016. The Basin Plan objective and the lethal water temperature for young sturgeon of 68°F is depicted with red line.

End of May 2016 Smelt Update

Since my last update in April, Delta and longfin smelt have continued their trends of record low numbers. I opined that they were not yet gone, but close, and that it remained to be seen whether the good conditions provided to date in 2016 could lead to some form of recovery for these two endangered species.  The prognosis remains poor.

Habitat conditions in the Bay-Delta remained good through April and May.  Below normal year estuary inflows were modest, and Delta exports were low thanks to caps in endangered fish species biological opinions.  Longfin and Delta smelt may have further benefitted from a rare spring plankton bloom.

A quick view of the status of smelt can be gleaned by comparing recent May 20-mm Survey results with those from last year, the fourth year of drought conditions, and those from 2010, the last below normal water year before the 2012-15 drought and after the 2007-09 drought.

Longfin Smelt

The May 2016 survey (Figure 1) compares favorably with the 2015 Longfin pattern (Figure 2), but less so with 2010 (Figure 3).  Higher densities of longfin smelt occurred in Suisun Bay this year compared to 2015, although they are generally lower than in 2010.  Year 2010 had higher Delta outflow in spring, and longfin juveniles had a wider distribution and higher densities.

Delta Smelt

The May 2016 survey (Figure 4) shows little or no improvement in Delta smelt compared with 2015 (Figure 5), and poorer performance when compared to 2010 (Figure 6).  Most of the young Delta smelt in 2015 and 2016 were confined to the Sacramento Ship Channel in the north Delta, whereas in 2010 they were more widely distributed into the western Delta and Suisun Bay, albeit in very low densities compared to historical levels.

Map of Longfin smelt young densities from May 2016 20-mm Survey

Figure 1. Longfin smelt young densities from May 2016 20-mm Survey. Source of charts: https://www.wildlife.ca.gov/Conservation/Delta/20mm-Survey

Map of Longfin smelt young densities from May 2015 20-mm Survey

Figure 2. Longfin smelt young densities from May 2015 20-mm Survey.

Figure 3. Longfin smelt young densities from May 2010 20-mm Survey.

Figure 3. Longfin smelt young densities from May 2010 20-mm Survey.

Map of Delta smelt young densities from May 2016 20-mm Survey.

Figure 4. Delta smelt young densities from May 2016 20-mm Survey.

Map of Delta smelt young densities from May 2015 20-mm Survey

Figure 5. Delta smelt young densities from May 2015 20-mm Survey.

Map of Delta smelt young densities from May 2010 20-mm Survey

Figure 6. Delta smelt young densities from May 2010 20-mm Survey.

Striped Bass Comeback Continues

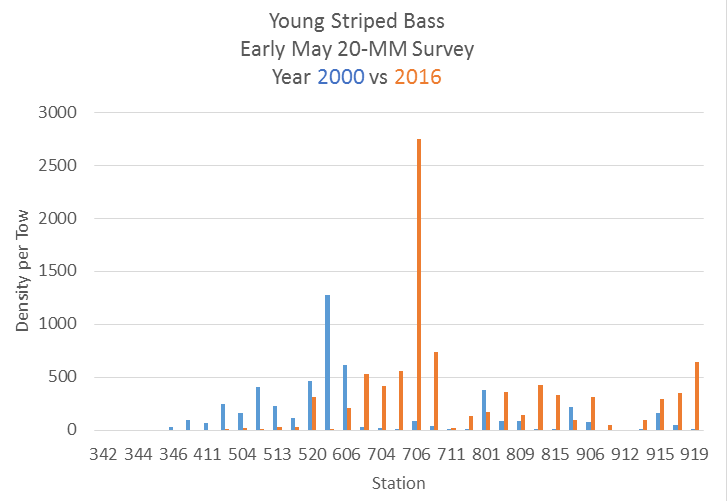
The striped bass 2016 year class production continues looking good compared to past years, even the last modest production year 2000.  Year 2000 was the last year the Summer Townet Index for striped bass reached 5.  On May 28 I related the unusually high April catches of larval striped bass in the 20-mm Survey.  The most recent survey in May continues this trend.  A comparison of May 20-mm Survey catches in 2000 vs 2016 (Chart 1) provides some insight as to really how remarkable the 2016 pattern really is.

Chart 1. Densities of larval striped bass in early May 20-mm survey in years 2000 and 2016.

Chart 1. Densities of larval striped bass in early May 20-mm survey in years 2000 and 2016.

Year 2000 was a wet year with early May Delta outflows of 30,000-36,000 cfs, whereas early May 2016, a below-normal water year, had only 8,000-15,000 cfs Delta outflow. The distributions of larval stripers in Chart 1 reflect the differences in outflow, with larval striped bass being more concentrated in Suisun Bay (stations 400s and 500s) in year 2000, as compared with the higher concentrations being in the Delta (stations 700s, 800s, and 900s) in 2016.

The larval striped bass densities in the Delta in 2016 are relatively high compared to the past 10 years, and they are comparable to the 10 years before that (1995-2005). The high spring larval densities are coincident with moderate Delta inflow/outflow and low exports, along with a rare spring plankton bloom.

The prognosis for the 2016 striped bass year class remains poor, for the same reason striped bass and other Delta fishes have suffered over the past four decades: upcoming low summer Delta outflows and high exports. Most of larvae in the central, southern, and eastern Delta (stations in the 800s and 900s in Chart 1) will not survive. Few young striped bass will reach the sanctuary of Suisun Bay (stations in the 400s and 500s).

This pattern is ominously similar for Delta smelt. The success of both Delta smelt and striped bass in 2016 will be a function of how many can reach Suisun Bay and how they will fare in Suisun Bay. With expected low summer outflows and high exports, Suisun Bay may be too brackish for both species, in which case survivors will be forced to survive the summer in the lower Sacramento River channel in the north and western Delta (station 700s). Even here, remaining smelt and striped bass will be continually siphoned off from net negative tidal flows through Three Mile Slough to the central and south Delta. So goes the Delta over the past four decades.

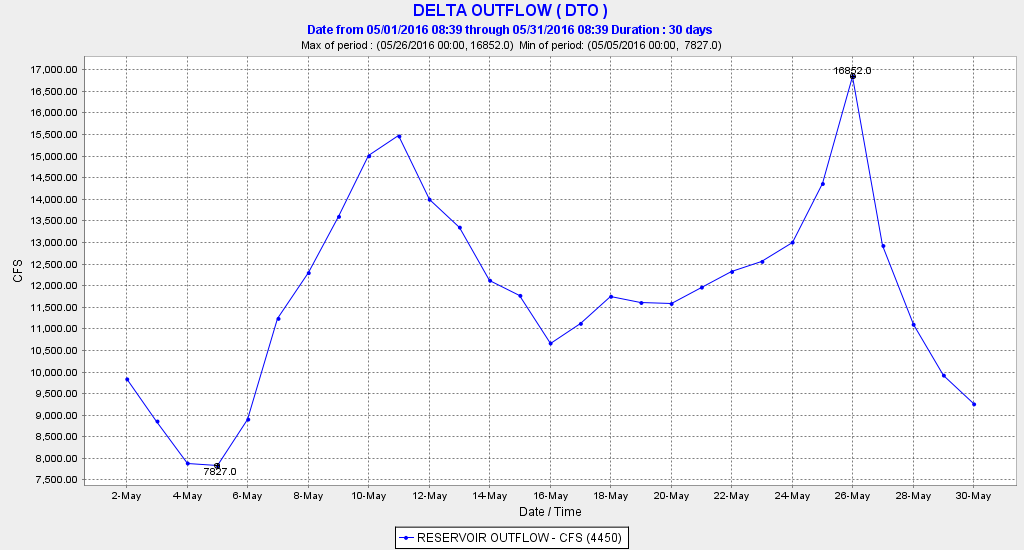
In an April 27 post, I recommended maintaining a June Delta outflow of 15,000 cfs to help recover longfin smelt. Maintaining outflow in the 10,000-15,000 range through June would also help Delta smelt and striped bass by keeping the Low Salinity Zone nursery of all three species in Suisun Bay away from the influence of the South Delta exports. Such outflows were maintained in 2010, the last below-normal water year. With expected exports in June of about 5000 cfs (BO limit for OMR), an outflow of at least 10,000 cfs could be achieved under the existing Export/Inflow standard of 35%. With end-of-May Delta outflow already falling below 10,000 cfs (Chart 2), the issue should be addressed immediately by the agencies’ Smelt Working Group and Delta Management Group.

Chart 2. Delta outflow in May 2016. Source: CDEC.

Chart 2. Delta outflow in May 2016. Source: CDEC.