A recent post from the Center for California Water Resources Policy and Management (Center) discusses the extinction of the Delta smelt. The post starts by saying, “To be sure, the delta smelt’s numbers are in decline.” That is a real understatement, but it contains some acknowledgement of the facts.
The author goes on to say, “It might fairly be argued that prime contributors to the delta smelt’s distressed status are California’s resource agencies.” The ostensible rationale for this attribution is, first, that the resource agencies don’t look for smelt in the right places in the right way. Second, because the agencies can’t find the smelt, “they have resisted managing the species ‘adaptively’” based on the monitoring that they don’t do.
This ridiculous premise suggests the decline has not been caused by excessive exports of water from the Bay-Delta watershed over the past five decades, but by the resource agencies who don’t know where to find and thus protect the smelt.
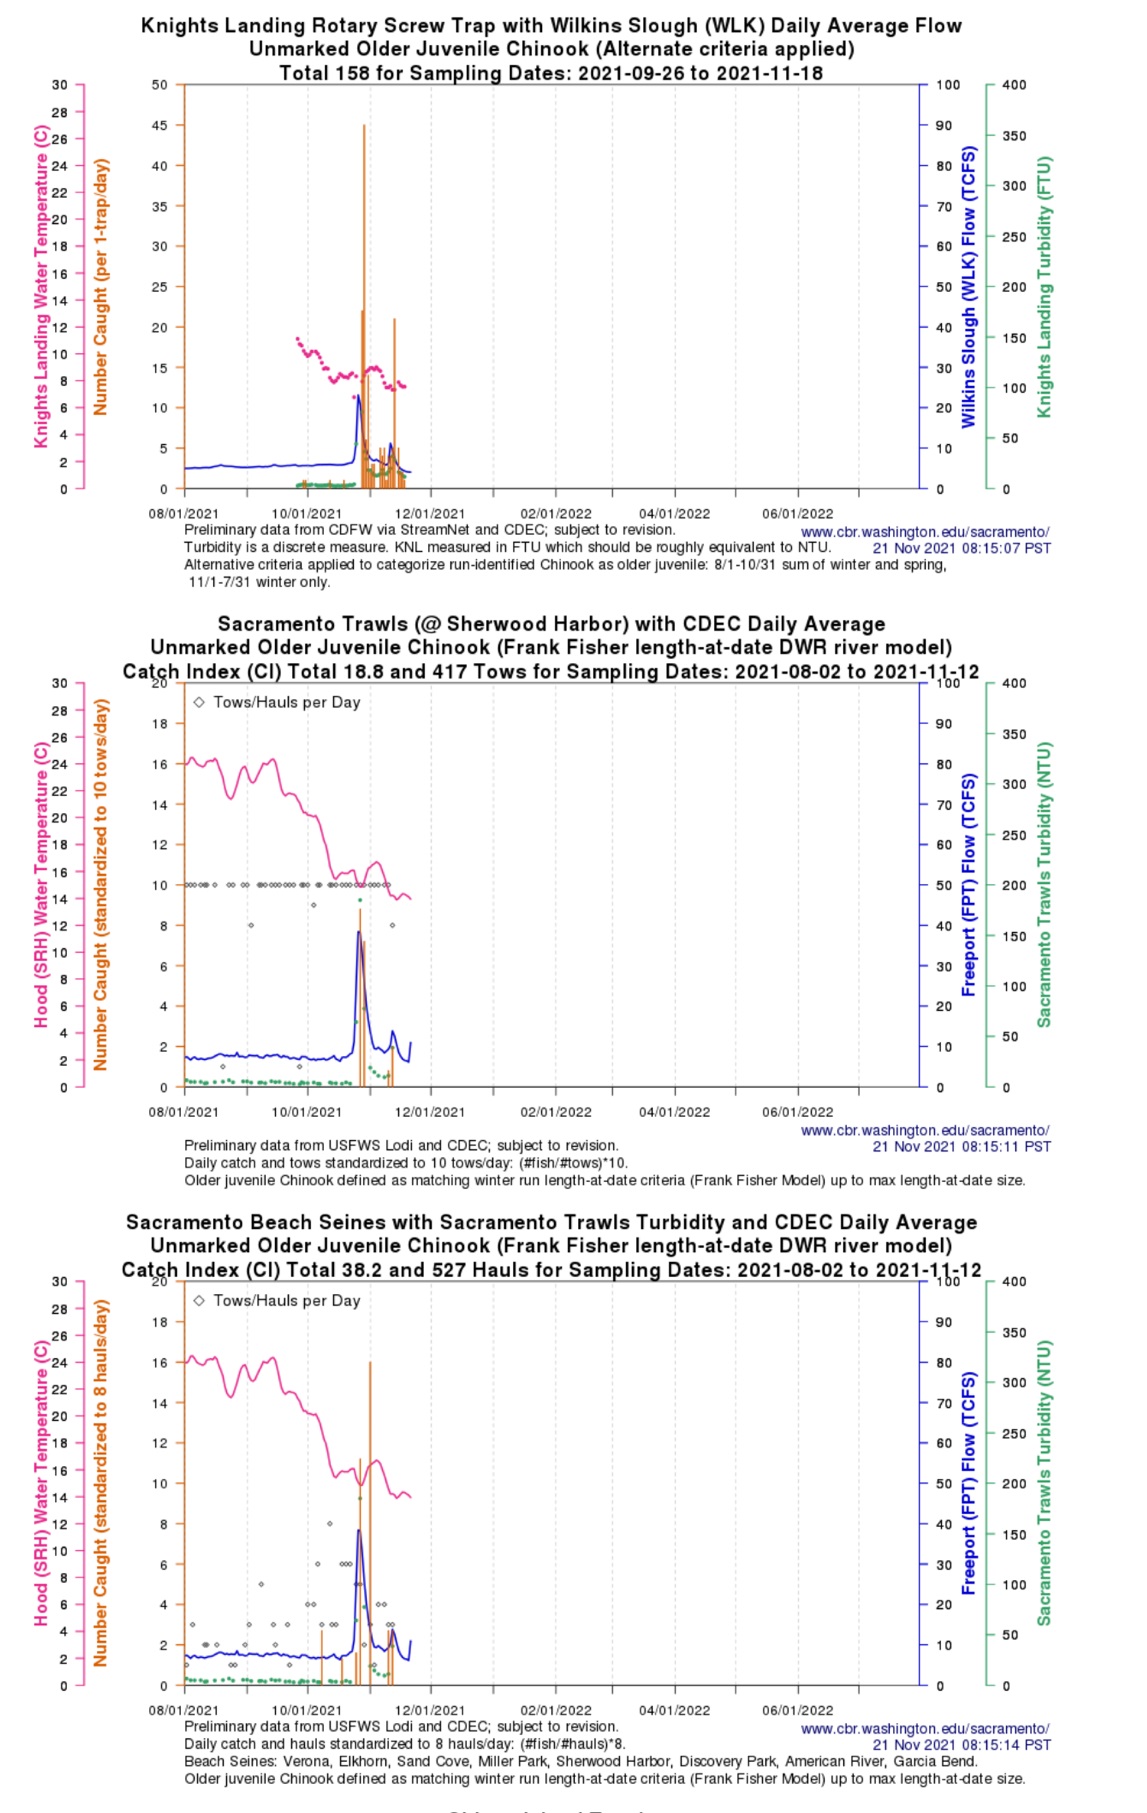
The author argues: “The agencies persist in mobilizing trawler-based open-water fish surveys, originally intended to census juvenile striped bass, as their primary means of monitoring delta smelt and the Delta’s other protected fish species.” This statement is simply untrue. To provide better coverage of “open-water” pelagic smelt, the Interagency Ecological Program (IEP) in recent decades added the Larval Survey, the 20-mm Survey, the Kodiak Trawl Survey, and most recently the Enhanced Delta Smelt Monitoring Program (EDSM). All of these surveys, plus the historic Fall Midwater Trawl and Summer Townet Surveys (and 50 years of Delta Export Fish Salvage Surveys), show the smelt’s catastrophic decline and march toward extinction.
But the author insists that the smelt are out there somewhere. “The surveys sample neither the relevant habitat strata used by those fishes nor the extent of their ‘closed’ populations, which would allow for estimates of the sizes of their populations.” If the smelt are out there in “closed populations” whose numbers would change the conclusions about the smelt’s catastrophic downward trend, then surely the author and the water purveyors who have a vested interest in finding those populations can muster some evidence and show the agencies and the rest of the world where to look.
Basic review and analyses of the available information show the decline of Delta smelt is highly associated with increasing exports and associated factors (see my many posts on this subject). The partial truth in the notion that the resource agencies have been complicit in the decline of Delta smelt stems from agency inaction to cut back those exports consistent with biological sustainability. Agency managers don’t lack information and scientific method. They lack the political courage to deploy them.