Following an introductory post, this is the sixth post in a series on the lessons learned by the National Marine Fisheries Service (NMFS) from the 2013-2015 drought that devastated Sacramento River salmon populations. This post addresses Lesson #4.
NMFS’s lesson #4 states that the summer water temperatures in the 10-mile reach of the Sacramento River downstream of Keswick dam, the most heavily used reach for spawning by winter-run salmon, are not “correlated with flow.” The lesson is important in that if generally true, high summer flow releases are not important in managing summer water temperatures for the salmon spawning and egg-embryo incubation that takes place close to Keswick Dam. The magnitude of flow releases from the dam appears to have minimal effect on how much summer water temperatures increase in the upper 20 miles of river. Rather, water temperature in this river reach is more a function of distance from the dam and the temperature of the water when released from Keswick.
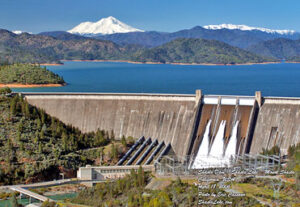
Keswick is a small re-regulating reservoir that takes in water as it is released from Shasta Dam’s peaking power plant and from the Spring Creek Powerhouse, which generates power with water imported to the Sacramento from the Trinity River. The water from the powerhouses is mixed in Keswick Reservoir as it enters the reservoir at times of day when power is most valuable. “Re-regulation” means that Reclamation holds releases from Keswick to the Sacramento River downstream relatively constant over the course of the day. The water temperature may be cold enough for salmon in the 20 miles of river immediately downstream of Keswick Dam, but water in the river warms quickly, depending on flow, as it moves further downstream through the remaining 200 miles of the lower Sacramento River.
1) Effect of Flow on the Water Temperature of Shasta/Keswick Releases
Water temperature immediately below Keswick in drier years 2014 and 2020 was most certainly related to flow (Figure 1), but not in the sense one might expect. In 2014, high flow magnitudes (releases) caused a loss of access to the cold-water pool in Shasta Reservoir. In 2020, high early summer releases led to reduced late summer releases to conserve the cold-water pool. In both cases, spring-summer water deliveries to downstream water contractors were excessive, leading to limited access to Shasta’s cold-water pool by fall, resulting in high salmon egg-embryo mortality.
2) Effect of Flow Magnitudes into Keswick Reservoir on Temperature Increases within the Reservoir
There is some evidence that the temperature of water increases as it moves through and mixes within Keswick reservoir. Keswick releases are often slightly warmer than upstream Shasta Dam releases into Keswick Reservoir (Figure 2), although the relationship is complicated by releases from Spring Creek Powerhouse of warmer water imported from the Trinity River system. Again, as described above in point 1, the water temperature in Keswick Reservoir and water released from it in the late summer and fall of 2014 was primarily the result of gradual decline in the availability of cold water from the bottom of Shasta Reservoir.
3) Effect of Flow Magnitudes on Water Temperature in Sacramento River immediately below Keswick Dam
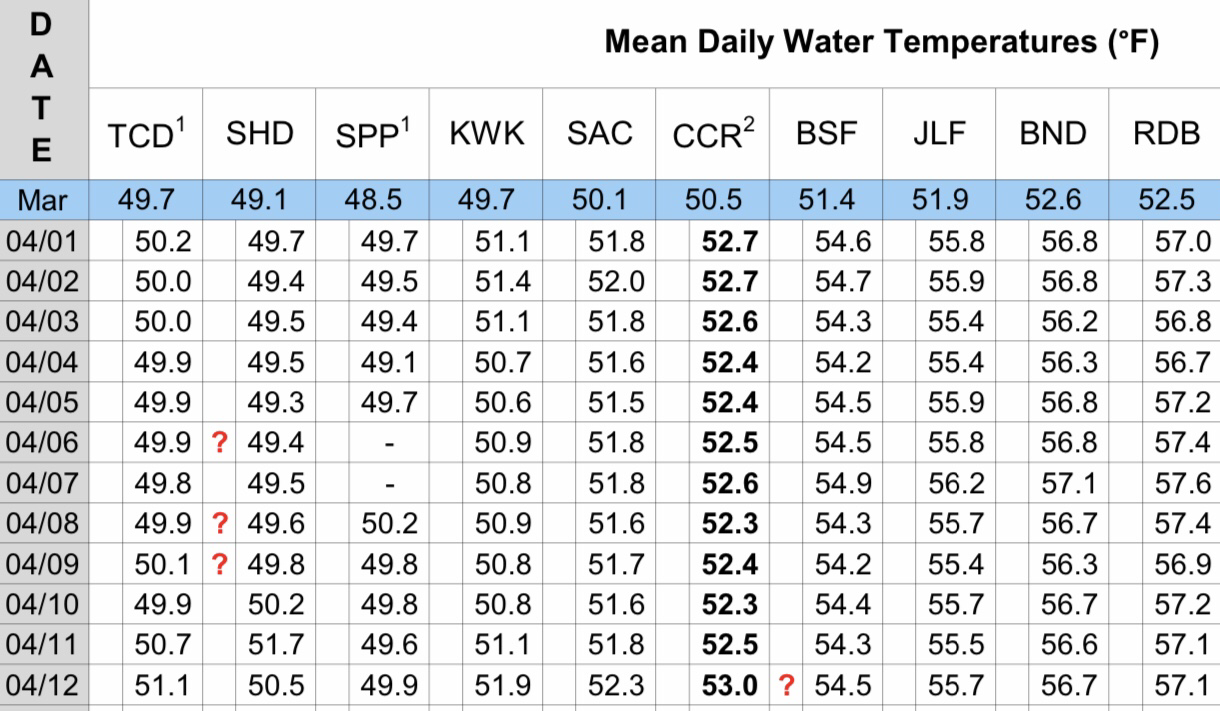
Higher flow magnitudes immediately downstream of Keswick Dam do not always translate into lower water temperatures, because the temperature of the source water in Shasta is more important (Figure 3). Temperature increases a short distance from Keswick Dam are small (Figure 4). Even in summer of wet-year 2019, water temperature increases over the 10-mile spawning reach were similar to those in 2020 (Figur e 5). In 2019, flow magnitude had relatively little influence on water temperature even as far downstream as Balls Ferry.
It is worth noting that when dam release temperatures are at or above the upper limit of safe survival (53oF) as they were in summer 2020, then any temperature increase in the 10-mile spawning reach becomes a critical issue for the survival of the eggs and embryos of winter-run salmon. However, the solution is not to increase flow to reduce warming within the 10-mile spawning reach, because that depletes the Shasta cold-water pool and trades a short-term benefit for the long-term impact of reducing the size and accessibility of the Shasta cold-water pool. Rather, the solution is to keep releases low enough over the course of the spring and summer to allow those releases to maintain temperatures lower than the 53ºF threshold.
4) Effect of Flow Magnitudes on Water Temperature in Lower Reaches of the Sacramento River
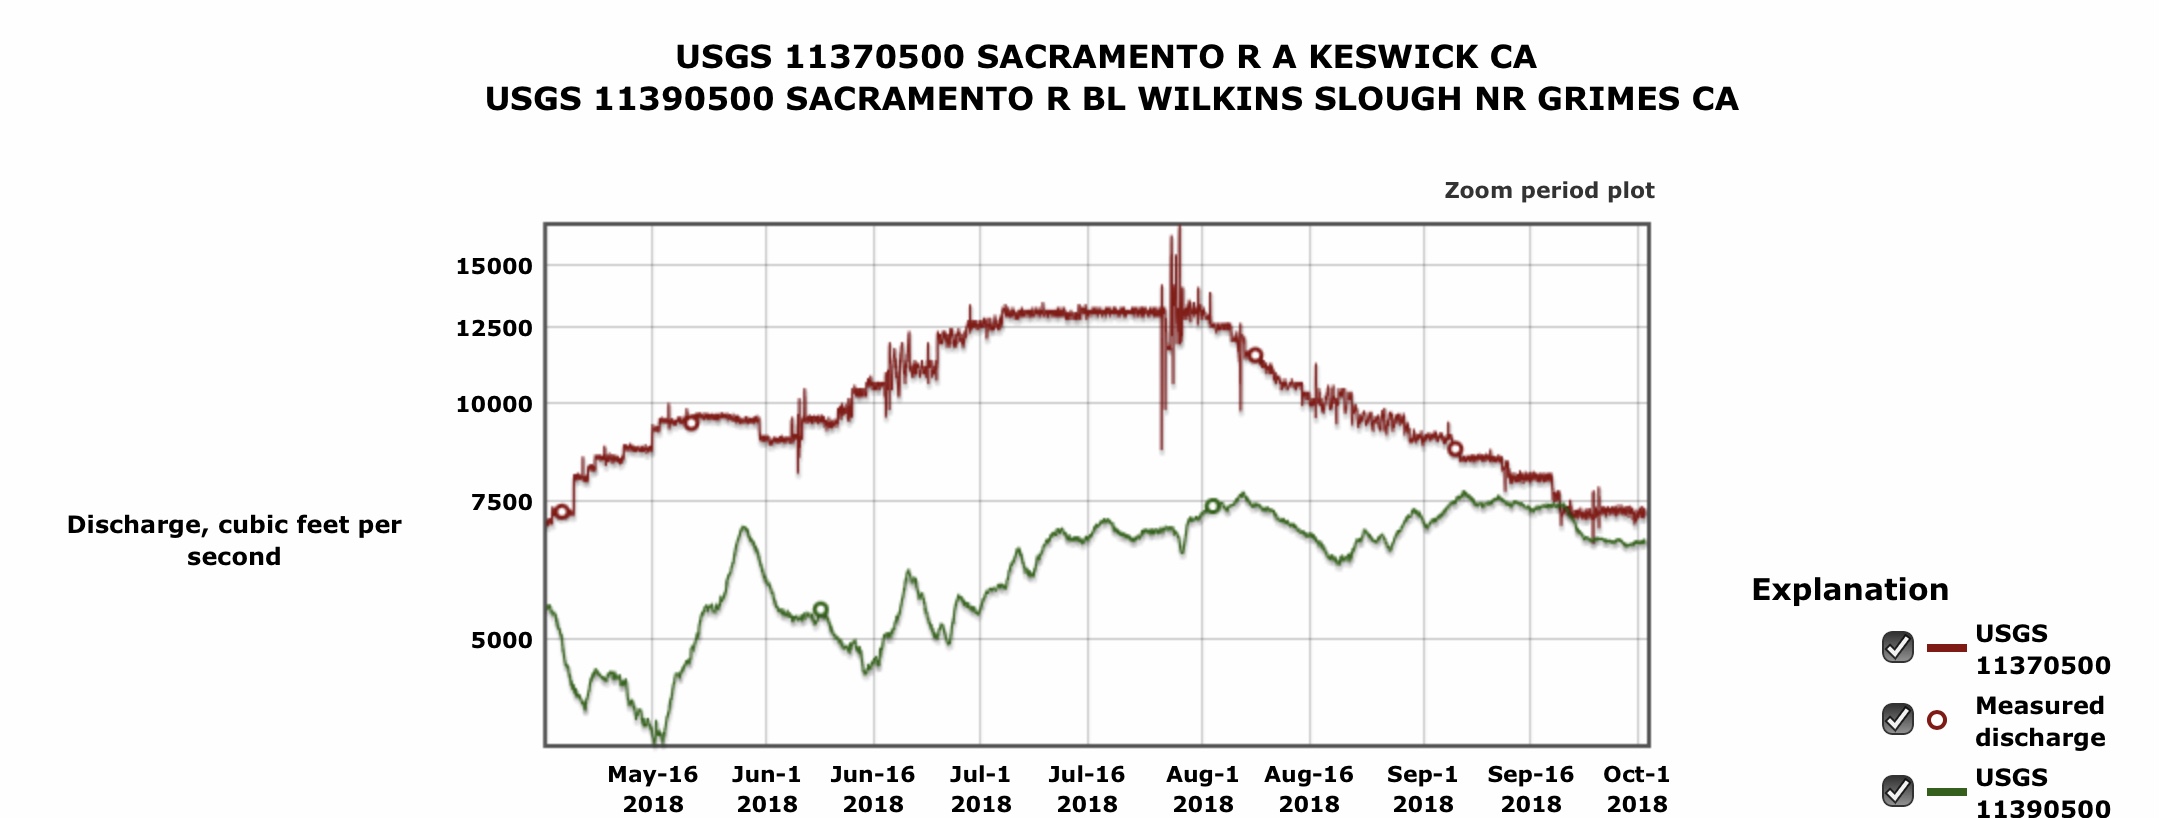
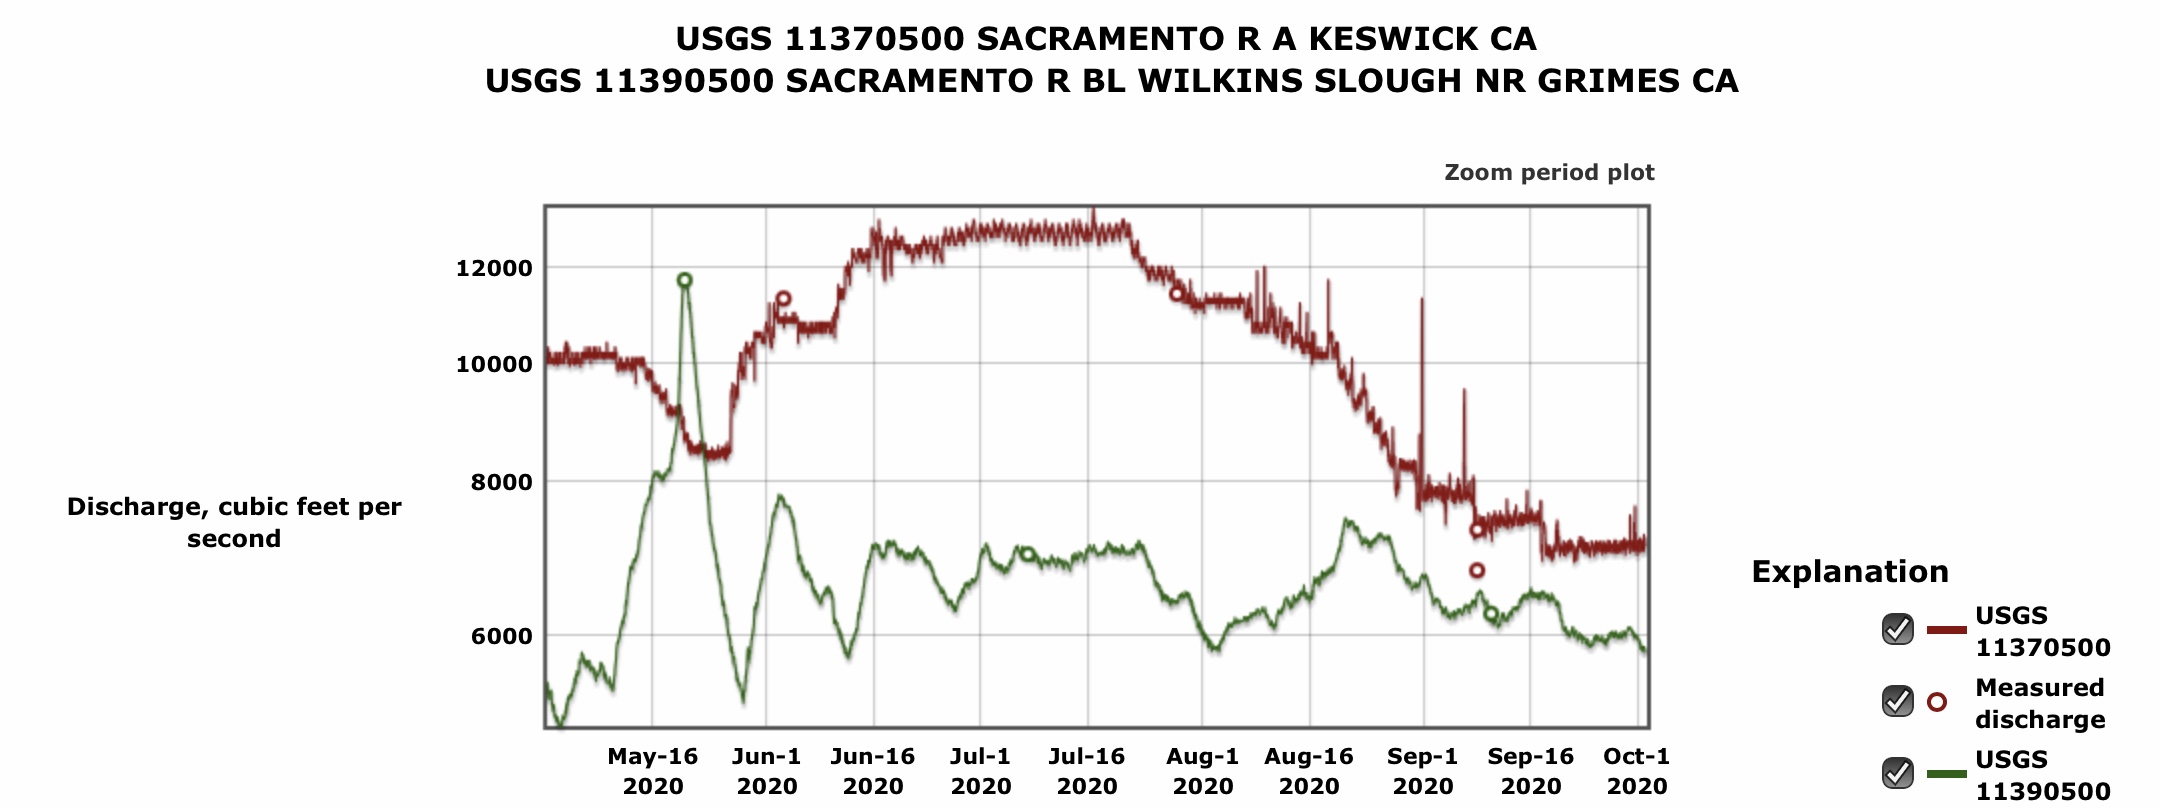
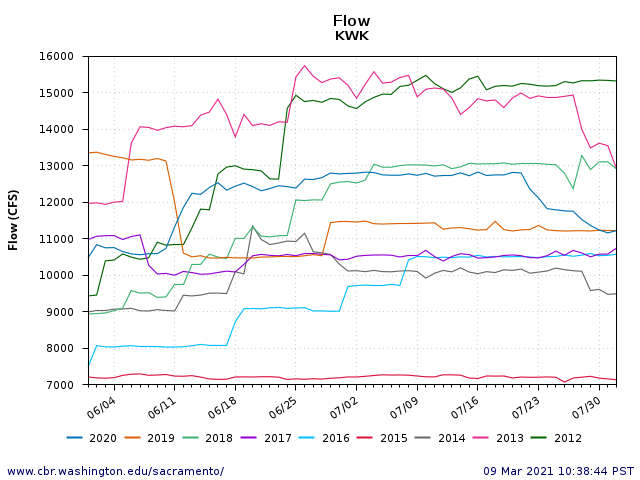
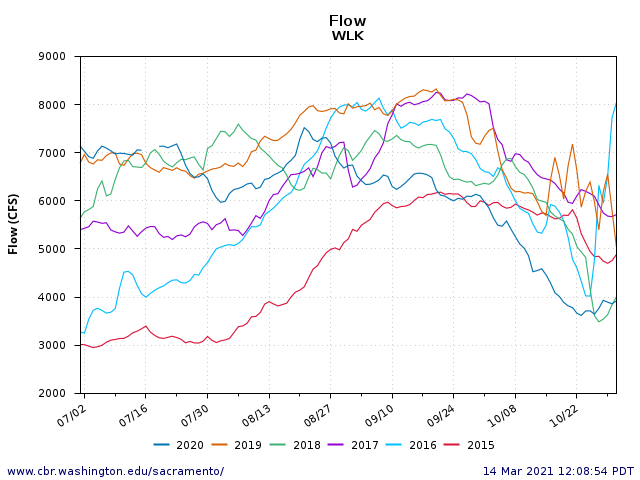
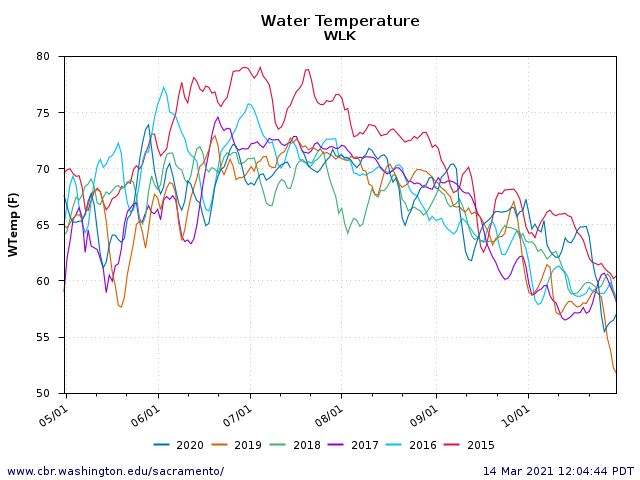
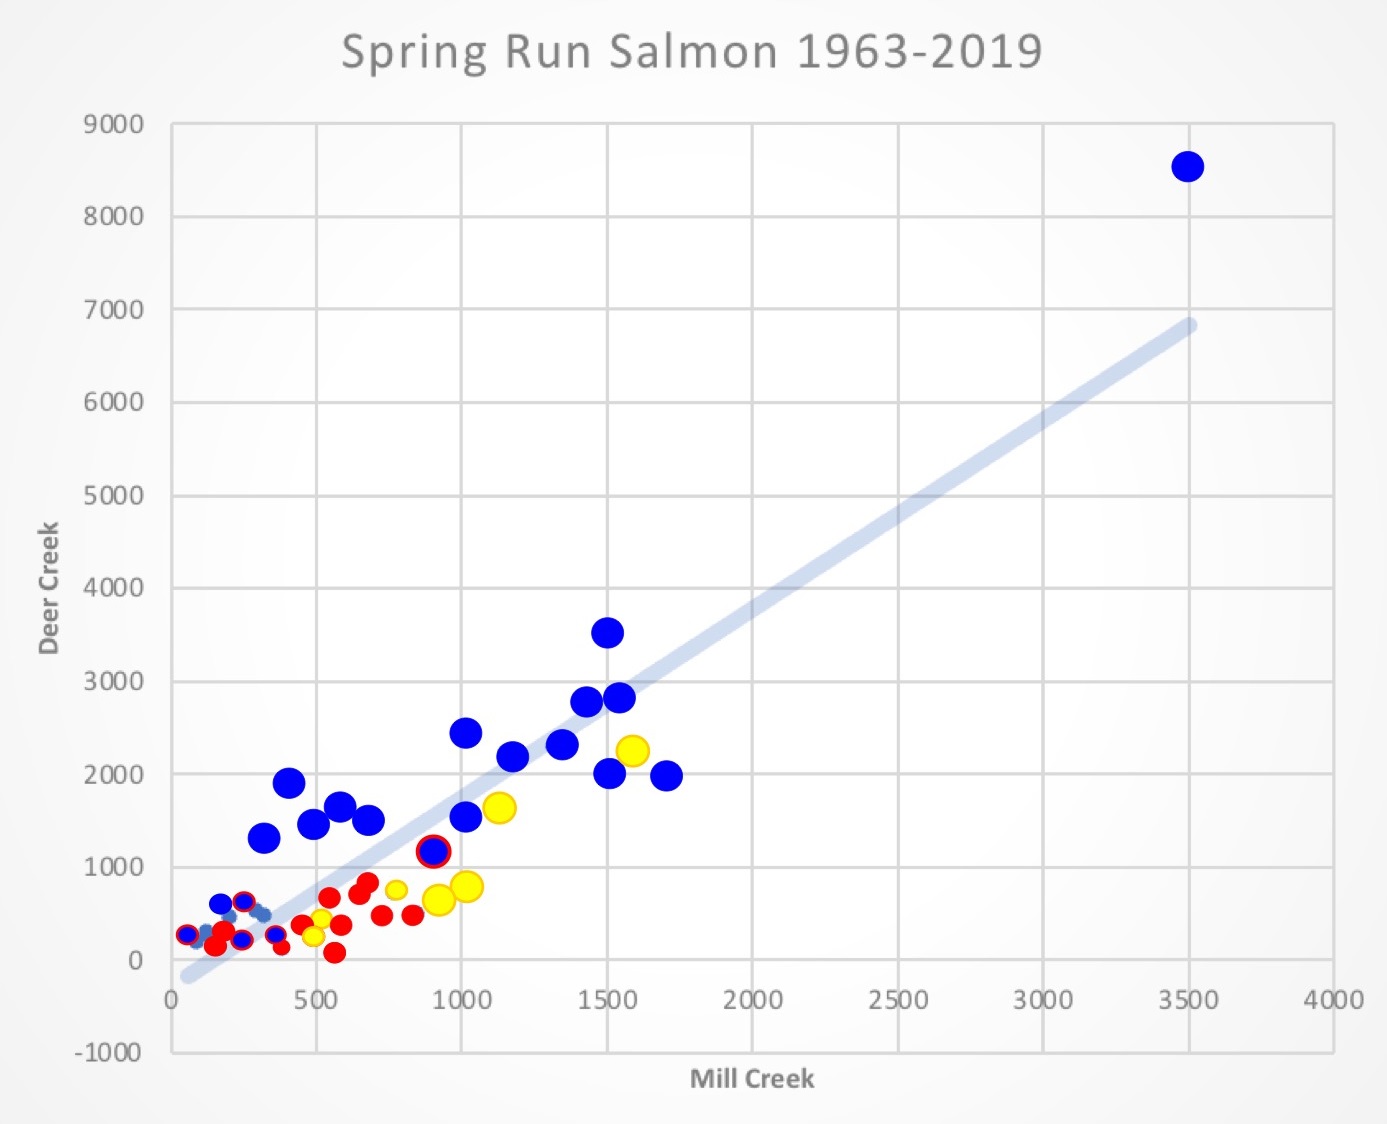
Summer water temperature in the lower reaches of the Sacramento River is heavily influenced by magnitude of flow (Figures 6 and 7). Lower flows promote higher water temperatures. Downstream of Red Bluff, water temperature depends on air temperature, the magnitude of flow, and how fast the river flows. Lower flow magnitudes reduce the speed with which water moves downstream. Smaller thermal mass of water at low flows, combined with the slower rate with which water moves downstream, causes water to pick up more thermal energy and get warmer quicker. In the lower reaches of the Sacramento River, water no longer depends on the temperature of the water released from Shasta and Keswick reservoirs.
In summary, water temperature in late spring through early fall in the Sacramento River immediately downstream of Keswick Dam is primarily determined by the water temperature of the water released from the dam, not the magnitude of flow. In contrast, flow is the primary management tool available to reduce water temperature in the lower 200 miles of the Sacramento River from late spring through early fall.
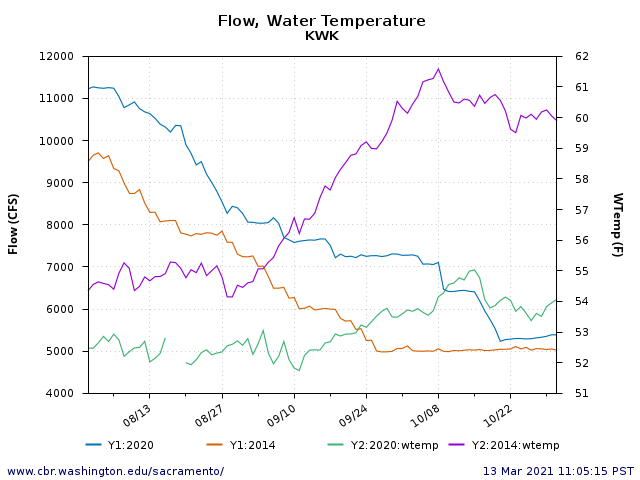
Figure 1. Comparison of water temperature and flow from Keswick Dam in late summer and early fall between critical drought year 2014 and dry 2020.
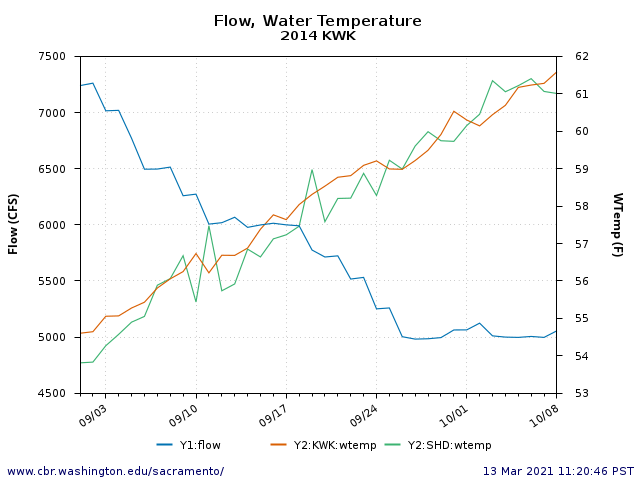
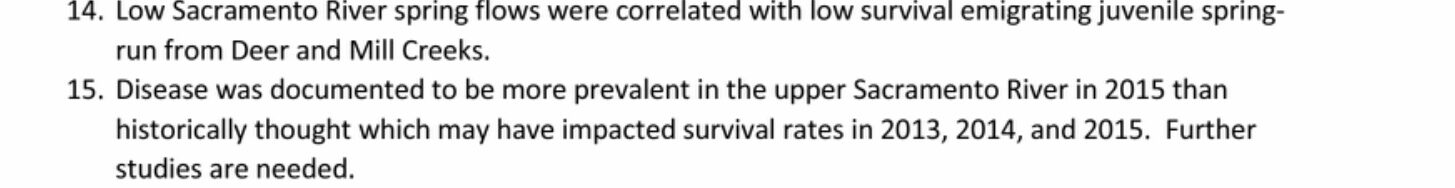
Figure 2. Water temperature immediately below Shasta and Keswick dams, and flow rate below Keswick Dam in September 2014, a critically dry year when access to Shasta Reservoir’s cold-water-pool became limited. Blue line is flow downstream of Keswick. Orange line is Keswick release water temperature. Green line is Shasta release water temperature.
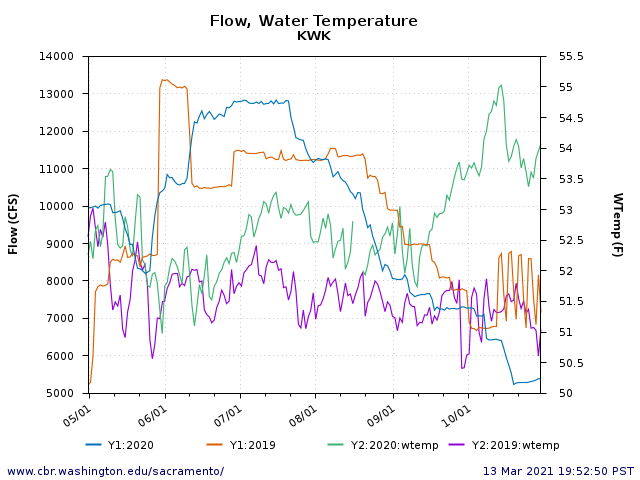
Figure 3. Comparison of 2019 and 2020 summer water temperature and flow below Keswick Dam in the upper Sacramento River. Note substantial loss of water temperature control in mid-September 2020, a consequence of source water temperature, not lower flows.
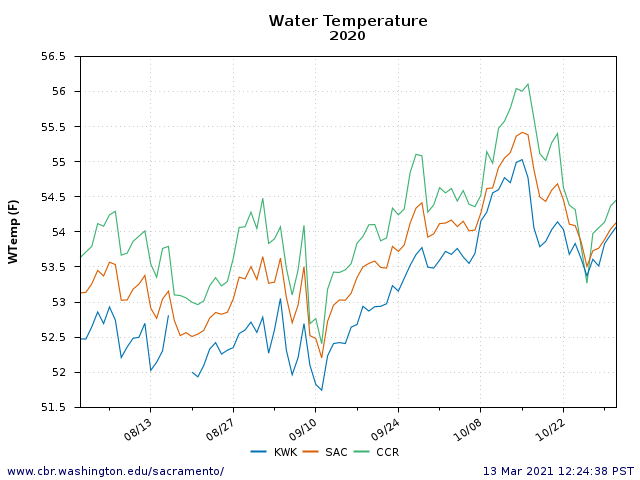
Figure 4. Water temperature in the 10 miles of spawning reach below Keswick Dam in late summer and early fall 2020. Water temperature over the 10 miles increased about 1.0 to 1.5oF. Blue line is Keswick release temperature. Orange line is water temperatures in the Sacramento River at Highway 44, 5 miles downstream Keswick Dam. Green line is the Clear Creek gage on the Sacramento River, 10 miles downstream of Keswick Dam.
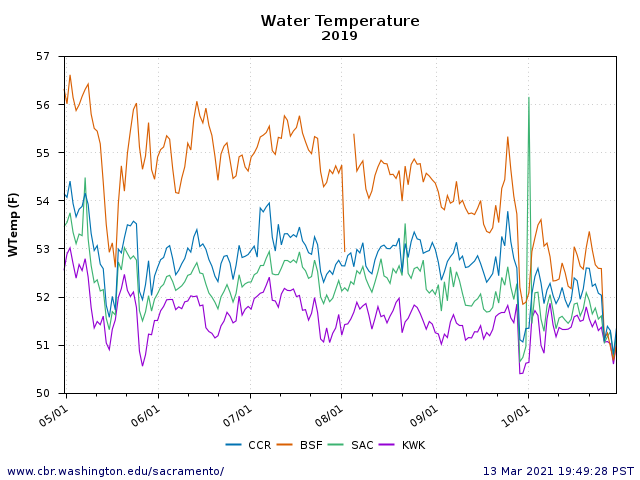
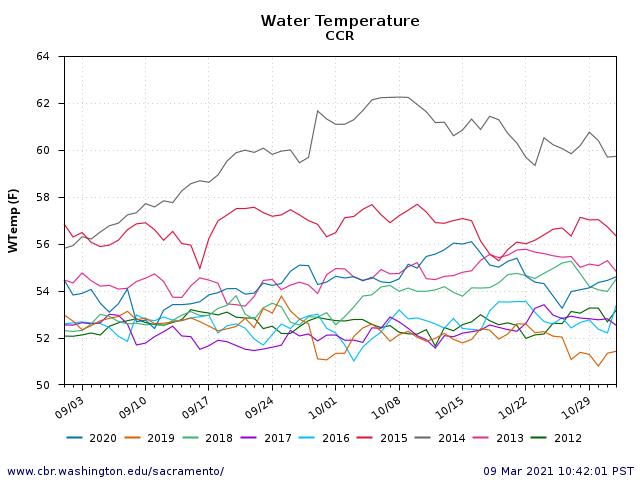
Figure 5. Summer water temperature in the upper 20 miles of the Sacramento River below Keswick Dam, 2019. Note the increase is about 2-4 degrees over the 20 miles. CCR is the Sacramento River at Clear Creek. BSF is Sacramento River at Balls Ferry, 20 miles downstream of Keswick Dam. SAC is Sacramento River at the Highway 44 bridge. KWR is release temperature from Keswick Dam.

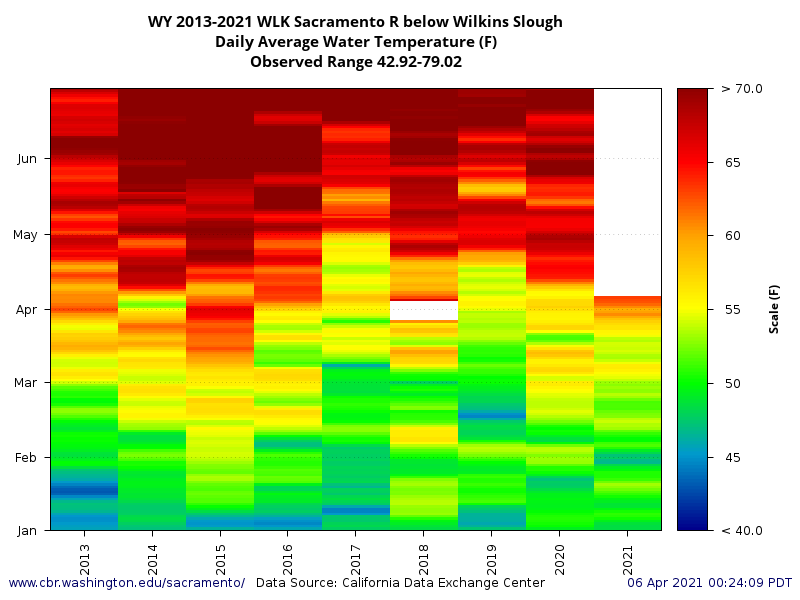
Figure 6. Summer water temperature in the lower Sacramento River at Wilkins Slough (RM 120) 2015-2020. Note the water quality standard is 68oF.

Figure 7. Summer river flow magnitude in the lower Sacramento River at Wilkins Slough (RM 120) 2015-2020.

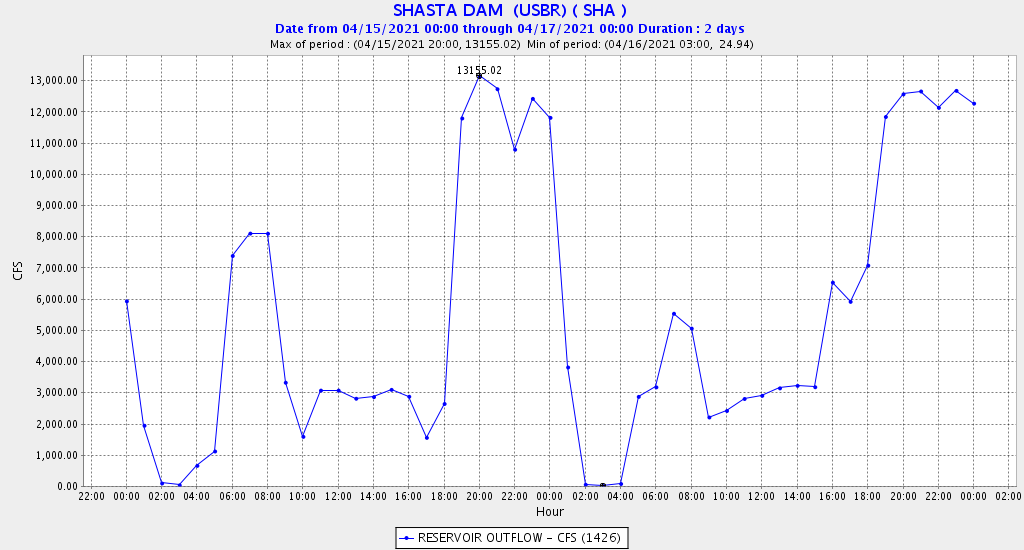
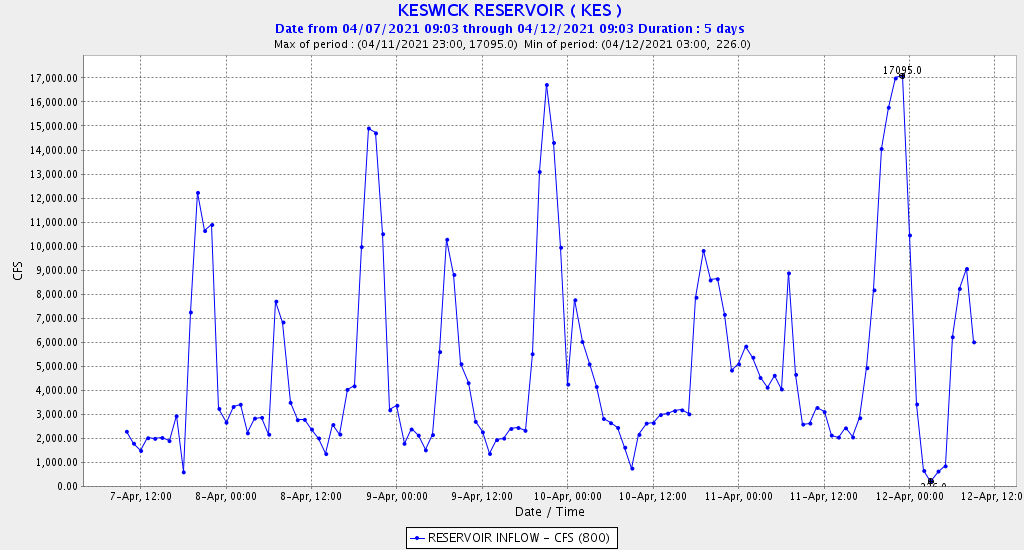
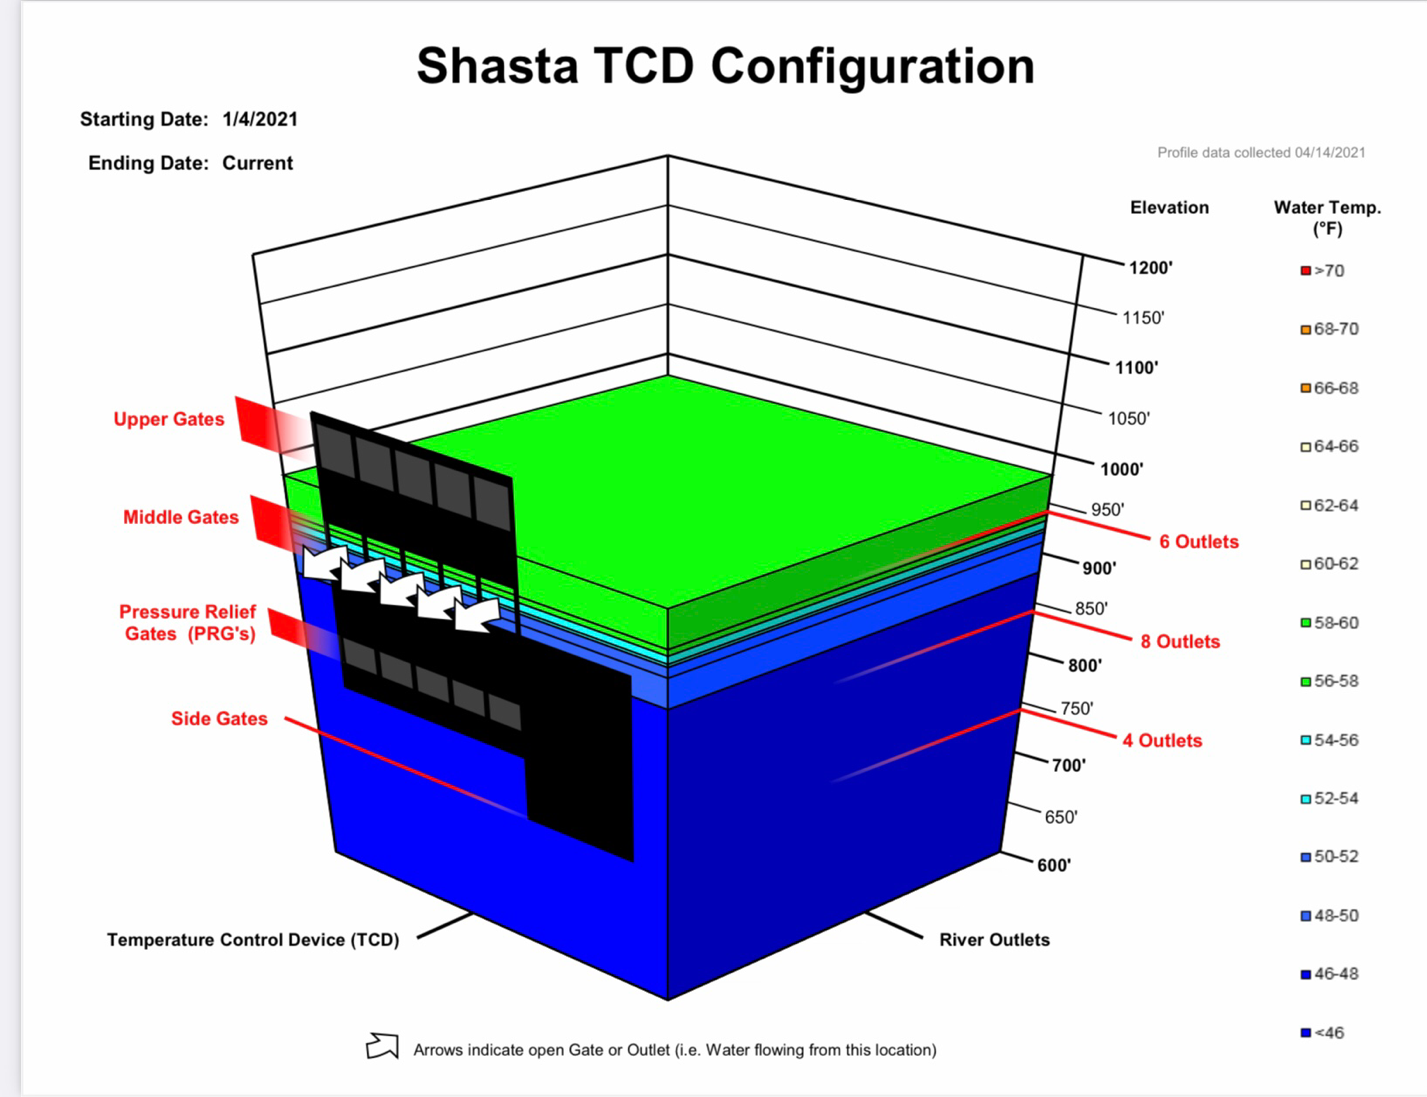
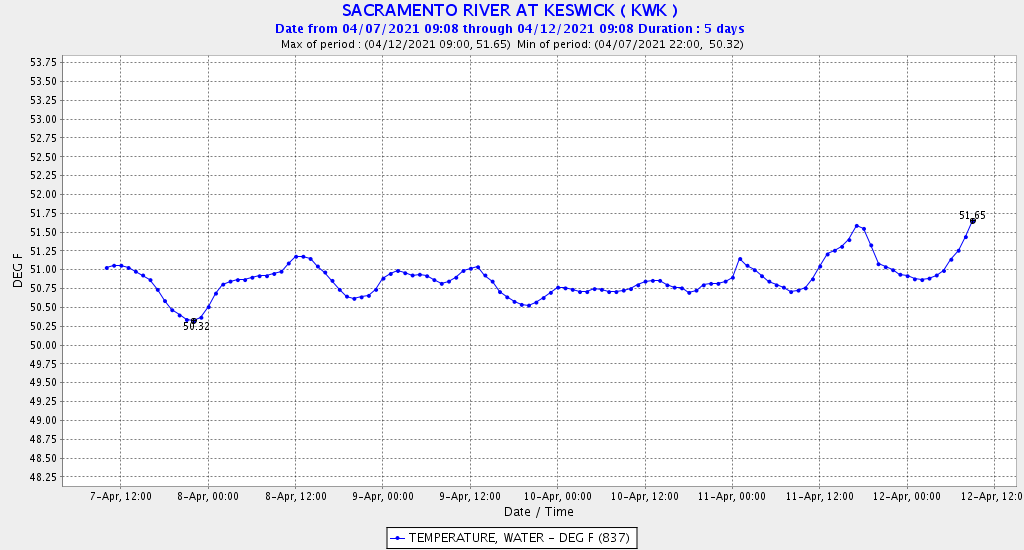
 In the afternoons of 4/15 and 4/16, the Bureau of Reclamation conducted a second set of experiments or tests of the powerhouse bypass at Shasta Dam with the apparent goal of conserving the volume of Shasta Reservoir’s cold-water pool for later in the summer. Reclamation released warm surface water from Shasta Reservoir into upper Keswick Reservoir through the upper river outlets to the dam spillway (see inset at right), bypassing the TCD and powerhouse. Water temperature immediately below Shasta Dam reached values greater than 70ºF in the early afternoon on the 14th and 15th (Figure 1). The river outlet releases occurred between the normal daily peak-power releases through the powerhouse (Figure 2). In the prior test (Exp #1) in the early morning hours of 4/11, water temperature below the dam reached only 55ºF, as some cold water was also being released through the powerhouse.
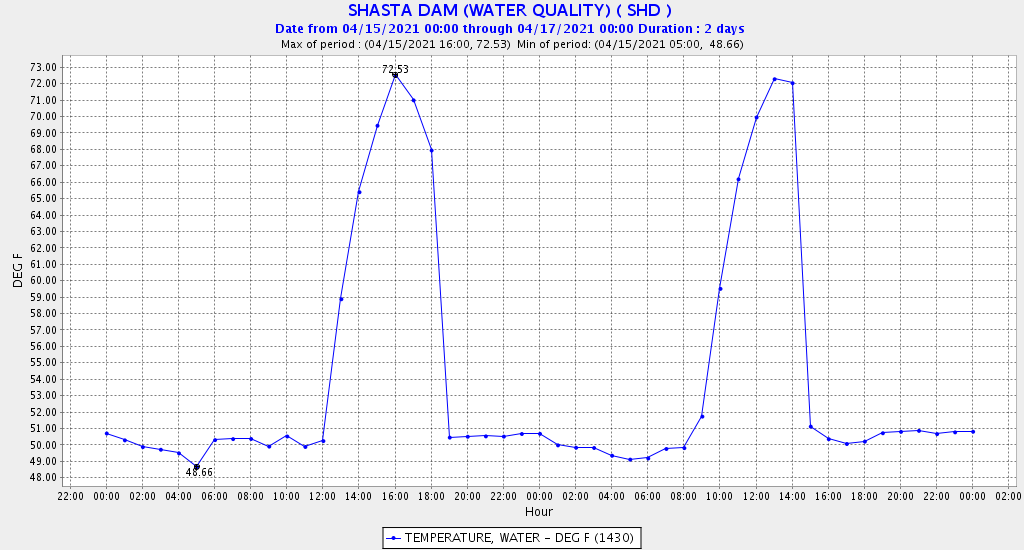
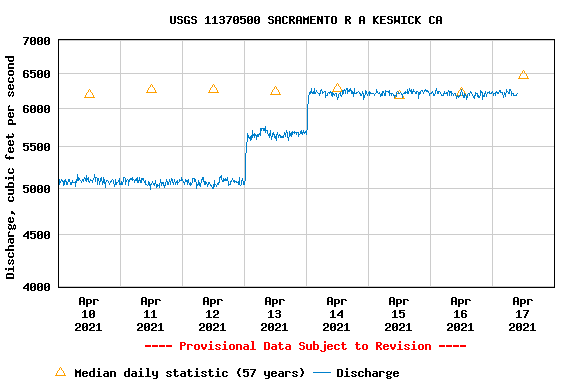

 In the evening of 4/10 and early morning hours of 4/11, the Bureau of Reclamation began releasing warm surface water from Shasta Reservoir through the upper river outlets to the dam spillway (see inset at right), bypassing the Shasta Temperature Control Device (TCD) and the Shasta powerhouse, forgoing power production.
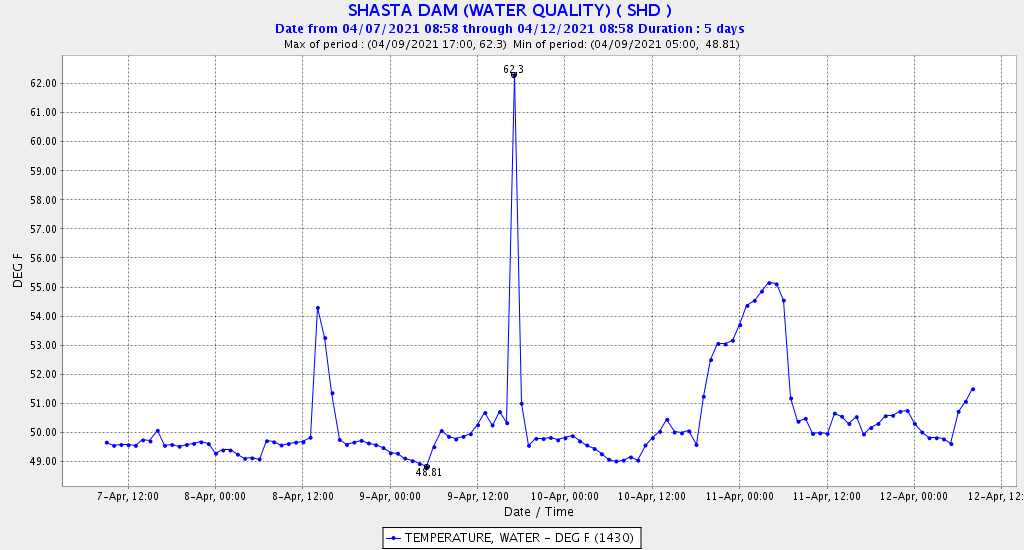
