Welcome to the California Fisheries Blog

The California Sportfishing Protection Alliance is pleased to host the California Fisheries Blog. The focus will be on pelagic and anadromous fisheries. We will also cover environmental topics related to fisheries such as water supply, water quality, hatcheries, harvest, and habitats. Geographical coverage will be from the ocean to headwaters, including watersheds, streams, rivers, lakes, bays, ocean, and estuaries. Please note that posts on the blog represent the work and opinions of their authors, and do not necessarily reflect CSPA positions or policy.

Partnership Shares Science to Find Fish and Water Solutions

“This month six California and federal agencies representing water management, fish, and wildlife, along with the Sacramento River Settlement Contractors, signed onto the Sacramento River Science Partnership. The Partnership establishes an interagency science collaborative in which members will develop, share and discuss science to inform water management activities and protection of fish in the mainstem Sacramento River.” (8/25/20 News Release)

  •  The seven signatories will foster and advance science to inform sustainable solutions to water management challenges including conflicts between water supply delivery and fish survival.

The time when anyone thought that the problems confronting Central Valley salmon could be solved with more science is long gone. The problems and solutions have not really changed in the 40+ years I have been involved. And the problems are only getting worse. Why is it so hard to address them?

The Problems

As a consequence of rainfall, snowmelt, reservoir storage and release, and water diversions, flows in the Sacramento River, have become so low and erratic that they strand salmon spawning redds and create prolonged high water temperatures in the juvenile rearing and migration reaches of salmon. It is a wonder that there are any wild salmon left. Without hatcheries, there would be few if any salmon in the Central Valley at all.

Spring-Summer Water Temperatures

Spring-summer water temperatures in the lower Sacramento River are bad. They kill salmon and sturgeon, block migrations, lead to poor juvenile salmon growth, early migration, high predation, and cause huge predation problems for young hatchery and wild salmon. The high temperatures exceed state water quality standards and water project permit requirements. Yes, water temperatures were bad during the 2013-2015 critical drought, as might be expected (Figure 1). But they have also been bad in the five normal and wet years (2016-2020) since the drought (Figure 2). The safe level is 65°F, but the standard is set at 68°F, above which stress and higher mortality occurs. 68° is supposed to be an upper limit that should not be exceeded, and in past decades it rarely was. It is now the accepted norm, and even then it is not enforced.

In 2020 (Figure 3) spring water temperatures were detrimental to the upstream migration of endangered winter-run and spring-run salmon, emigrating juvenile fall-run salmon, and larval and juvenile sturgeon. High summer temperatures hinder migration of adult fall-run salmon and are detrimental to survival of winter-run fry, over-summering late-fall-run and fall-run salmon smolts, and rearing juvenile sturgeon.

Fall Drops in Water Levels

Often, usually in October-November, flow releases from Shasta reservoir drop sharply in response to decreasing downstream irrigation demands. The decreases lead to fall-run salmon redd dewatering in the upper river spawning area near Redding and poor habitat and emigration flows for winter-run and late-fall run juvenile salmon.

Stranding

Adult and juvenile salmon are stranded throughout the Sacramento River floodplain after winter-spring, high-flow events. In addition, drops in water surface elevation of four feet in the fall (Figures 4 and 5), soon after spawning de-water the vast majority of fall-run spawning redds in the 20-mile spawning reach downstream of Keswick Dam. Drops in flows after floodway weir spills (Figures 6 and 7) strand adult salmon and sturgeon that are migrating upstream, and also strand juvenile downstream emigrants in the Sutter and Yolo floodway bypasses.

Hatchery Releases

Releases of millions of hatchery-raised salmon and steelhead smolts in winter and spring into the lower Sacramento River from federal and state hatcheries compromise wild salmon and steelhead fry, fingerling, and smolt survival throughout the lower Sacramento River. Hatchery salmon and steelhead prey upon and compete with wild salmon and steelhead, and attract non-native predatory striped bass that also feed on wild salmon and steelhead.

Solutions

A new science plan for the upper reaches of the lower Sacramento River is not going to solve the problems that stem from failure to act on what science has told us for decades.

Solutions to the problems outlined above abound. These solutions are well documented in the Central Valley Salmon and Steelhead Recovery Plan (NMFS 2014) and other stakeholder plans.1 The most important solution, is water temperature limits in the lower Sacramento River, which were adopted decades ago in state water permits and water quality control plans. These limits designed to protect salmon are simply no longer enforced.
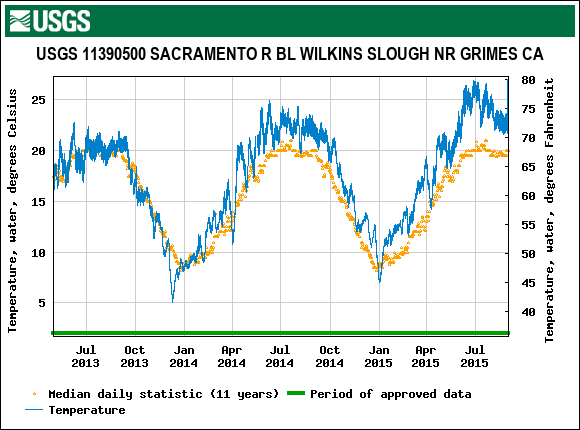
Figure 1. Water temperature in the lower Sacramento River from 2013-2015 critical drought years near Grimes, CA. Also shown is average for the past 11 years of record. https://nwis.waterdata.usgs.gov/nwis/
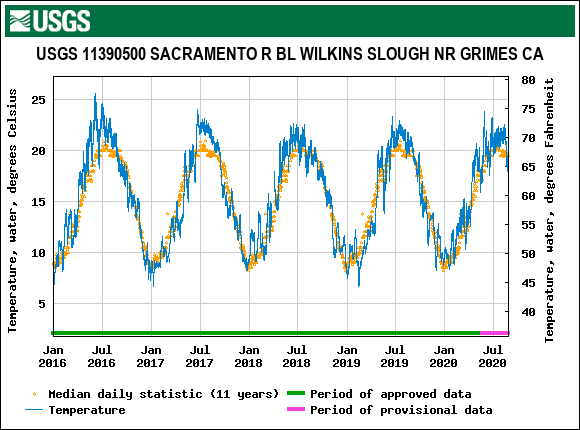
Figure 2. Water temperature in the lower Sacramento River from 2016-2020 post-drought years near Grimes, CA. Also shown is average for the past 11 years of record.
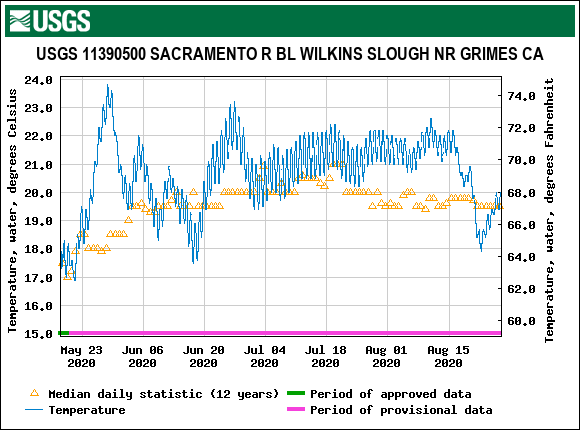
Figure 3. Water temperature in the lower Sacramento River in 2020 near Grimes, CA. Also shown is average for the past 11 years of record.
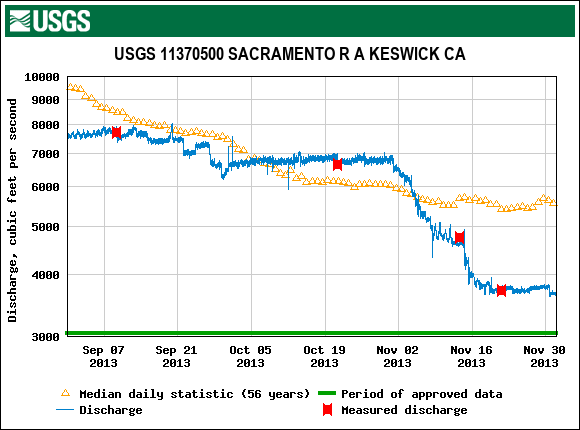
Figure 4. Sacramento River flows in fall of 2013 below Keswick Dam near Redding.
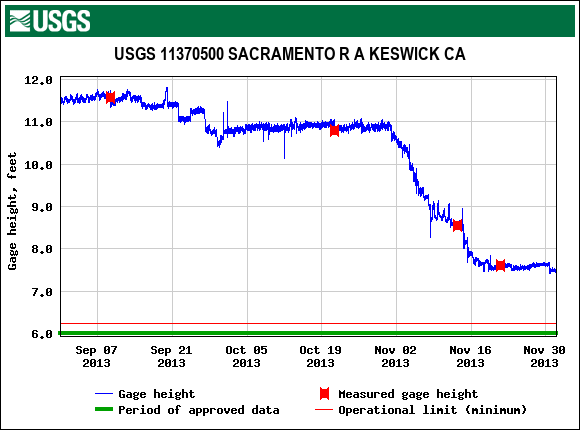
Figure 5. Sacramento River water surface elevation in fall of 2013 below Keswick Dam.

Figure 6. Spills of water from Sacramento River over Tisdale flood control weir during the period from December 2013 to February 2015. Source: CDEC
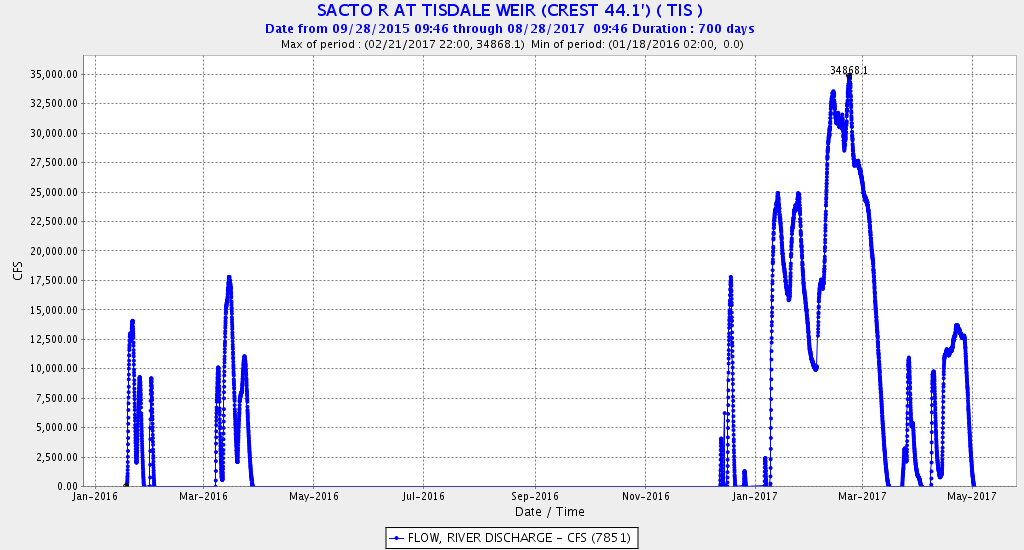
Figure 7. Spills of water from Sacramento River over Tisdale flood control weir during the period from January 2016 to May 2017. Source: CDEC
Franks Tract Futures Project

The Franks Tract Futures Project is asking for additional comments on the State’s revised concept design.1 The project is an outgrowth of the State’s 2016 Delta Smelt Resilience Strategy, which recognized that Franks Tract is a death trap for state and federally listed Delta smelt.

The original design for the project included tide gates to keep salt and smelt from moving upstream from the western Delta into Franks Tract via the False River channel. Once in Franks Tract, the smelt would most assuredly not survive. A new design “transforms the project from an early focus on establishing habitat for the endangered Delta smelt to a project that has sought input from a broad range of stakeholders.” According to the project leader, Brett Milligan from University of California:

Balancing the project’s goals has been a challenge. The first round of this project, the feasibility study, met the water quality and ecology requirements but did not meet the recreational and local economy (requirements). We heard you loud and clear. More or less, this entire last year has been to try to bring in that third tier and to balance these and see if there’s a way that the project can meet all of these criteria and be beneficial to all. The original project design failed to earn public support after it was presented in January 2018. At a crossroads, the project managers made a critical decision. They scrapped the proposal and formed an advisory committee of stakeholders with varied interests in Franks Tract rather than try to force the initiative through the process, while fighting the public every step of the way.

The new design drops the barrier/gate option as “a non-starter,” Brett explained to me. But that was the essential element of the project – stopping salt (and smelt) intrusion into the interior Delta due to the pull of the south Delta export pumps. A temporary barrier has been installed in False River in drought years to protect Delta water supplies.

The conflict is over recreational access to Franks Tract from the west via False River. A similar barrier on Montezuma Slough further west in Suisun Marsh resolved a similar conflict with a boat passage lock that maintains boating access when the barrier is in use.

At this phase of design and permitting, it would seem wise to evaluate an alternative with the barrier that includes a similar boat passage facility, so that the affected public can understand the tradeoffs. That is the purpose of the environmental review process.

Saving Native Central Valley Salmonids

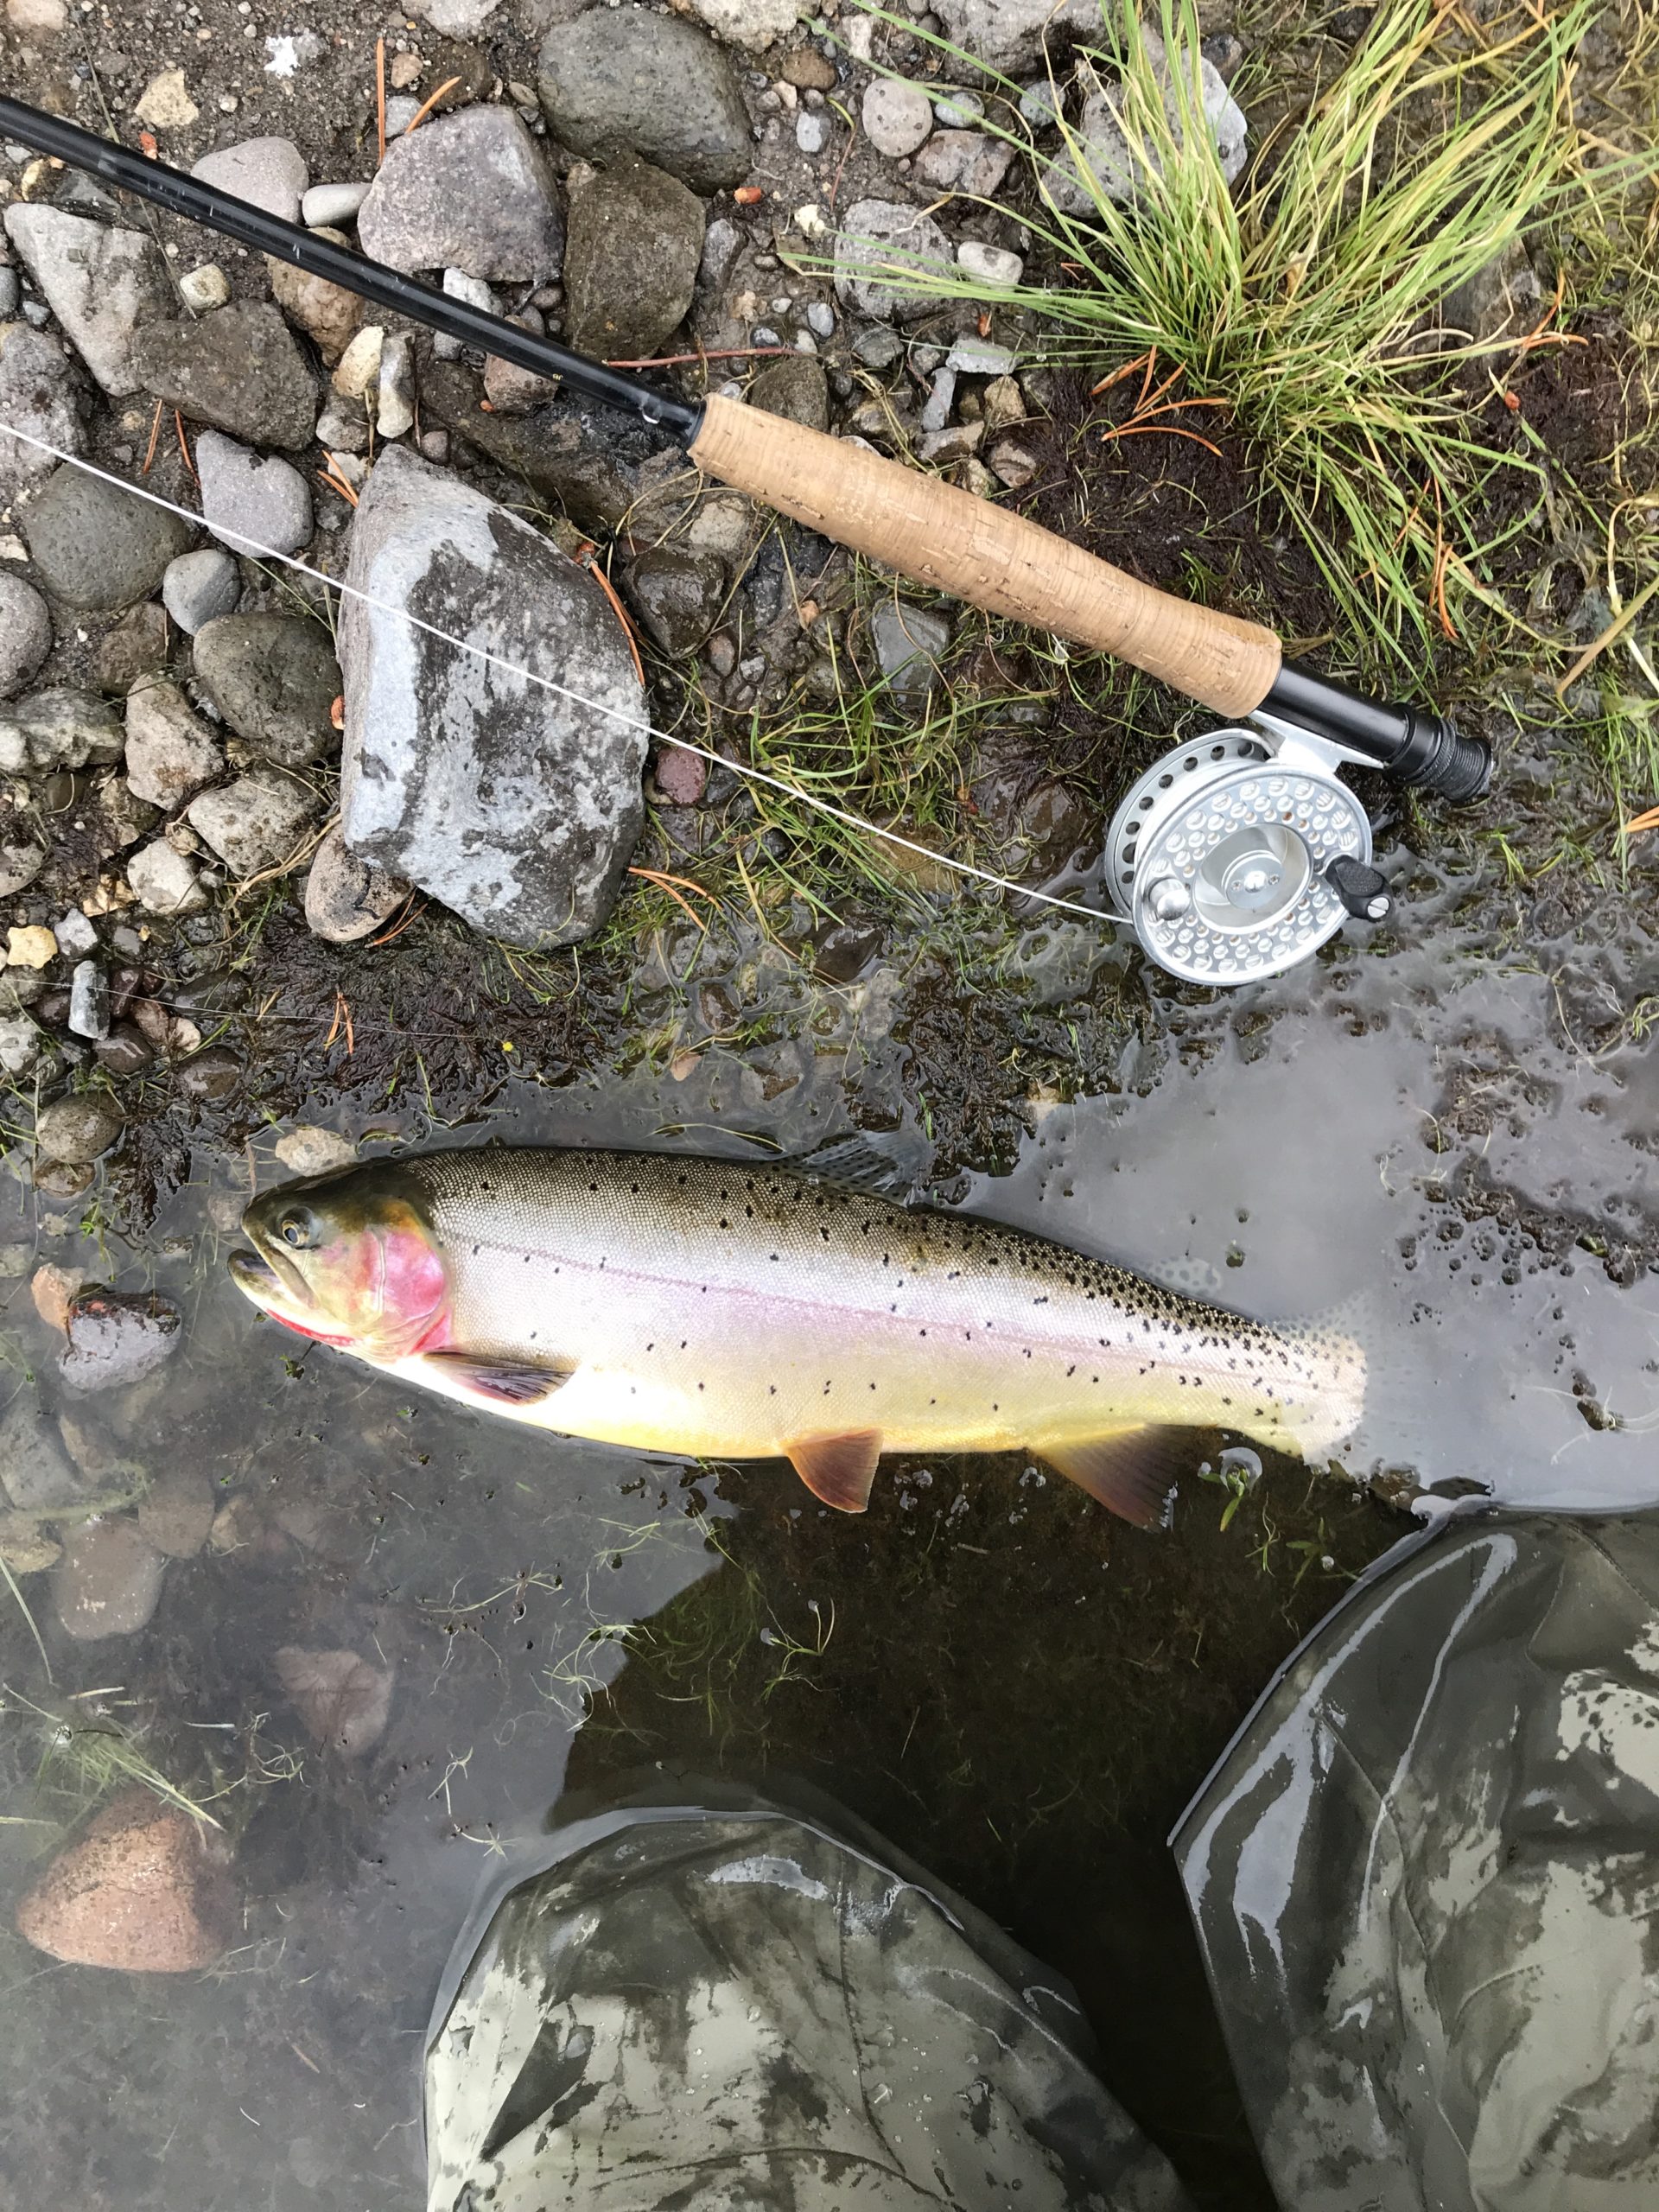
No, the fish below is not a Central Valley salmon or trout. It is a Yellowstone Cutthroat Trout from the Yellowstone River in Yellowstone National Park. This iconic species is beginning to recover from competition and predation by non-native brook, brown, rainbow, and lake trout. Yellowstone Park over the past decade has carried out an intensive eradication program of the non-native salmonids to save the iconic native cutthroat. A similar program has been underway to save the Snake River Cutthroat on the South Fork of the Snake River from Grand Teton Park in Wyoming downstream into Idaho. The eradication programs include rotenone poisoning of tributaries, gill-netting (lake trout in Yellowstone Lake), and regulations requiring angler removal (rainbow trout).

Yellowstone Cutthroat Trout caught and released in the Yellowstone River in Yellowstone National Park summer 2018

California has excellent programs to protect some of its iconic trout and salmon through strict regulations and habitat protection and enhancement.

  • Redband Rainbow Trout in the upper McCloud River
  • Golden Trout in the upper Kern River
  • Lahontan cutthroat of the Truckee drainage.
  • Coastal cutthroat (NorthCoast streams)
  • Paiute cutthroat of the eastern Sierras.
  • Winter Run Chinook salmon (endangered) spawning grounds upstream of Redding are now closed to trout angling.
  • Spring Run Chinook Salmon (threatened) spawning tribs protected
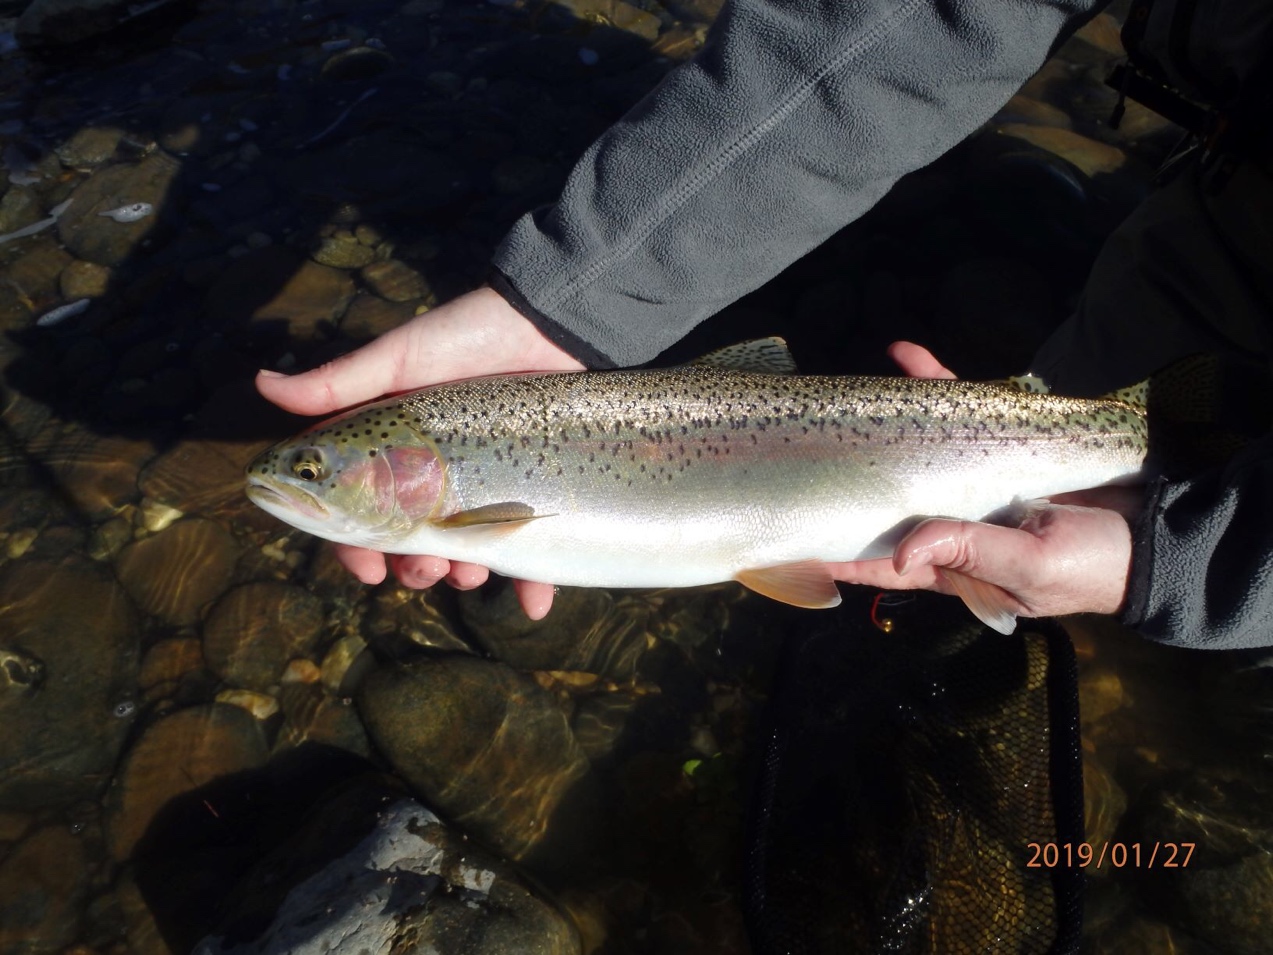
  • Wild steelhead – no harvest in mark-selected fisheries (photo below)

Wild Rainbow Trout/Steelhead caught and released in the lower Yuba River near Marysville January 2019.

One survival bottleneck that needs opening for salmon and steelhead in the Central Valley is predation by non-native fish. There is a long list of non-native and native predators from which native fish need protection. The best protection is to minimize native-nonnative habitat interactions. That can best come from adequate physical-geographical habitat and habitat water quality for natives while minimizing non-native fish habitat. Changes are necessary because of global warming and continually increasing demands on water. Stream flows are too low, water temperatures are too high, waters are clearer, and in-stream cover is low, factors that all favor non-native predators and competitors.

Because many of the non-natives are sportfish with strong angler followings, non-lethal controls best serve to reduce overall predation effects on native fishes.

  • Provide natural spring flow pulses in rivers and tributary tailwaters to help emigrating salmonids avoid predators.
  • Keep water temperatures lower in rearing habitat and migrating routes of native fish.
  • Maintain the low salinity zone, the primary rearing area for native fishes, in the Bay downstream of the Delta.

At some point population controls on non-native fish may have to be considered despite their inherent problems and low potential for success.1 Note that despite the use of 50 miles of gill nets and removal of hundreds of thousands of pounds of lake trout each year in Yellowstone Lake, lake trout remain abundant. Predator control through removal would be far more difficult in the Central Valley and Bay-Delta.

Summary and Conclusion

I remain skeptical on how effective the individual actions can be, but a comprehensive multi-action program such as that employed for the Yellowstone Cutthroat Trout has some chance of success. Such a program would come with tough choices and require considerable resources, but may need to be part of saving Central Valley salmon and steelhead. Focus should be on increasing the amount of native fish habitat and bettering spawning, rearing, and migratory habitat conditions.


June 2020 Delta Outflow – New State Standard Needed

I recommended a new June Delta outflow standard of 10,000 cfs in a post on June 23 2020. This increase from the current standard of 7000 cfs would keep salt and Delta smelt out of the Central Delta and better maintain adequate water temperatures for emigrating Central Valley salmon smolts.

In this post, I consider the recommended 10,000 cfs value in the context of how the California Department of Water Resources (DWR) and the Bureau of Reclamation (Reclamation) estimate Delta outflow as they manage Delta hydrology and federal and state exports from the south Delta. This should further explain why an increase in the June Delta outflow standard is necessary.

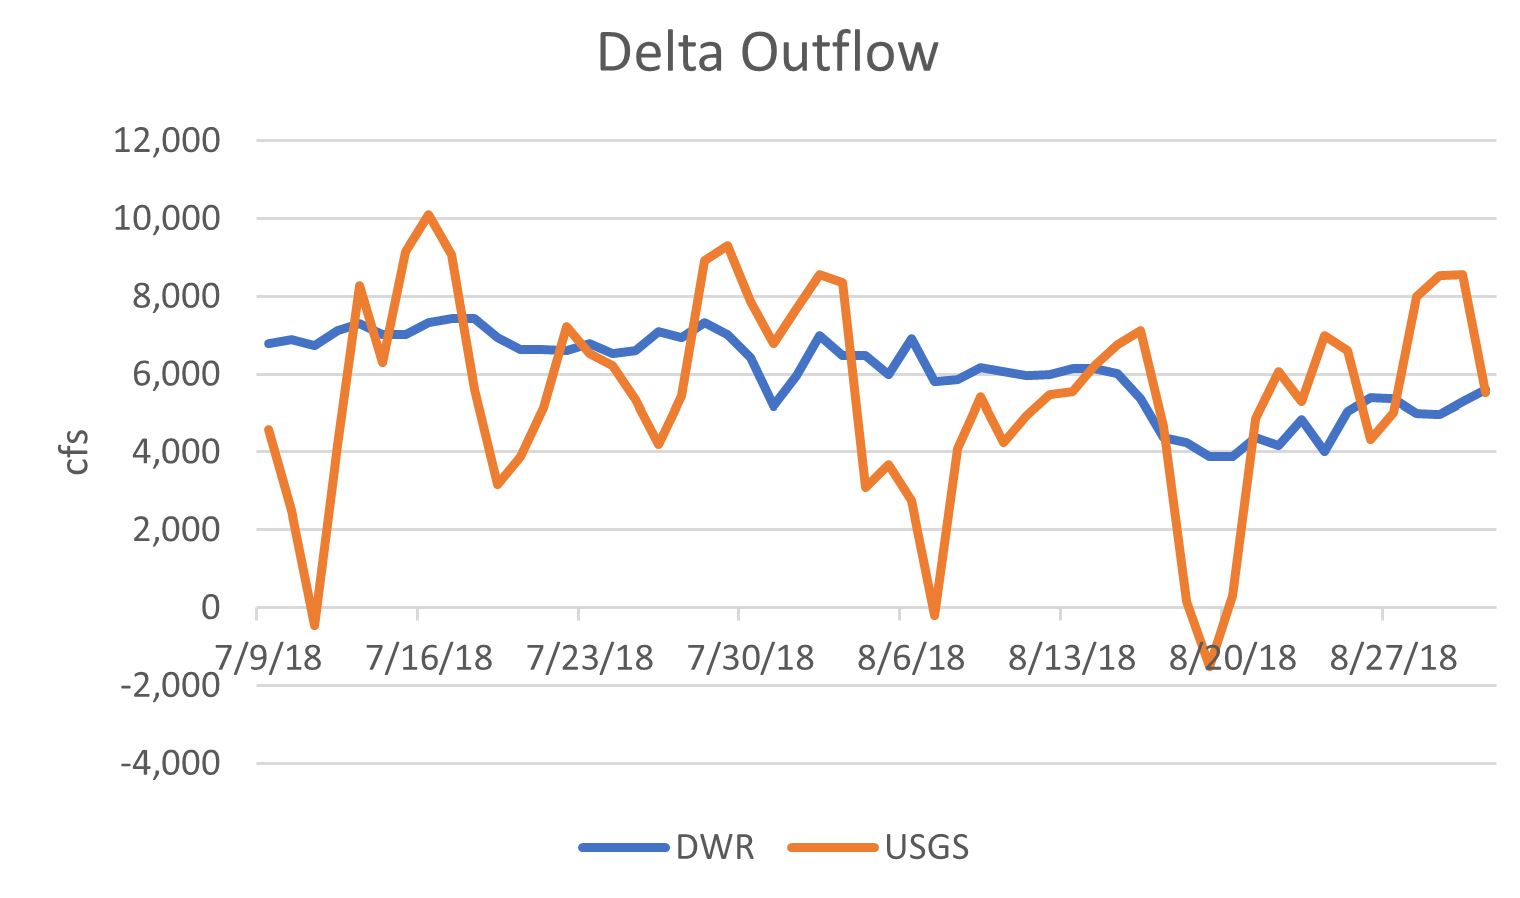
It helps to recall my description in a September 2019 post how DWR and Reclamation estimate Delta outflow: “Delta Total Outflow is a daily-average algorithm calculated in cubic feet per second (cfs) for Station DTO, a hypothetical location near Chipps Island in Suisun Bay.“ This is different from the US Geological Service’s (USGS) method of calculating real-time outflow. As an example, I overlaid the DWR and USGS for the summer of 2018 (Figure 1).

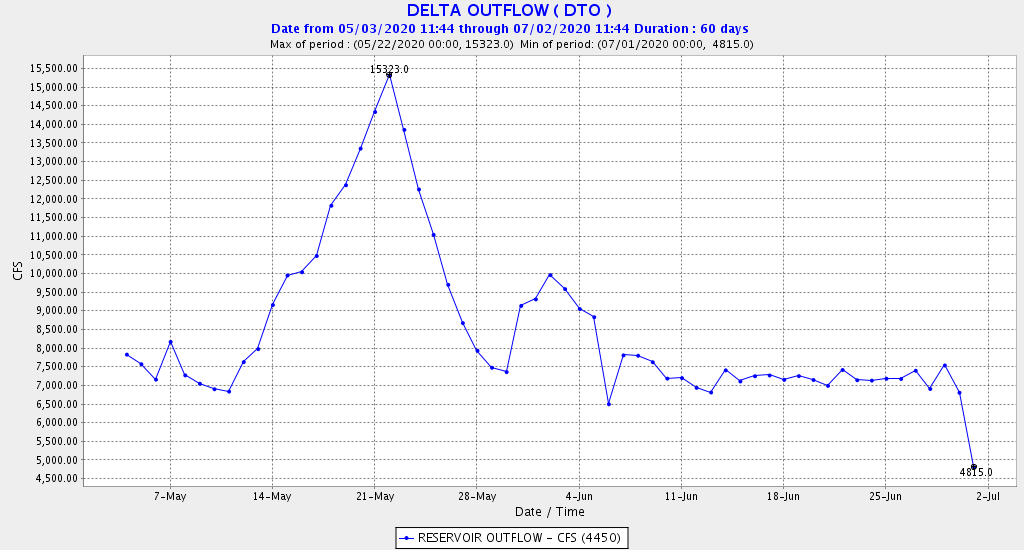
The State’s D-1641 June water quality standard is: the monthly average of the average outflow for each day must meet or exceed 7000 cfs (monthly average of daily averages). DWR and Reclamation comply with this standard using their own estimation method, not real-time outflow. Figures 2 and 3 below show the differences in the DWR and USGS methods in May-June 2020.

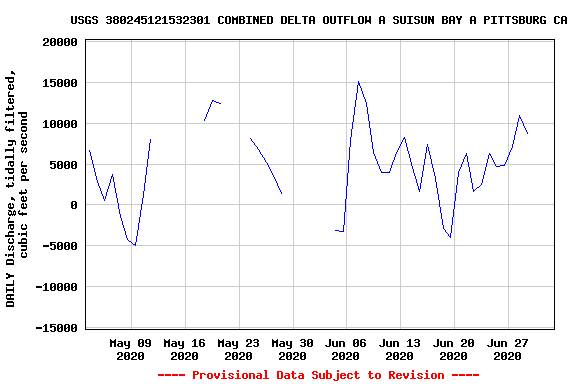
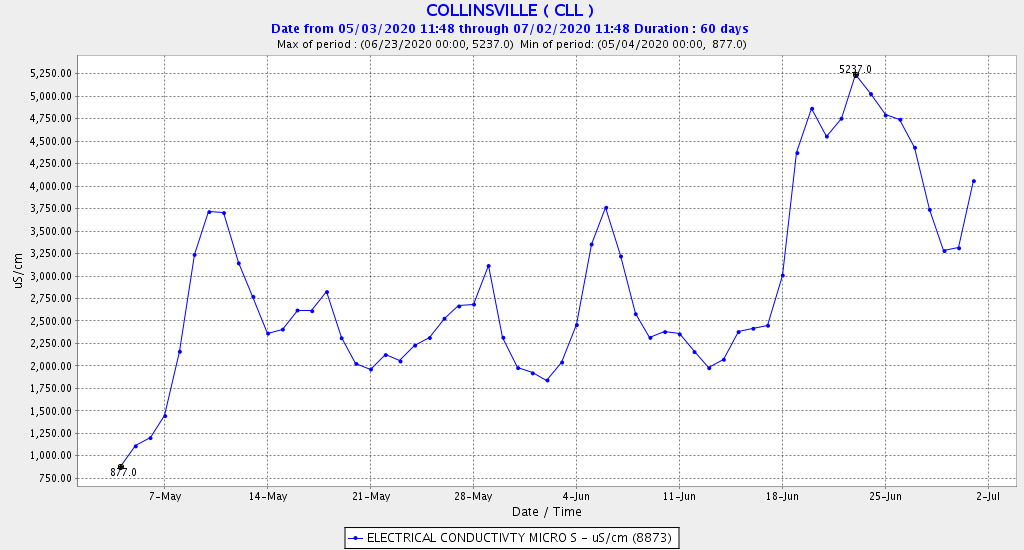
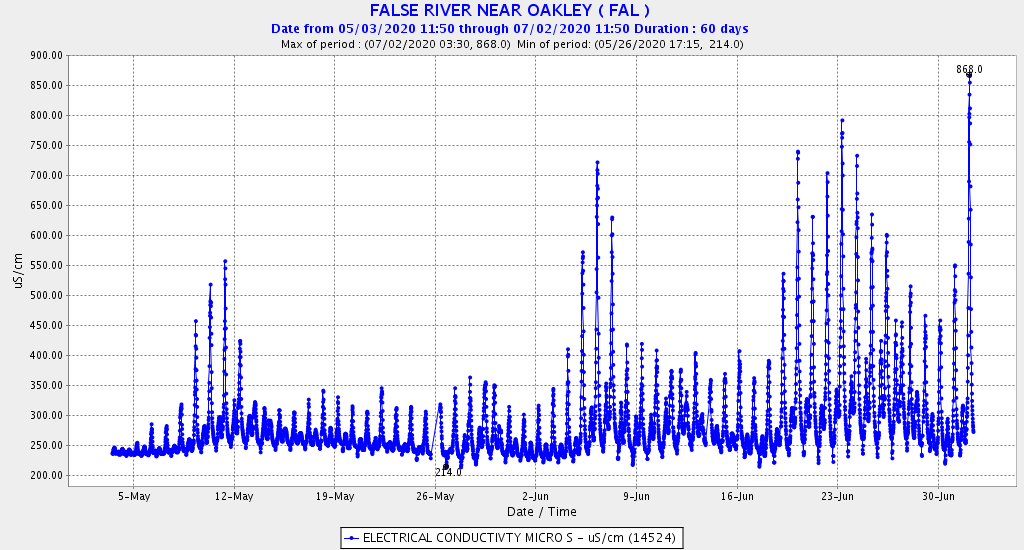
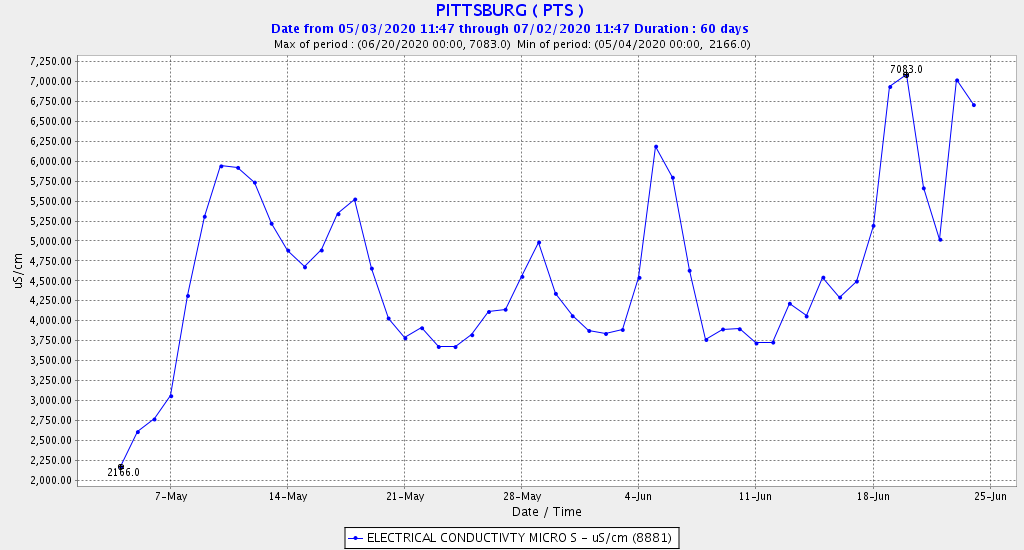
In May-June 2020, DWR and Reclamation maintained Delta outflow (using their own estimation method) near 7000 cfs, except during a mid-May storm when estimated outflow reached a peak of 15,300 cfs (Figure 2). But viewed from a different perspective, there were significant dips in the USGS estimation of outflow during spring tides around June 5 and June 19. The DWR method of estimating didn’t pick up these dips at all. These periods where USGS showed negative net outflow showed up in the monitoring of salinity as well (Figures 4-6). Periods of low or negative outflow were also periods of high salinity at key Delta monitoring stations.

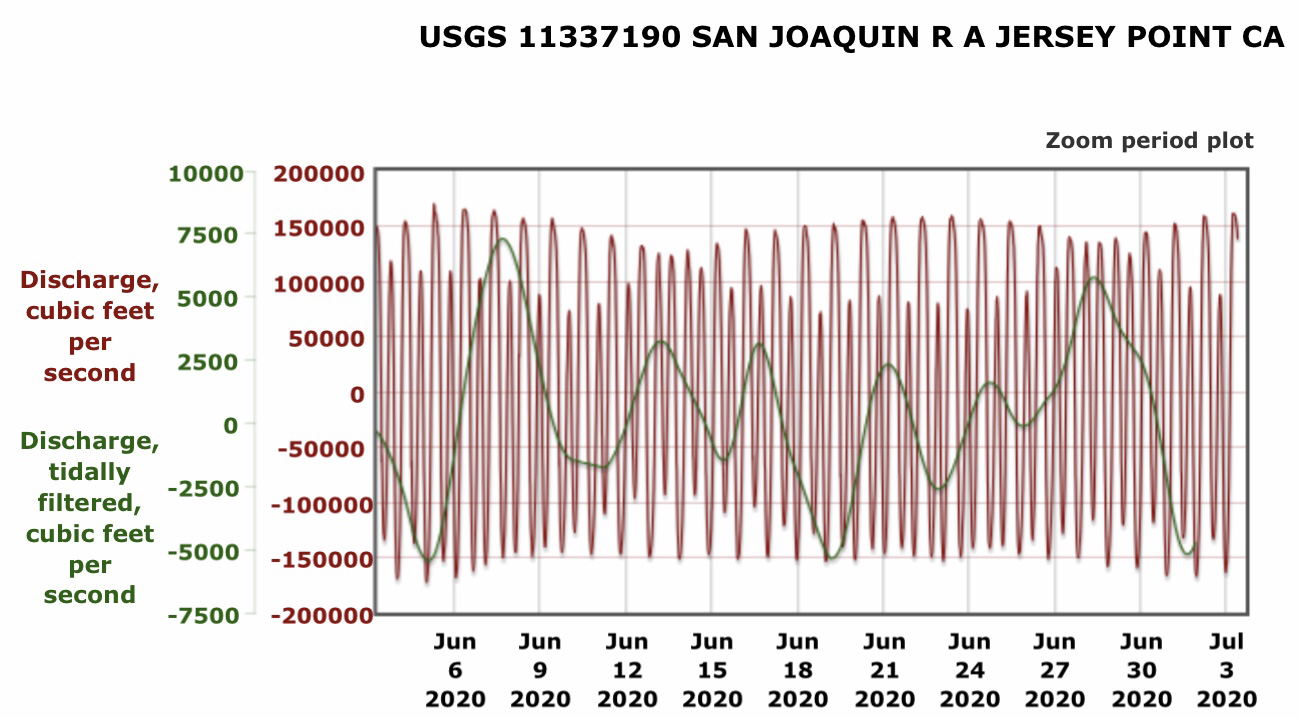
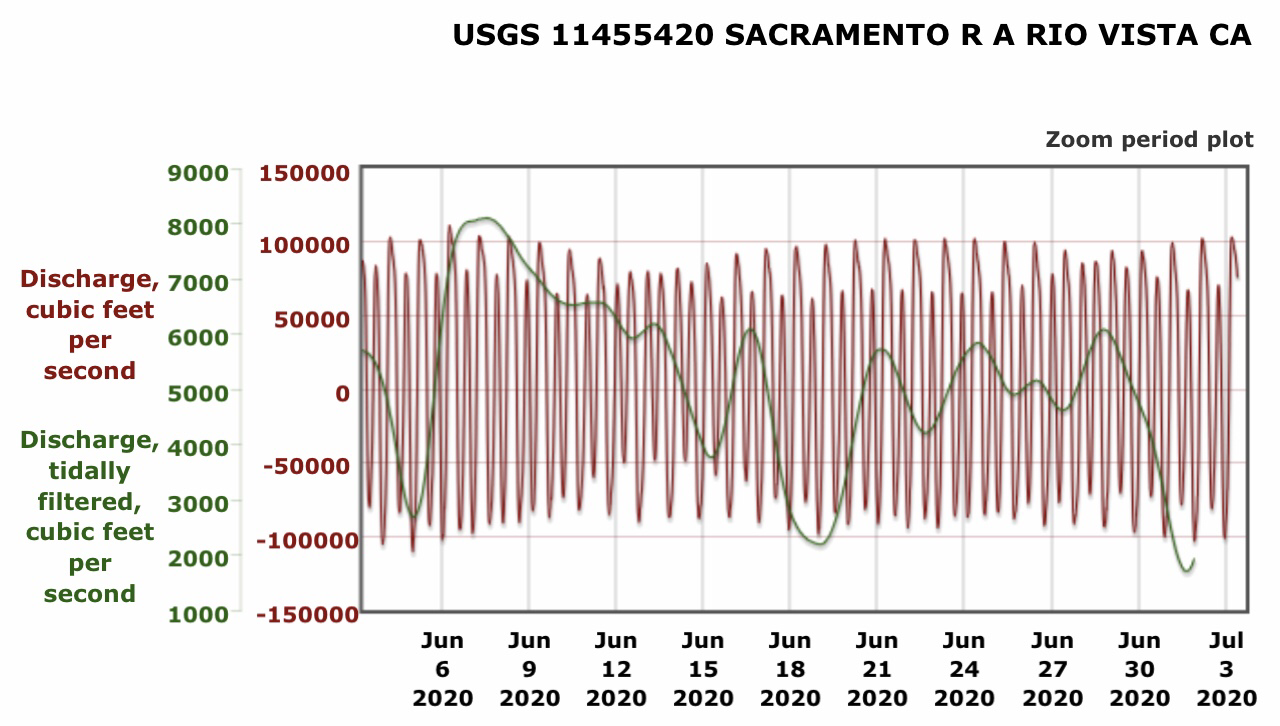
Although net daily Delta flows are relatively small compared to real-time tidal flows (Figures 7 and 8), net flows affect water quality and fish habitat conditions on a daily basis. The salinity data for May-June 2020 at False River (Figure 5) is particularly significant. (Note the spikes in salinity during spring tides around June 5 and June 19). False River is the gateway to Franks Tract. As salinity increases in False River, smelt will move upstream (towards lower salinity conditions) in Franks Tract. As I described in an April 28, 2020 post, Franks Tract is a “smelt trap” where smelt that enter almost invariably perish.

Increasing the standard for June Delta outflow so that the required monthly average of the average outflow for each day is 10,000 cfs, not 7,000 cfs, would not fully offset the effects of spring tides and the use of averaging in DWR’s method of calculating compliance. But it would help protect Delta habitat from salt intrusions during spring tides and keep the low salinity zone and young Delta smelt out of the Delta. Although DWR and Reclamation did a good job in May-June 2020 of staying above 7000 cfs each day using their calculated outflow method, adding an explicit minimum daily flow standard to the monthly flow standard could also help. This would likely have the result of reducing exports during periods of the spring tides in the monthly lunar tidal cycle.

Figure 1: Daily outflow estimated by DWR and USGS in summer 2018.

Figure 2.  DWR’s calculated Delta outflow in May-June 2020.  Note switch to July standard of 5000 cfs

Figure 2. DWR’s calculated Delta outflow in May-June 2020. Note switch to July standard of 5000 cfs outflow on July 1. Source: CDEC.

Figure 3. USGS’s estimate of tidally filtered Delta outflow as estimated in May-June 2020. Spring-tides occurred May 9, May 23 (not measured because of storm inflows), and also on June 5 and June 19. Note dips in outflow on June 5 and 19; these dips do not appear in DWR’s estimate in Figure 2.

Figure 4. Salinity (conductivity) in eastern Suisun Bay at Collinsville in May-June 2020. Note peaks in salinity during net negative outflow with spring tides on June 5 and 19 (see Figure 3).

Figure 5. Salinity (conductivity) in False River in west Delta in May-June 2020. Note peaks in salinity during net negative outflow with spring tides on June 5 and 19 (see Figure 3).

Figure 6. Salinity (conductivity) in eastern Suisun Bay at Pittsburg in May-June 2020. Note peaks in salinity during net negative outflow with spring tides on June 5 and 19 (see Figure 3).

Figure 7. Hourly river flow and tidally filtered flow in lower San Joaquin River channel in western Delta at Jersey Point in June 2020. Note highly negative peak flows with spring tides on June 5 and June 19.

Figure 8. Hourly river flow and tidally filtered flow in lower Sacramento River channel in western Delta at Rio Vista in June 2020. Note spring tides on June 5 and June 19.

Delta Smelt Sanctuary – Deepwater Ship Channel

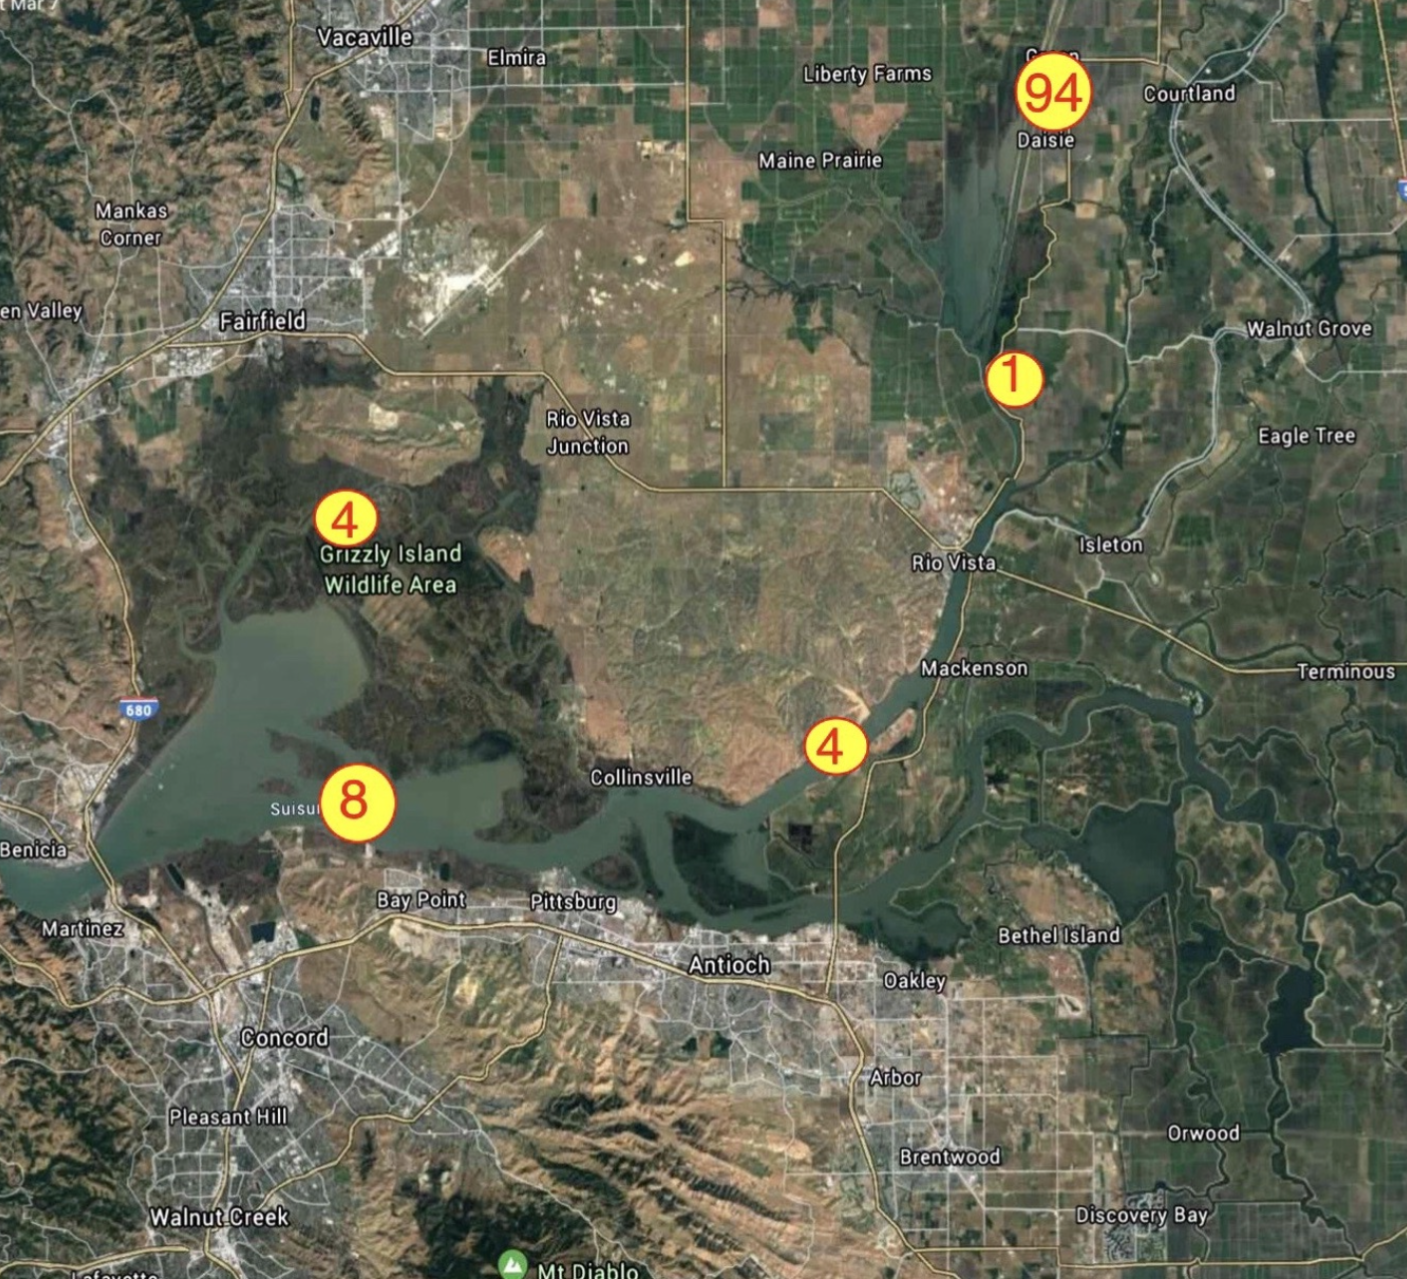
In a March 2020 post, I described where the remnants of the endangered Delta smelt population spawn and rear in the Sacramento Deepwater Ship Channel (Ship Channel) in the north Delta (Figure 1). In this post, I describe how the rearing conditions in the Ship Channel are poor. This can be seen by comparing habitat conditions in the Ship Channel with those in the lower Sacramento River channel at Freeport several miles to the east in late spring 2020.

Net Flow

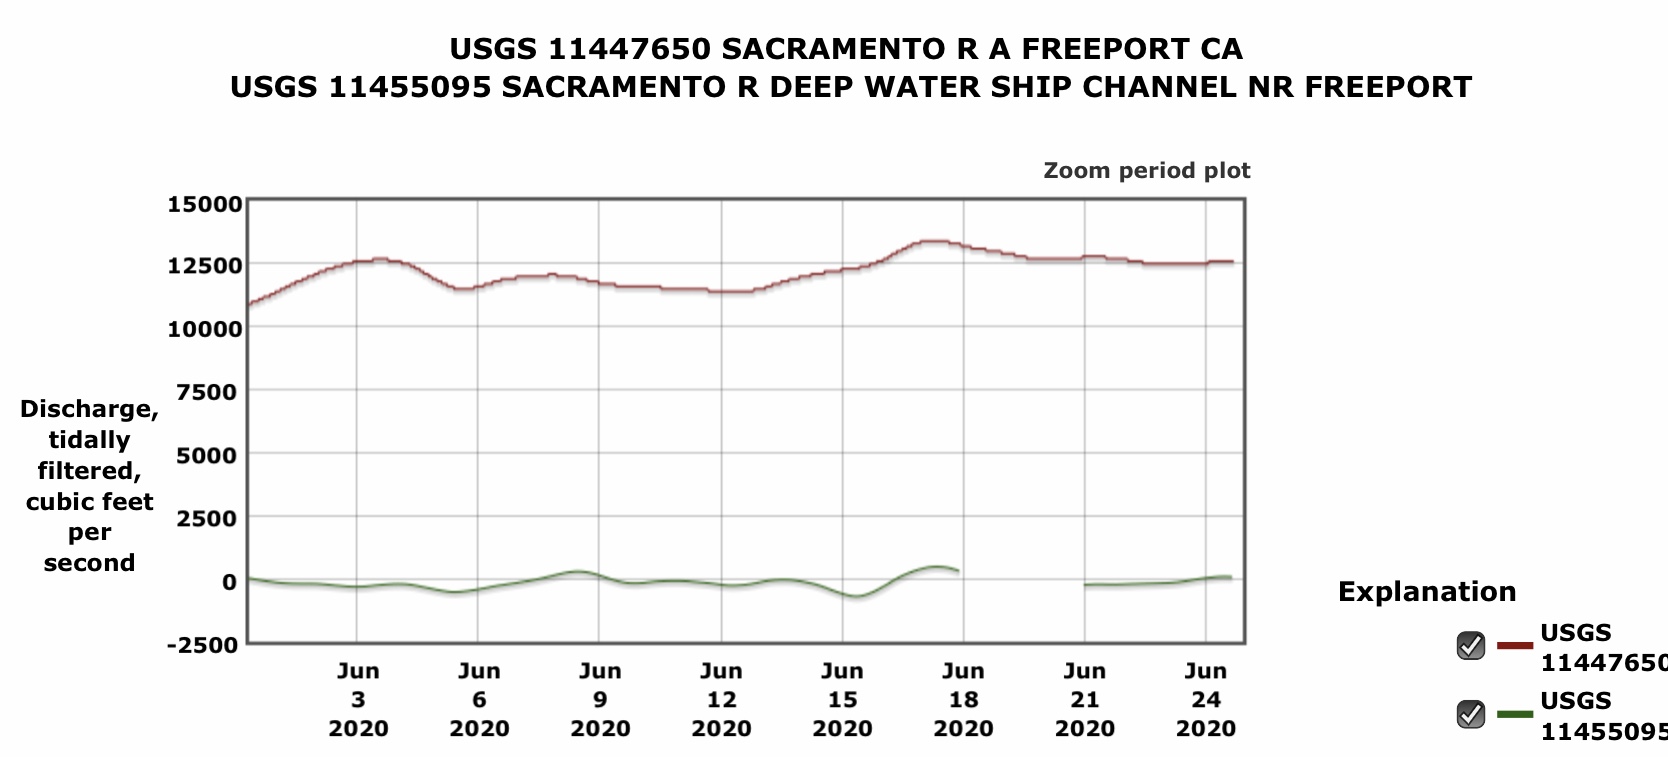
Net flow (cfs) in the Ship Channel remains near zero, since the gate at the north end of the channel near Sacramento remains stuck in the closed position as it has been for several decades (Figure 2).

Water Temperature

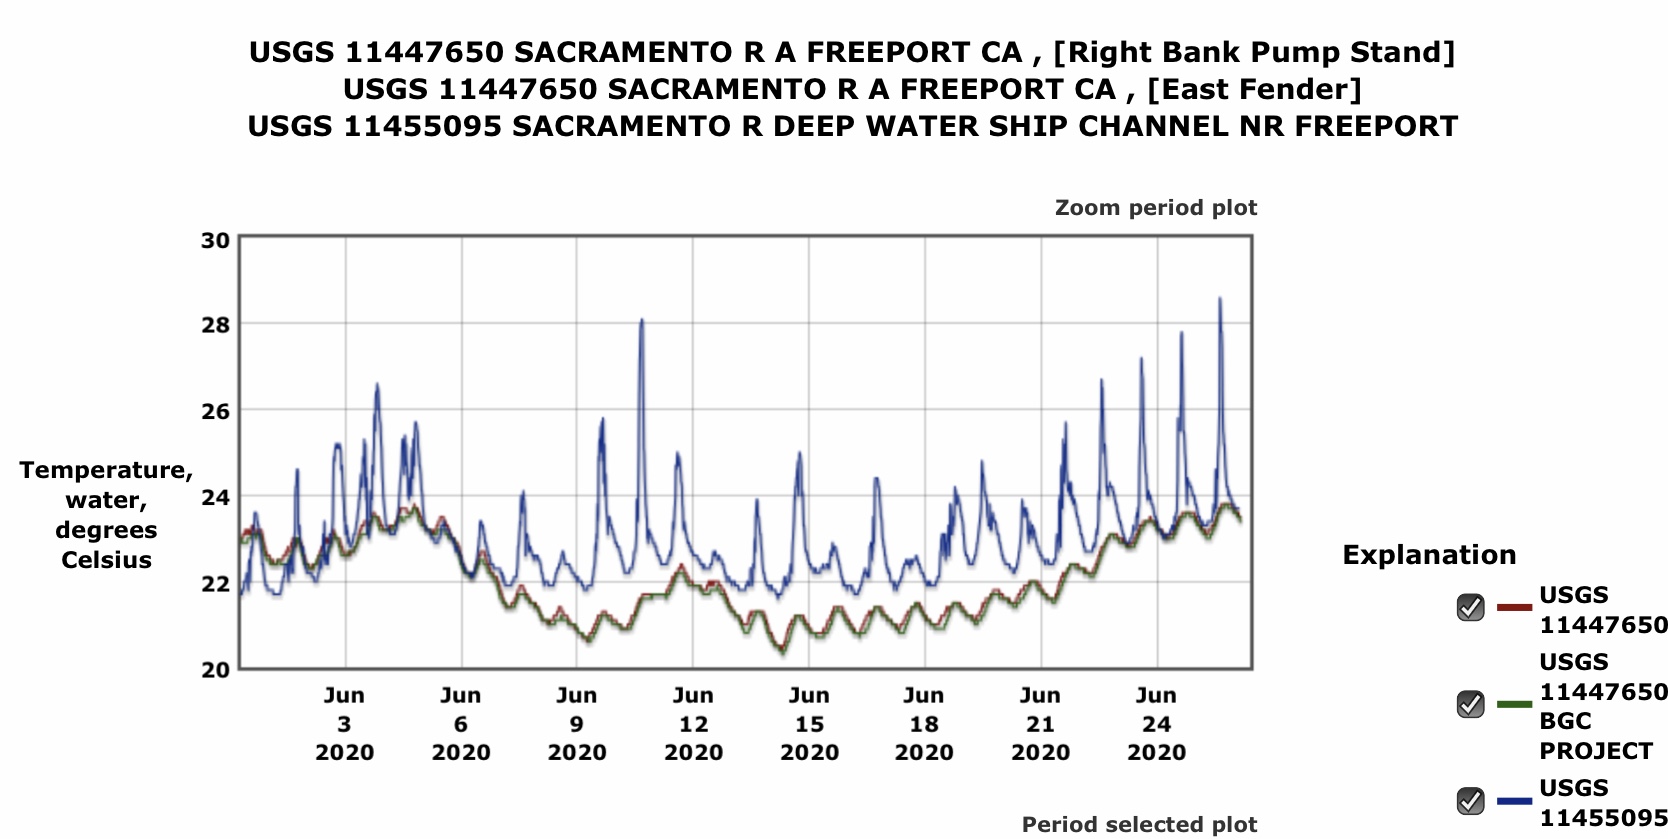
Water temperature (oC) is significantly higher in the stagnant flows of the Ship Channel than at Freeport, often reaching into the lethal range 23-25°C for Delta smelt (Figure 3).

Salinity

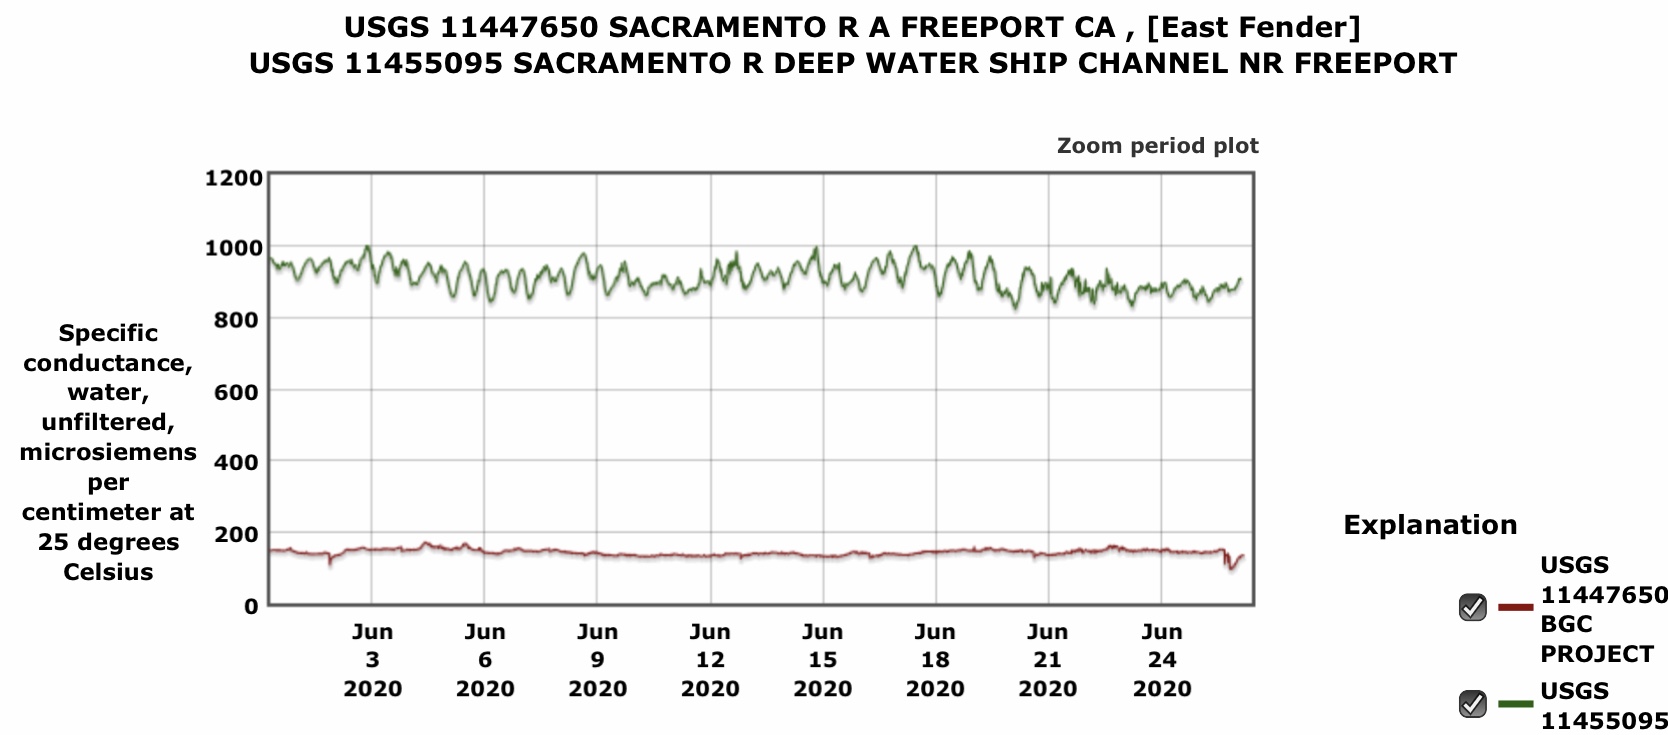
Salinity (conductivity) is much higher in the Ship Channel because of discharges from urban sewage treatment plants and agricultural operations (Figure 4).

Turbidity

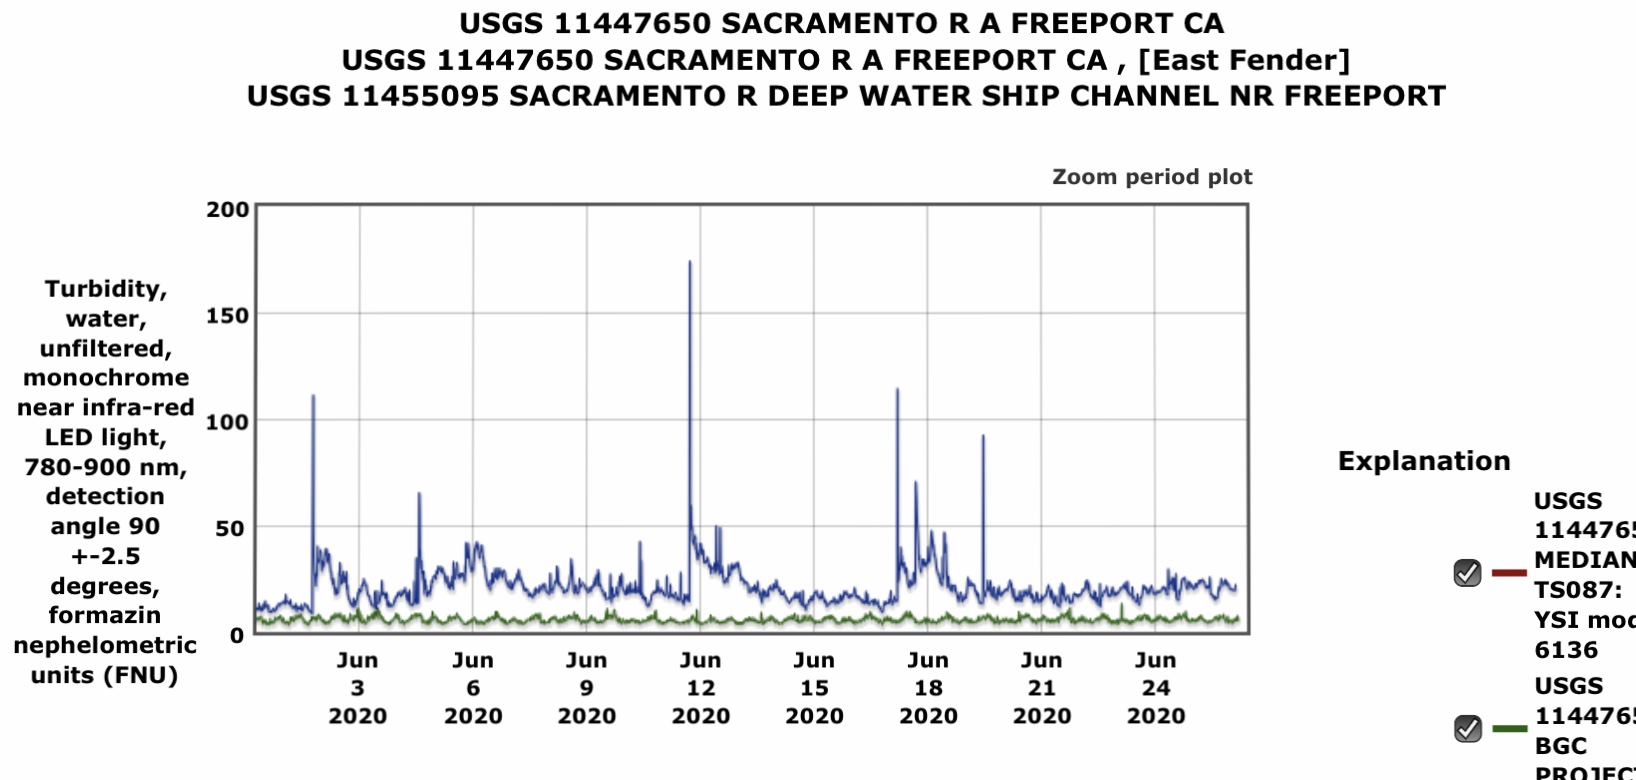
Turbidity is much higher in the Ship Channel due to higher plankton production and port-bound ship traffic in the relatively shallow and narrow Ship Channel (Figure 5).

Dissolved Oxygen

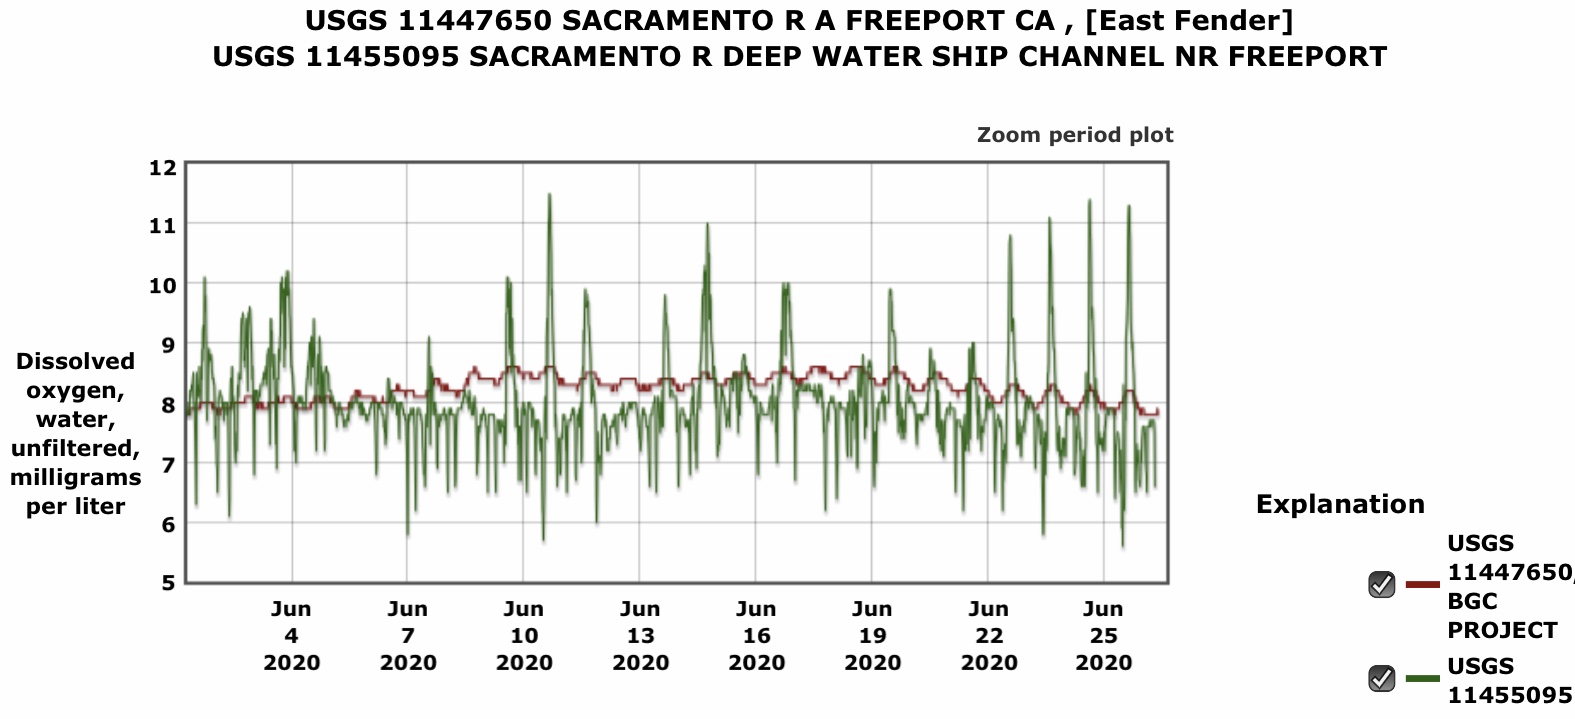
Dissolved oxygen levels are much lower in the Ship Channel because of warmer water, high concentrations of suspended organic sediments, and higher plankton production (Figure 6).

Interpretations and Conclusions

Delta smelt are attracted to the Sacramento Deepwater Ship Channel in winter and early spring to spawn in the relatively warm, low salinity, turbid, and more productive water. The adult smelt can also easily tidal-surf up the ship channel without having to content with strong downstream currents of the Sacramento River channel. Their eggs hatch early to an awaiting abundant plankton food supply. However, in spring the Ship Channel lacks net downstream flows to carry the young smelt to the Bay. By late spring, water temperatures in the Ship Channel reach lethal levels for the young smelt.

Opening the gate at the north end of the Ship Channel would help to alleviate the problems by providing net flow with cooler water temperatures, and by flushing and diluting the stagnant waste waters in the Ship Channel. An operable gate at the head of the Ship Channel would allow adaptive management of the habitat conditions for smelt.

Figure 1. Locations where Delta smelt young were captured in EDSM surveys in July 2019. Circles represent regions. Numbers are total July catch in region. The 94 represents the young smelt captured in the Deepwater Ship Channel.

Figure 2. Net daily flow (cfs) in the Ship Channel and in the Sacramento River at Freeport in June 2020. The green line shows flow in the Ship Channel.

Figure 3. Water temperature in the Ship Channel and Sacramento River at Freeport in June 2020. The blue/purple line shows the water temperature in the Ship Channel.

Figure 4. Conductivity (salinity) in the Ship Channel and Sacramento River at Freeport in June 2020. The green line shows salinity in the Ship Channel.

Figure 5. Turbidity in the Ship Channel and Sacramento River at Freeport in June 2020. The blue/purple line shows turbidity in the Ship Channel.

Figure 6. Dissolved oxygen in the Ship Channel and Sacramento River at Freeport in June 2020. The green line shows dissolved oxygen in the Ship Channel.