The Delta smelt are in trouble. The state and federal programs to help smelt recover are failing to meet their goals. The Delta Smelt Resilience Strategy adopted in 2016 is the State’s program to save Delta smelt. The State Strategy is not working, and has perhaps even made things worse in the four below normal and wet years that the state strategy has been applied since the 2013-2015 drought. This failure may explain why the strategy document is stored as a “legacy” file on the California Natural Resources Agency’s website.
The State’s Strategy consists of a number of action programs to help smelt:
- Aquatic Weed Control
- North Delta Food Web Adaptive Management Projects
- Delta Outflow Augmentation
- Reoperation of the Suisun Marsh Salinity Control Gates
- Sediment Supplementation in the Low Salinity Zone
- Spawning Habitat Augmentation
- Roaring River Distribution System Food Production
- Coordinate Managed Wetland Flood and Drain Operations in Suisun Marsh
- Adjust Fish Salvage Operations during Summer and Fall
- Stormwater Discharge Management
- Rio Vista Research Station and Fish Technology Center
- Near-term Delta Smelt Habitat Restoration
- Franks Tract Restoration Feasibility Study
When the Delta Stewardship Council last took a close look on progress of the State Strategy in 2019 it found little that was encouraging. It identified two actions that showed promise: hatchery supplementation of Delta smelt and the operation of the Suisun Marsh Salinity Control Gates (SMSCG). More recently, the State has stated in its February 20, 2020 lawsuit against the Bureau of Reclamation that the Delta smelt hatchery program is not reasonably certain to have positive benefits.
The Federal Strategy shows even less progress and little future promise. The Federal Strategy consists of a number of action programs to “help” smelt while further reducing water allocated to their recovery:
- Delta Smelt Outflow Action
- Operations of the Suisun Marsh Salinity Control Gates
- Directed Outflow Project (DOP)
- Mesocosm (Cage) Studies – cultured smelt raised in cages
- EDSM: Endangered Delta Smelt Monitoring is a year-round weekly sampling program administered by the Service and voluntarily funded by Reclamation.
- Drivers of Delta Smelt Health Study
- The Salinity and Growth History of Delta Smelt Study
- The Delta Outflow Augmentation Modeling Study
- Roaring River Distribution System Restoration: Experimentally produces food through wetland management in the Suisun Bay and Marsh.
- Sacramento Deepwater Ship Channel nutrient manipulation involving experimentally seeding nutrients in the Deepwater Ship Channel to enhance productivity in Cache Slough.
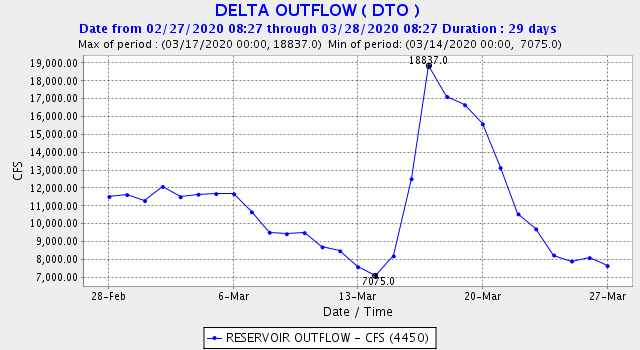
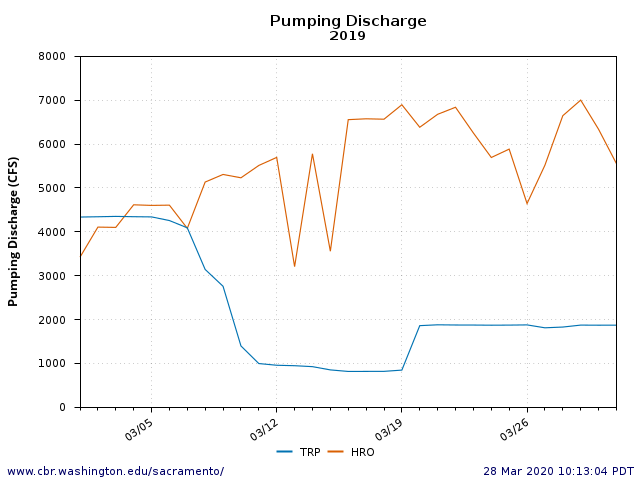
It is worth noting that while both the State and federal programs point to the importance of Delta outflow, the latest State and federal operating plans for the Delta both propose to reduce outflow compared to recent past operations. Reducing outflow requirements leads to higher Delta exports.
Below, I summarize results of two experiments to increase north Delta smelt food production in 2019.
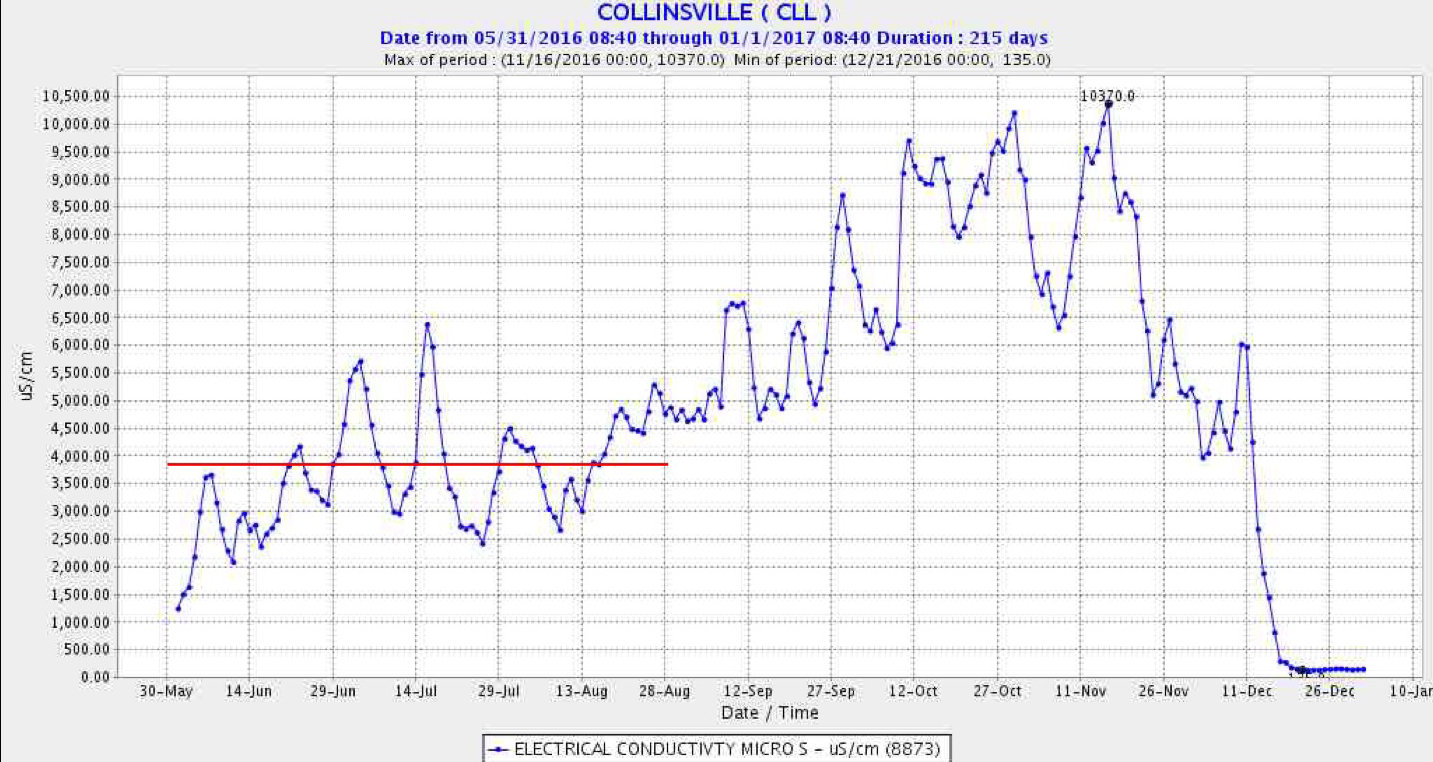
In a prior update in October 2018, I opined that the benefits of 2018 north Delta food actions were questionable, despite optimism by the state and federal programs. The actions were applied again in 2019, with results similar to those in 2018. During September 2019, approximately 600-800 cfs of river and ag-return water (Figure 1) was routed down the Colusa Basin Drain and through the Yolo Bypass into the north Delta at Cache Slough near Rio Vista. As in 2018, the Lisbon gage indicated depressed levels of dissolved oxygen (Figure 2), reflecting the high organic load in drain water from the agricultural Colusa and Yolo Basins carried in the Colusa Basin Drain. Though the organic load was higher in 2019, the level of chlorophyll (algae) was lower at the Lisbon gage (Figure 3) and in the north Delta (Figure 4). The organic load was accompanied by an increase in nutrient and mineral components (salts) (Figure 5). Normally, higher dissolved oxygen depressing organic loads and higher salt levels are considered pollution; however, in this case, high levels are designated as “fertilizer” with the ascribed benefit of producing more food for smelt in the Delta.
Reclamation’s attempt to stimulate food production by “fertilizing” the Deepwater Shipping Channel adjacent to the lower Yolo Bypass involved dispersal of 6 tons of nitrate salts via crop dusters (Figure 6) in August 2019. There may have been some limited stimulus of chlorophyll production in the Sacramento channel near Rio Vista (Figure 4) and in the lower Ship Channel (Figure 7). However, the chlorophyll concentrations in the middle (Figure 8) and upper (Figure 9) Ship Channel showed little or no response to the “fertilizing” effort.
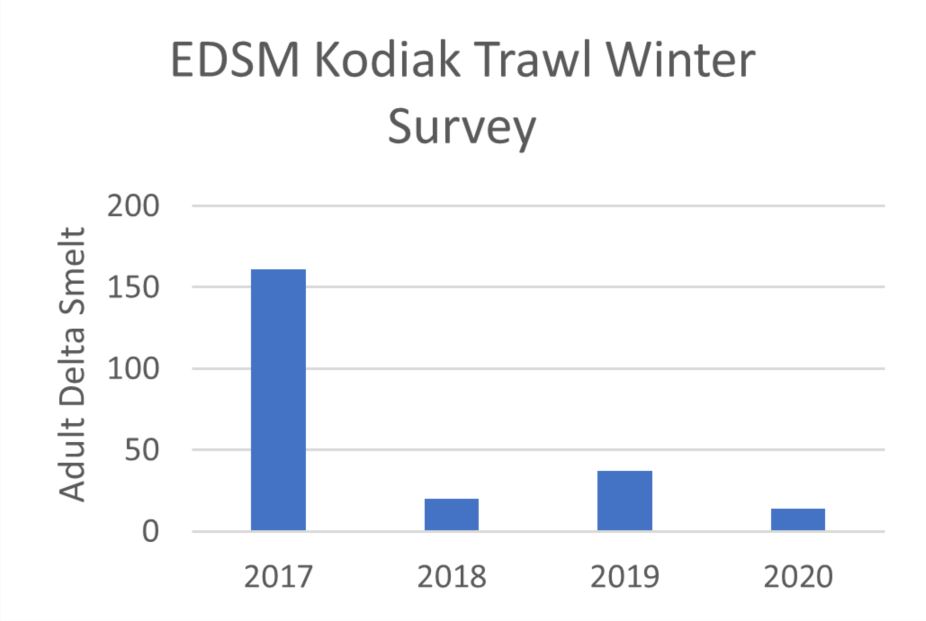
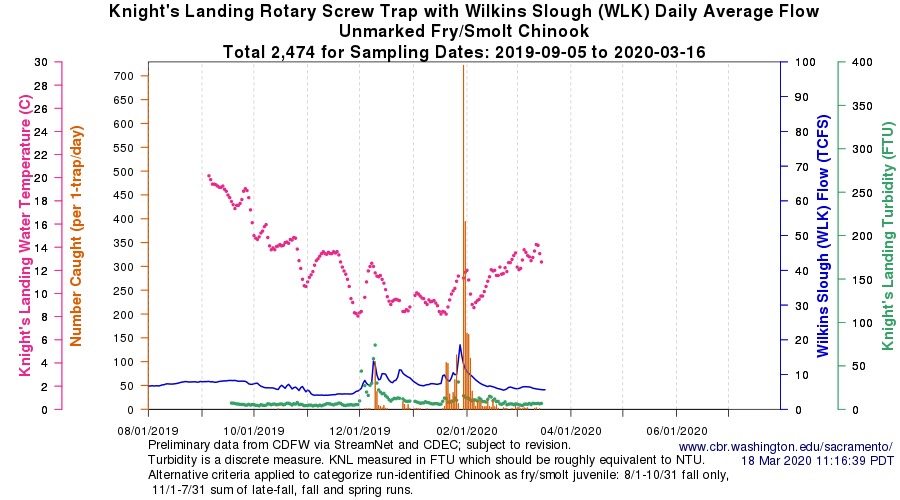
In conclusion, the state and federal strategies to help recovery of Delta smelt either lack progress or show little if any benefit in terms of smelt food production and smelt reproduction. The federal Enhanced Delta Smelt Monitoring Program’s (EDSM) intensive survey of adult Delta smelt over the past four winters indicates further declining numbers (see chart immediately below).

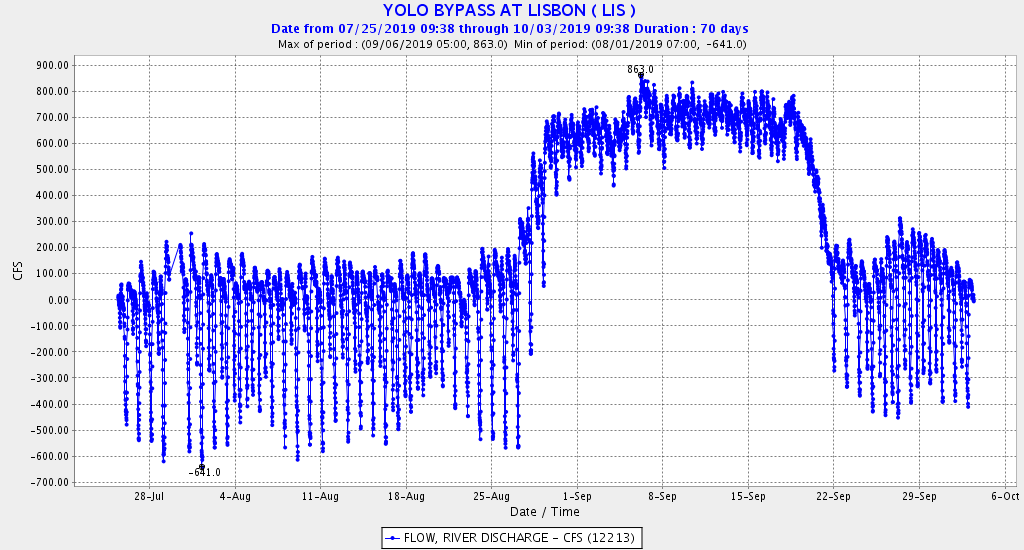
Figure 1. Flow in tidal lower Yolo Bypass at Lisbon Weir gage near I-80 causeway in summer 2019.
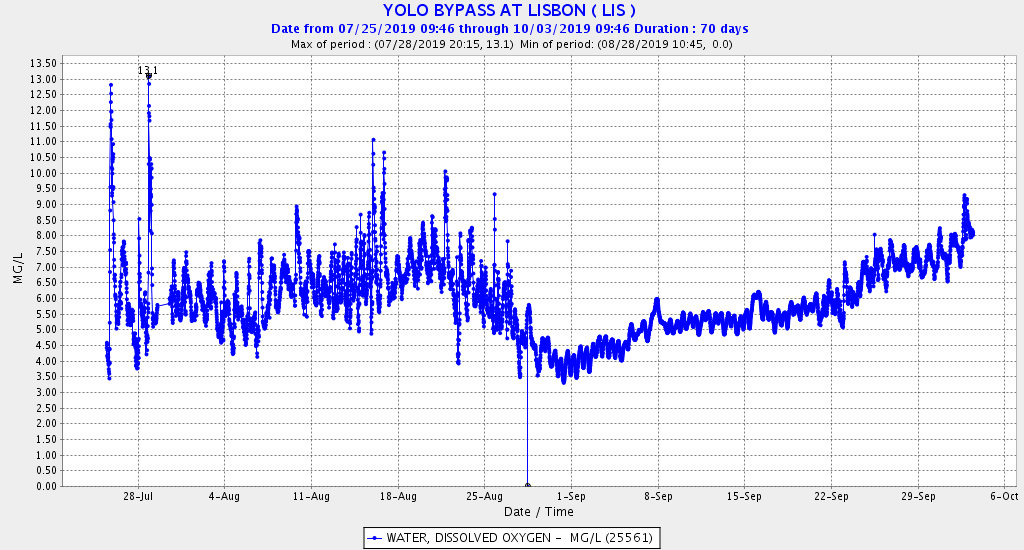
Figure 2. Dissolved oxygen levels at Lisbon gage in the lower Yolo Bypass in summer 2019.
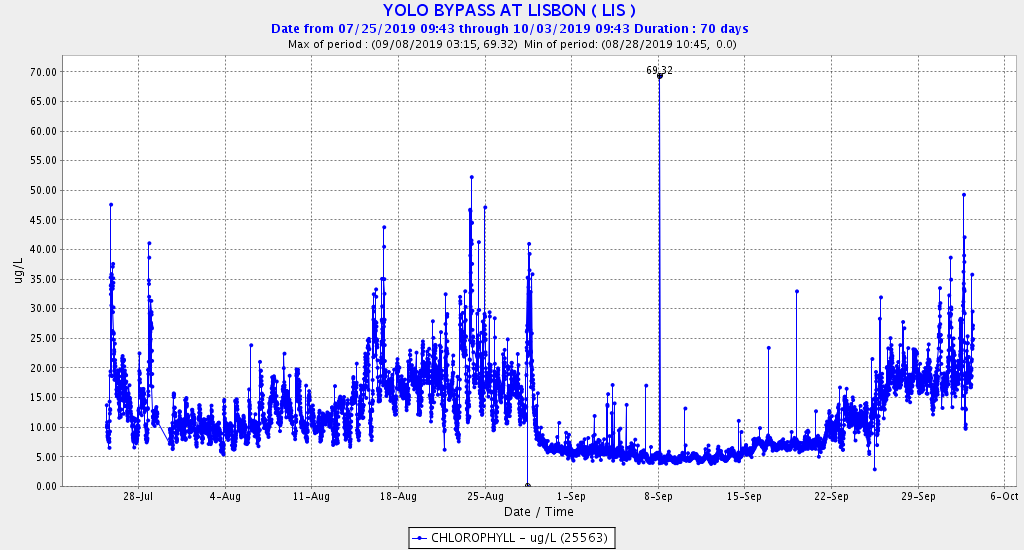
Figure 3. Chlorophll levels at Lisbon gage in the lower Yolo Bypass in summer 2019.
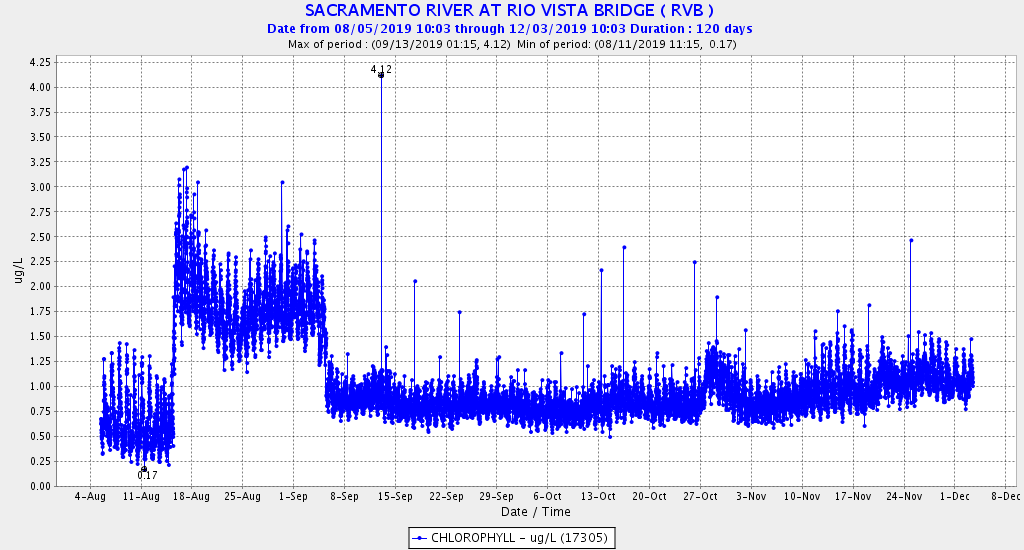
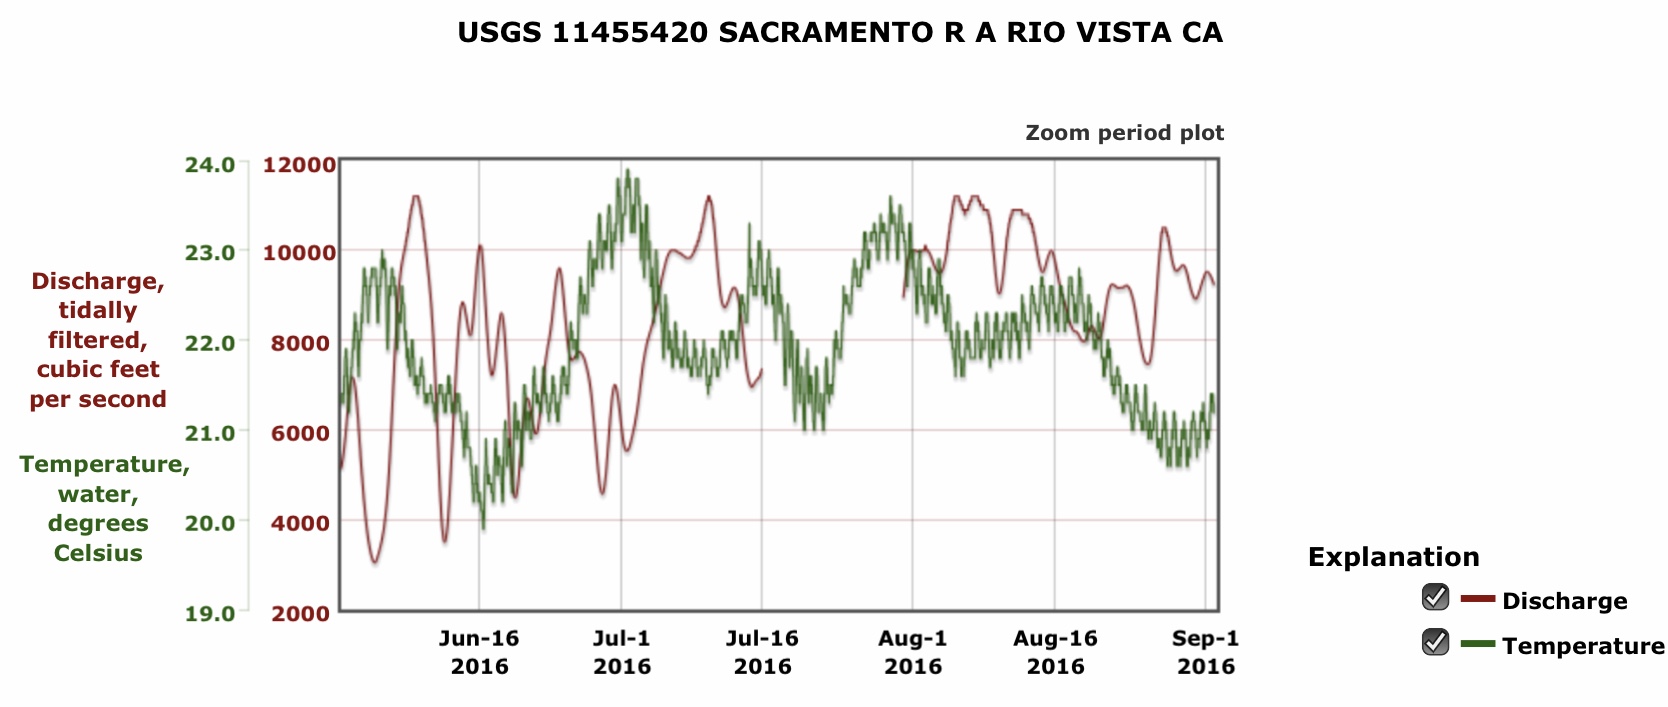
Figure 4. Chlorophyll concentrations in the north Delta channel of Sacramento below the mouth of Cache Slough near Rio Vista in summer-fall 2019.
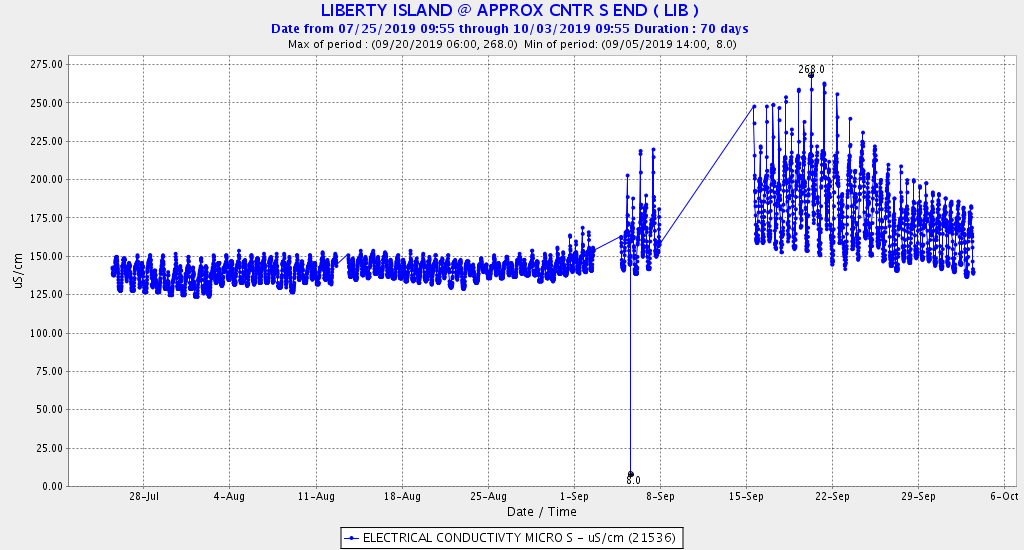
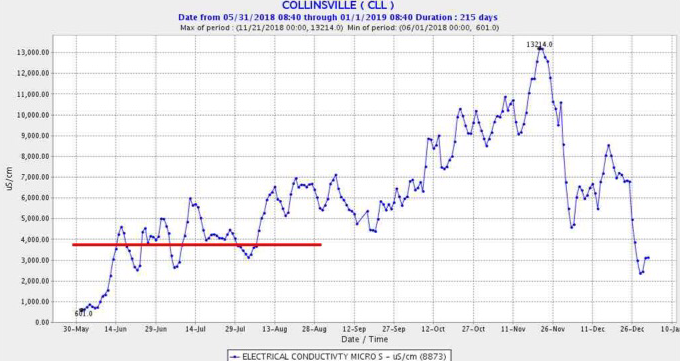
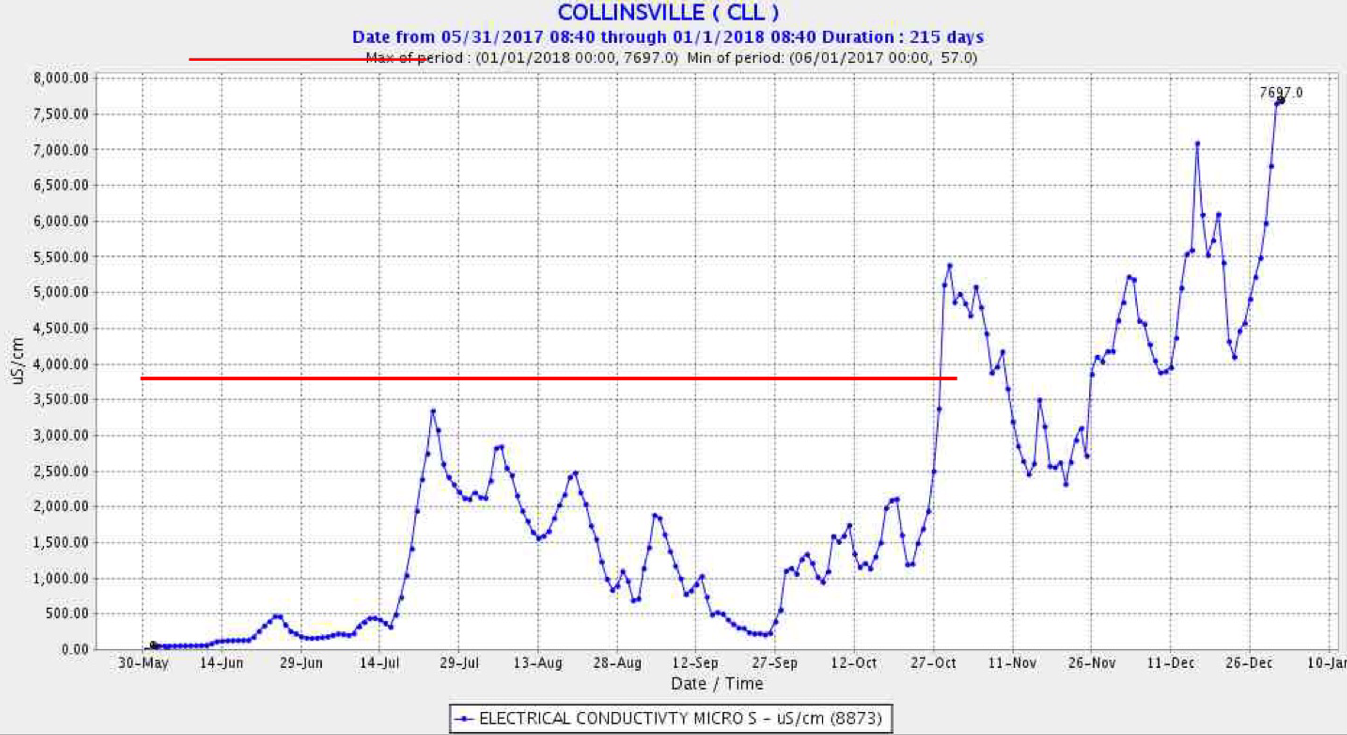
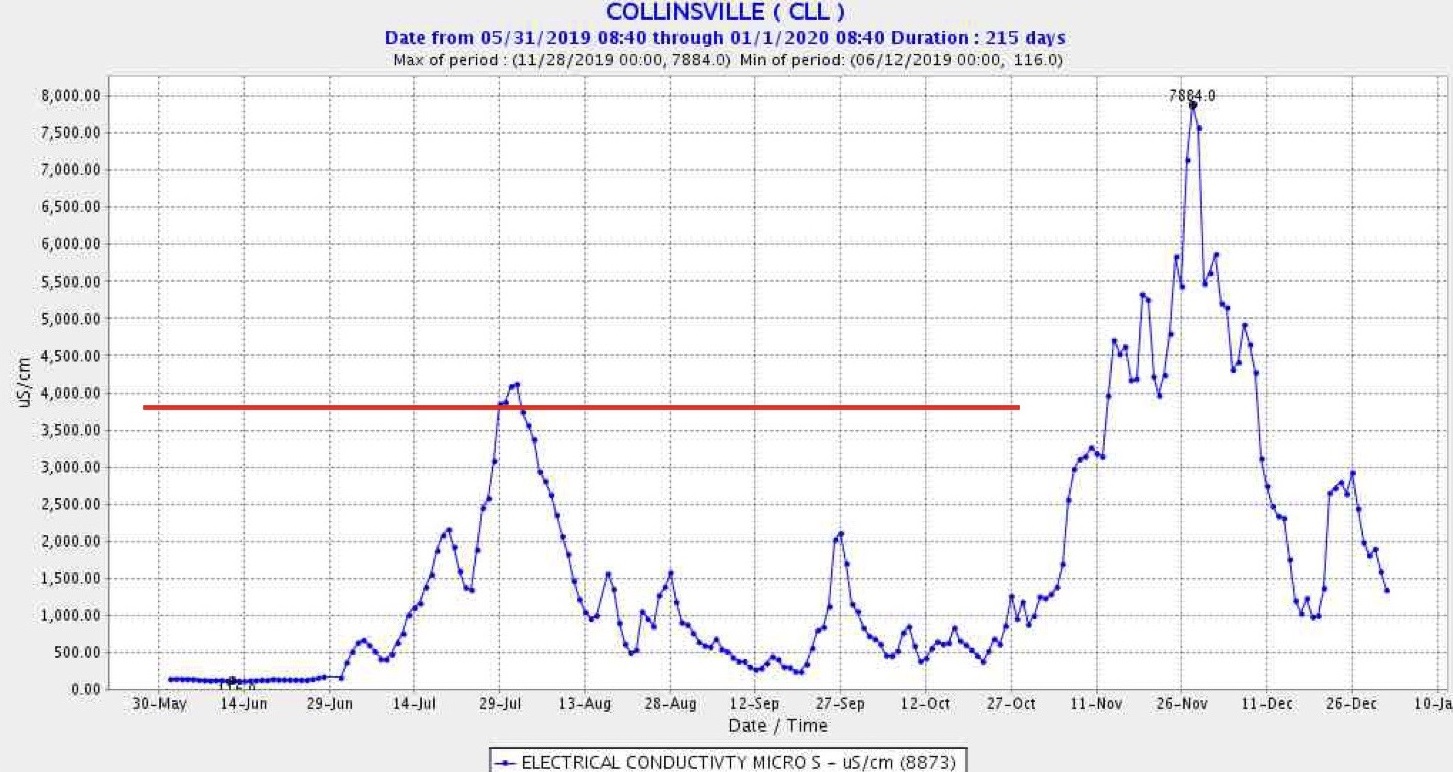
Figure 5. Electrical conductivity recorded in the lower Yolo Bypass near Liberty Island in summer 2019.
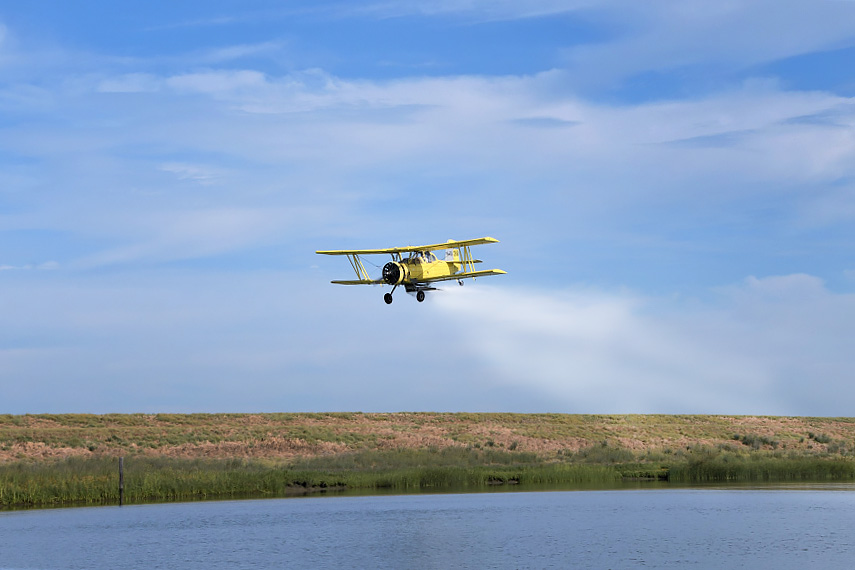
Figure 6. Crop dusting fertilizing in Ship Channel August 2019. Reclamation photo.
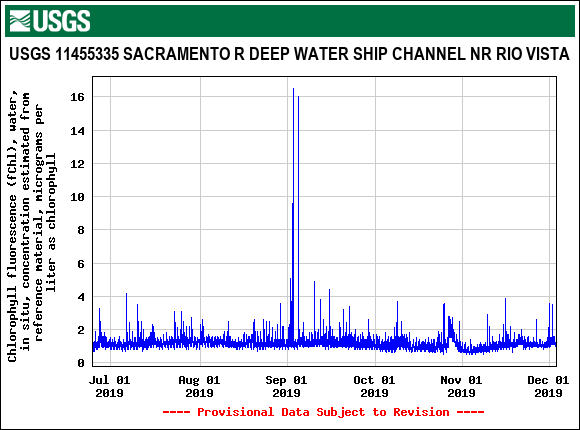
Figure 7. Lower Ship Channel chlorophyll concentrations summer-fall 2019.
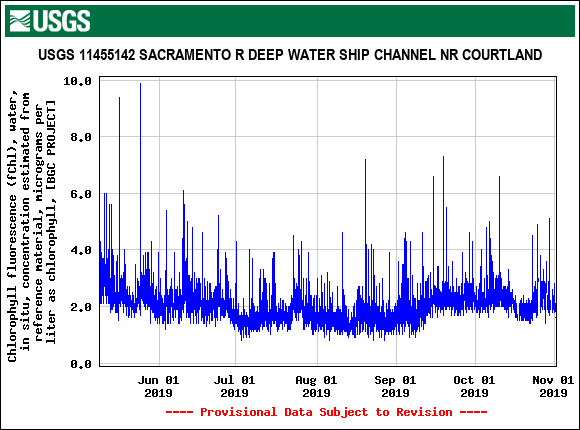
Figure 8. Middle Ship Channel chlorophyll concentrations summer-fall 2019.
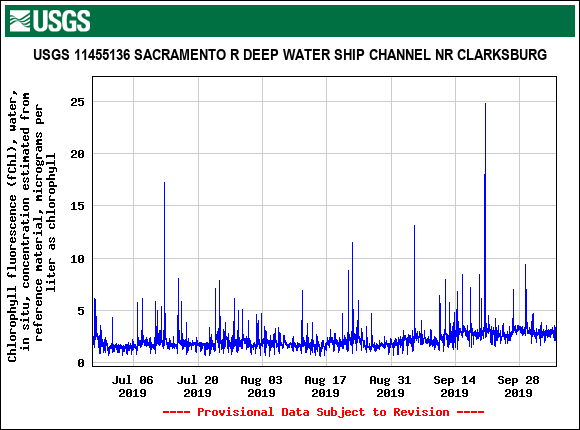
Figure 9. Upper Ship Channel chlorophyll concentrations summer-fall 2019.