In a recent post I discussed ways to improve hatchery salmon smolt survival to increase coastal and river salmon populations devastated by recent droughts. This post is a follow-up addressing how to enhance the Coleman (Battle Creek) Hatchery1 contribution. Coleman produces nearly half of the Central Valley’s 30 million hatchery-produced salmon smolts. Three state hatcheries in the Valley (Feather, American, and Mokelumne) produce most of the other smolts. Survival of Coleman hatchery smolts released to the Sacramento River is markedly lower in dry years.2 Trucking smolts from the hatchery to the Bay increases survival and catch in fisheries, but at a cost of increased straying and low return rates of adults to the hatchery.
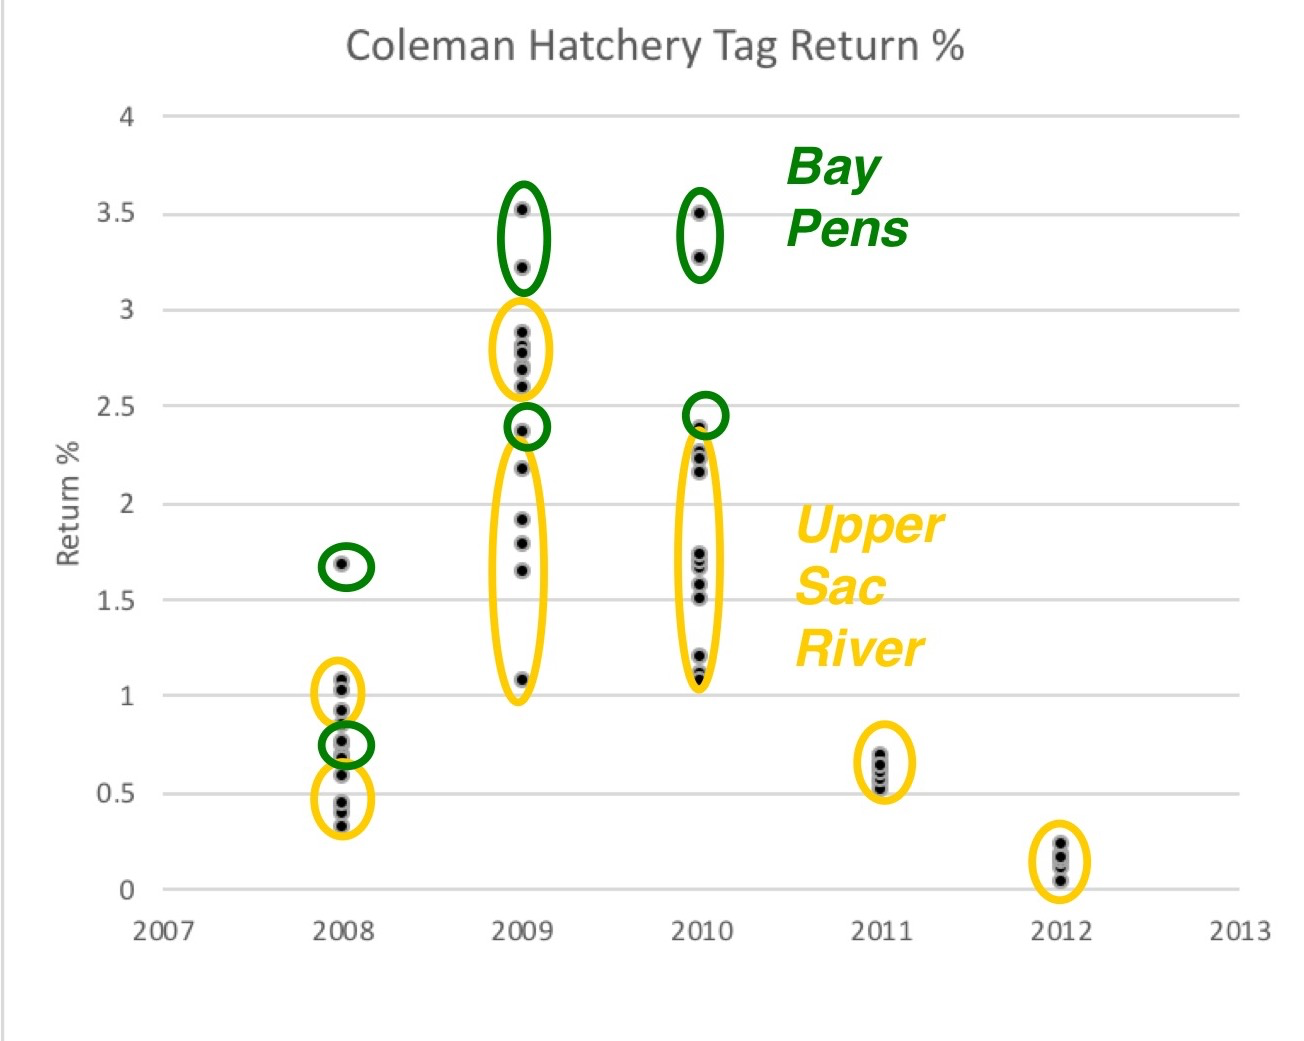
Of all these hatcheries, Coleman has the toughest challenge, because it is nearly 300 miles from the Golden Gate. While trucking smolts to the San Francisco Bay improves smolt survival and adult salmon population numbers available to fisheries, trucking from Coleman leads to low hatchery-return rates and excessive straying to other Valley rivers. Only about 50-100 adults per million smolts trucked to the Bay find their back to Coleman. In contrast, for each million smolts released at the hatchery, 400-500 return to Coleman to contribute eggs for the next generation.
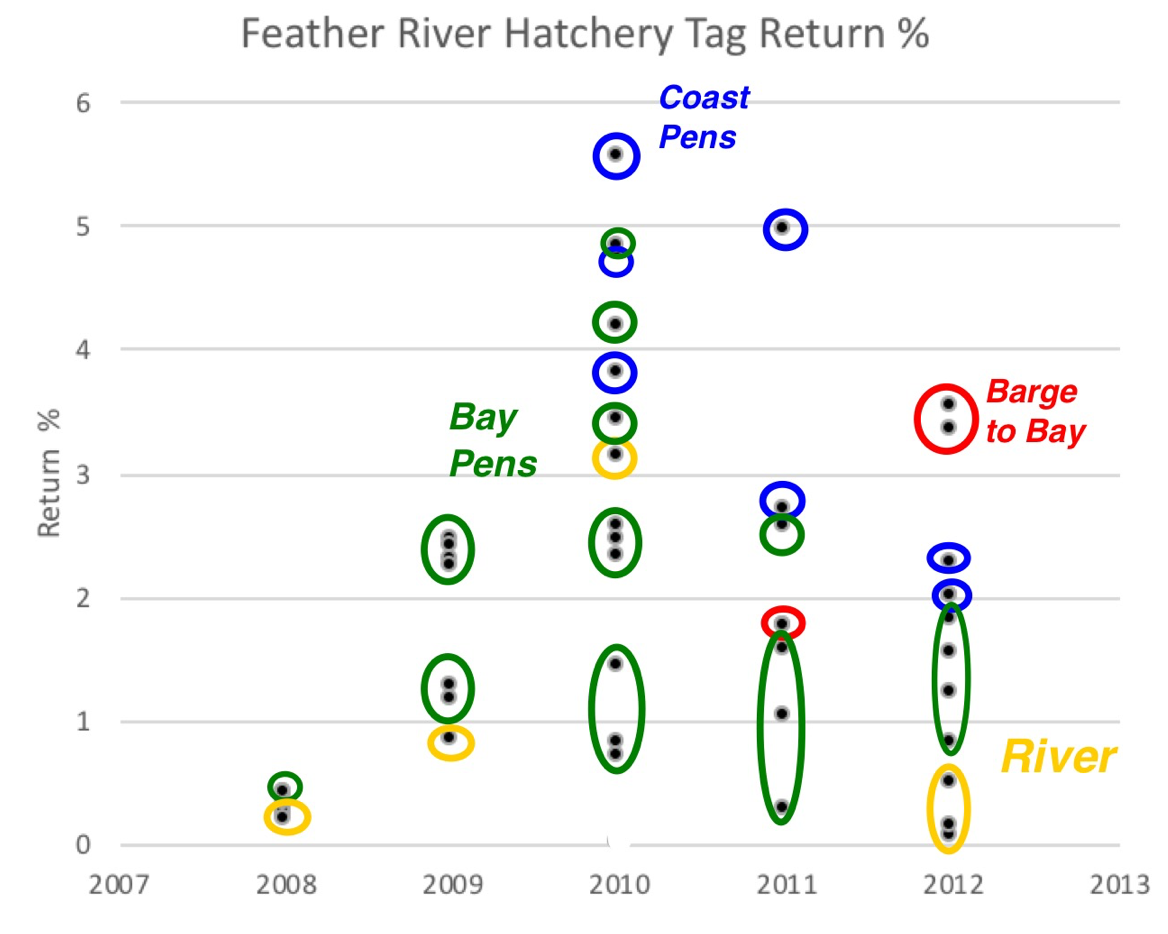
One measure to increase smolt survival-contribution I suggested in past posts is barging smolts to the Golden Gate. Unlike trucking, barging allows some imprinting by smolts for their eventual return route back to the hatchery. Barging requires a medium to large sized vessel, which would still necessitate nearly 200 miles of trucking to barge-accessible locations on the lower Sacramento River. Barging may reduce straying while providing enhanced smolt survival to the Bay, although past trucking and release at Knights Landing in the lower river only marginally lowered the straying rate compared to Bay releases. A balance between overall survival and contribution to the fishery and returns to the hatchery is the challenge for fisheries managers. Barging from Knights Landing or Elkhorn boat ramps may provide more returns to the Sacramento River above the mouths of the Feather and American rivers than trucking releases to these locations or the Bay. Regardless, barging should provide substantially higher survival and returns to the upper river than river release of fish, especially in dry years. Barging test studies conducted by the Feather Hatchery program should be expanded to test potential benefits of Coleman salmon smolt barging.
Another measure that deserves testing is rearing Coleman fall-run fry off-site in Yolo Bypass rice fields. The higher survival and growth potential and earlier ocean entry of these smolts compared with smolts released at the hatchery, should increase the numbers of adult salmon available to the fisheries. Concerns include low returns to Coleman hatchery and straying of returning adults back to the Yolo Bypass. The State’s EcoRestore Program is planning fish passage improvement projects in the upper Bypass. Barging off-site-reared smolts to the Bay from nearby Knights Landing or Elkhorn boat ramp could potentially improve return rates to the hatchery and overall survival, especially in dry years
A third proven measure that is possibly more promising and readily implementable is improving downstream migration conditions for smolts released to the upper Sacramento River from the Coleman hatchery. Smolt survival and contribution to fisheries and adult returns to the hatchery are better when flow, turbidity, and water temperature conditions are good at the time of release and in the immediate weeks thereafter in the 200 miles downstream to the Bay. To a certain extent, the hatchery can time releases to river conditions (and does so when feasible). However, the timing of smolting and the whole rearing process necessitates a week 15-17 release window (late April to beginning of May). When conditions are optimal in these key weeks, survival and contribution rates of smolts released at Coleman are nearly as high as they are for smolts transported to the Bay. Such 1-3% survival (returns) would produce hundreds of thousands of adults, compared to just tens of thousands under poor conditions when there is just 0.2-0.5% survival (Table 1). A 3% survival would yield 360,000 adult salmon returns from 12 million hatchery smolts, as compared to only 12,000 returns under a 0.1% survival.
So what are good conditions in late April? Adequate stream flows are those necessary to meet existing water quality standards, water right permits requirements, and endangered species permit requirements in the upper 200 miles of river below Shasta Dam. Such prescriptions are basically minimum targets: keeping the upper river within the 56oF limit upstream of Red Bluff and the river downstream to the Delta at 68oF or less. These standards were put in place decades ago to protect beneficial uses, including salmon survival.
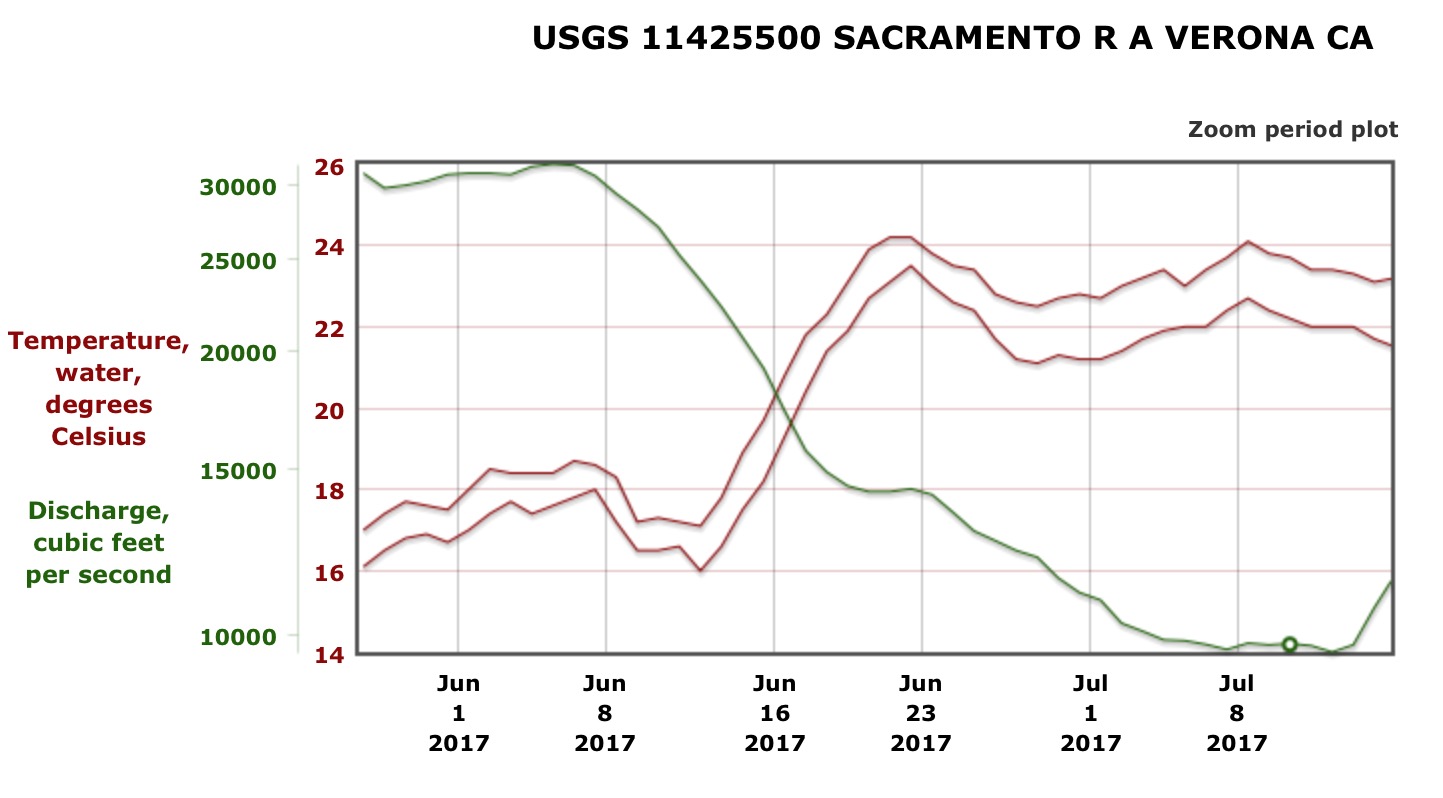
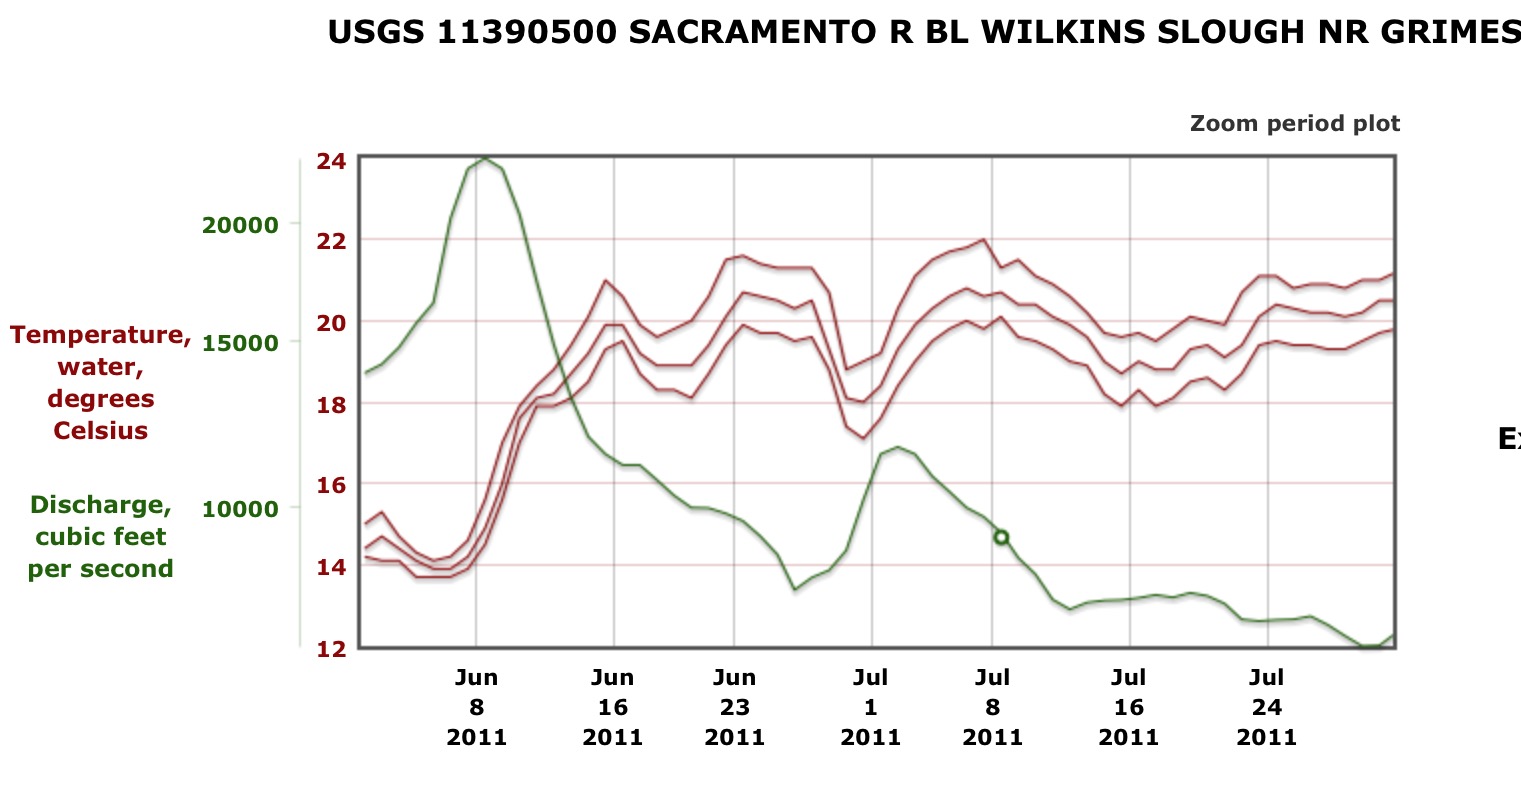
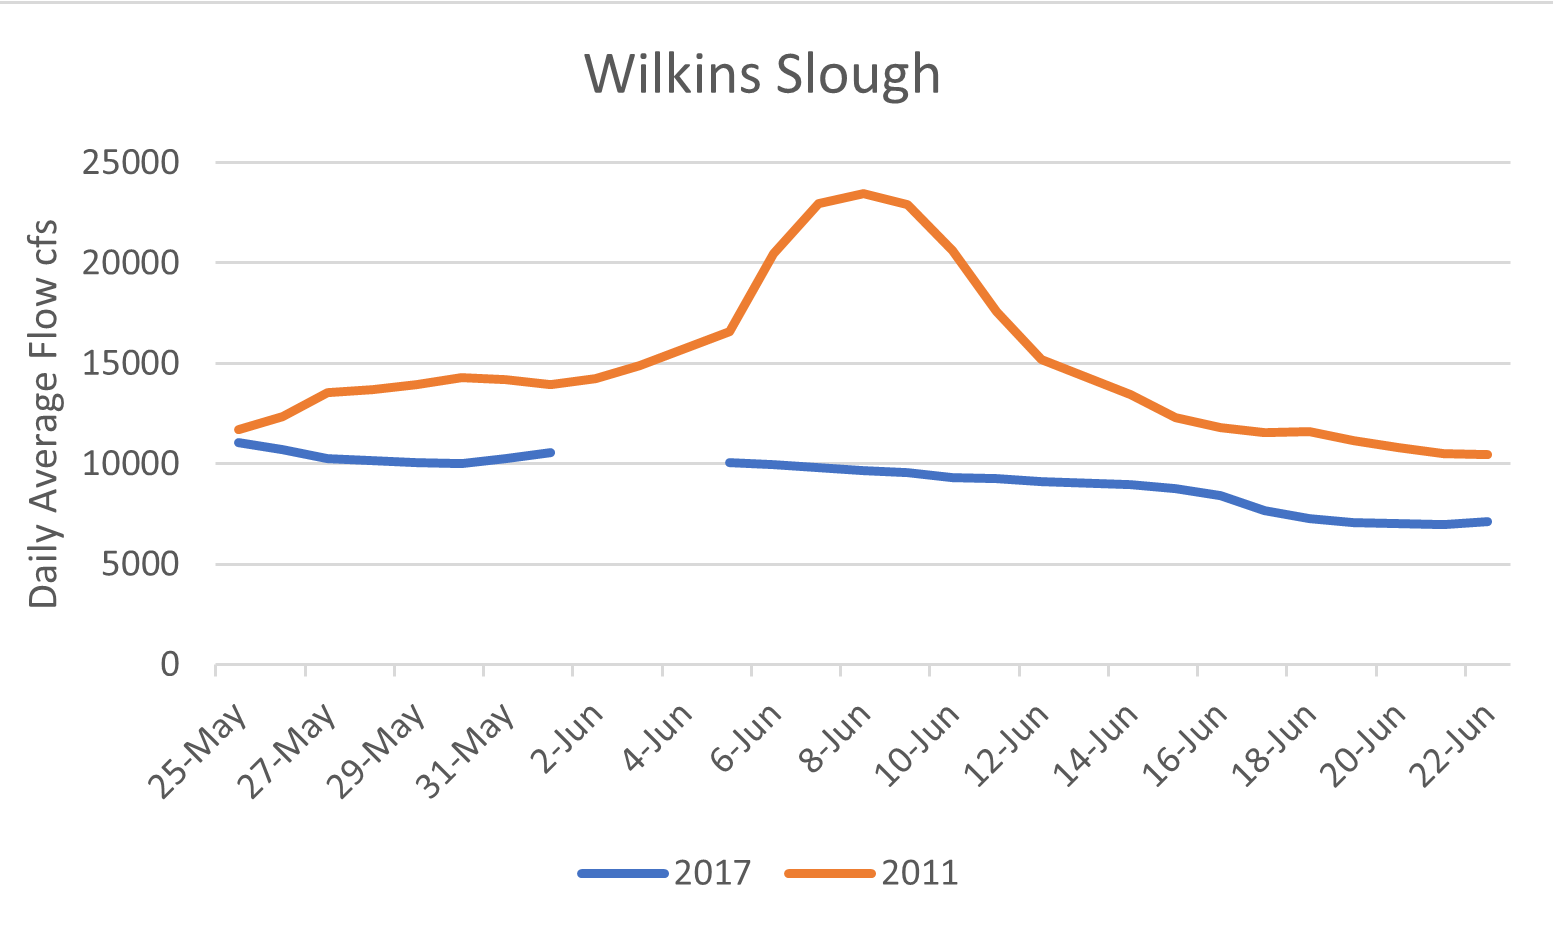
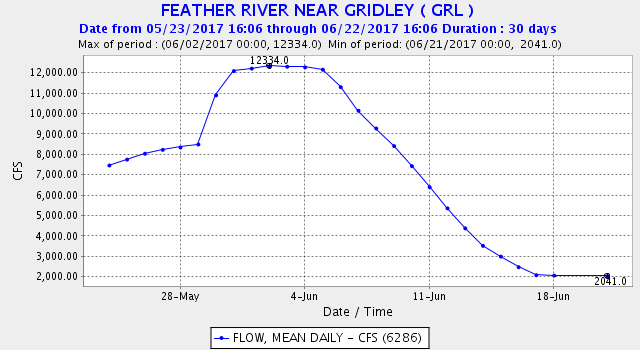
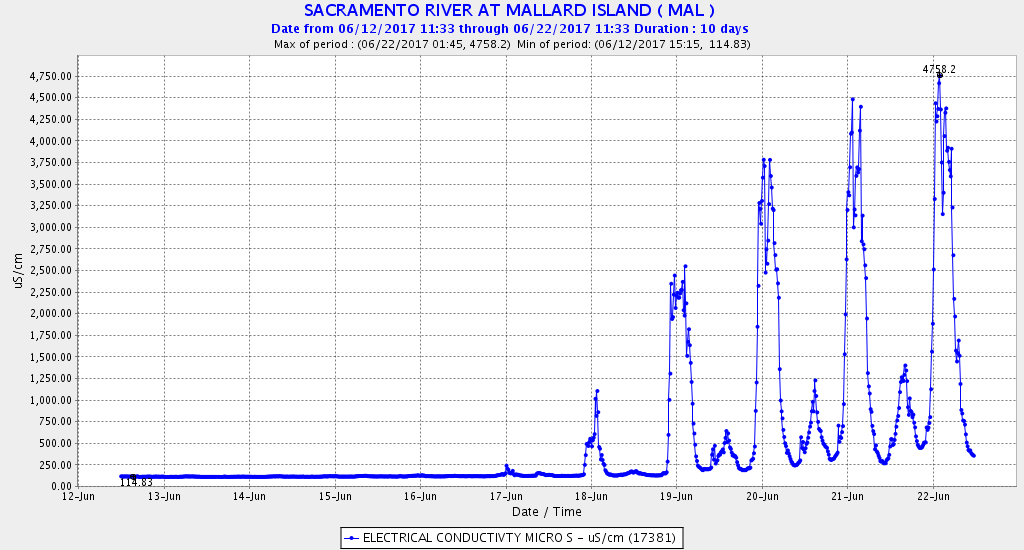
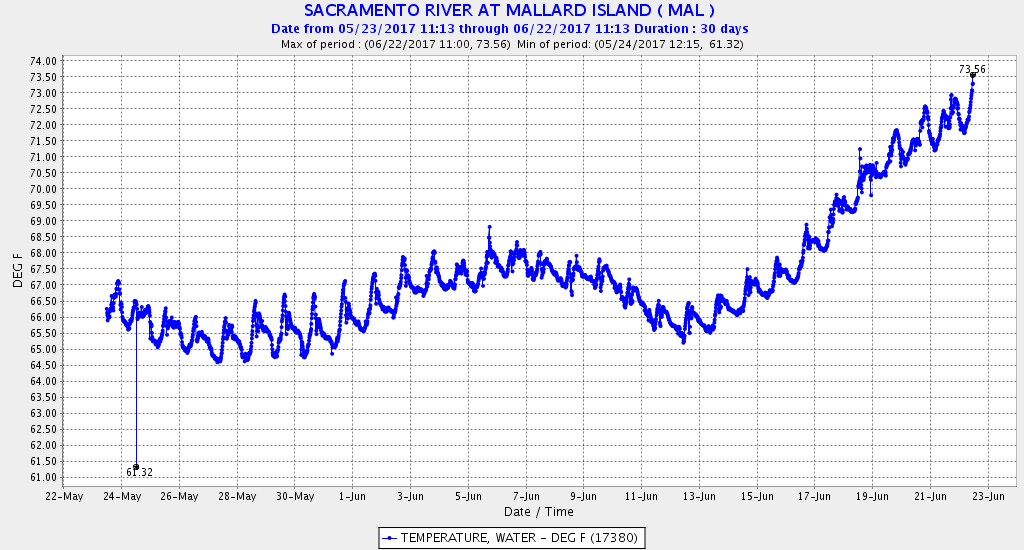
The problem is that these standards are both increasingly being ignored and violated, and are also proving inadequate in providing optimal smolt survival. Figure 1 shows that standards were violated at Red Bluff, even in 2017, a record water supply year. Figure 2 shows 2017 water temperatures at Wilkins Slough in the lower Sacramento River. Though water temperatures remained below 68oF (20oC) during the period shown, they reached above the 65oF (18oC) stress level for migrating juvenile salmon. Such high water temperatures place the smolts at much greater risk to predation.3 Even in this record water supply year, water was unnecessarily held in storage in Shasta Reservoir at the expense of Coleman and wild salmon smolt survival. When water contractor demands are low and Delta conditions are “in excess,” there is a tendency in all year types to maintain Shasta storage at the expense of lower river water temperature and Coleman smolt survival.
In addition to maintaining flows and water temperatures, a flow pulse through the lower river in the late April to early May period would likely improve survival. A flow pulse in drier years would provide higher transport rates, higher turbidity, and lower water temperatures, conditions that often occur in wetter, high survival years. A one week pulse that raised flows from the “dry” year 5000 cfs flow level to a 10,000 cfs level would use approximately 10,000 acre-ft per day, or about 70,000 acre-ft for a week. At Shasta Reservoir’s current storage level in excess of 4 million acre-ft, the water needed for a one week flow pulse would be less than 2% of the total storage for the year. Even for a multiyear drought year like 2015, the amount needed would be only 3 to 4% of total annual storage. While drought year pulses would need to be weighed against losses to the Shasta coldwater pool, a 1% improvement in dry-year survival would add 120,000 adult salmon from the 12 million smolts produced by the Colman hatchery. For a dry year or drought year sequence, the increase could be over 100% over current survival rates, and could allow a salmon fishing season when there might otherwise be none.
In summary, the salmon fishery collapses that occurred as a consequence of the 2007-2009 and 2012-2015 droughts could have been at least partially alleviated by improving survival of smolts produced at the Coleman hatchery. Compliance with spring water temperature standards in the lower Sacramento River would help greatly. When water supplies are adequate, spring flow pulses should be considered. Barging Coleman smolts to the Bay and off-site rearing in lower river floodplain habitats are additional measures to test in order to increase Coleman hatchery smolt survival and contributions to ocean and river fisheries.
Table 1. Survival (return) rates of Coleman hatchery fall run Chinook salmon release groups for a range of year types.
Source of survival data: http://www.rmpc.org.
| Water Year | Week 15-17 Conditions | Smolt Survival4 |
| 1997 Wet Year | Lower River conditions were deteriorating in April with flows falling from 7000 to 5000 cfs and water temperatures rising from 59oF (15oC) to 65oF (18oC). | Week 15 – 0.8% Week 16 – 0.3% Week 17 – 0.2% |
| 1998 Wet Year | Lower River conditions were near optimal with 18,000 cfs flow and water temperature of 15oC. | Week 17 – 0.9% |
| 2002 Dry Year | Lower River conditions degraded gradually from week 15 to week 17). Flows in lower river fell from near 10,000 cfs to less than 5000 cfs during April. Though water temperatures remained below 68oF (20 o C) during the period, they often reached above the 65oF (18 oC) stressful level for migrating juvenile salmon. | Week 16 – 0.8% Week 17 – 0.6% |
| 2007 Critical Dry Year | Lower River conditions were poor in weeks 16-17 with flows of 4000-5000 cfs and water temperatures of 19-21oC. | Week 16 – 0.01%5 |
| 2008 Critical Dry Year | Lower River conditions were poor with flows of 5000 cfs and water temperatures 16oC to 18oC in weeks 16-17, but reaching 20-22oC in week 18. | Week 16 – 0.1% Week 17 – 0.1% |
| 2009 Critical Dry Year | Lower River flow decreased from 7000 cfs to 5000 cfs in weeks 15-16, while water temperature rose from 15oC to 20oC. Flow pulsed to 10,000 cfs in week 17 dropping water temperature to 15oC. | Week 15 – 0.5% Week 16 – 0.9% |
| 2011 Wet Year | Lower river flows in April were dropping sharply from 16,000 to 8,000 cfs, with water temperature rising from 15oC to 18oC. | Week 15 – 2.2% Week 16 – 1.5% Week 17 – 1.2% |
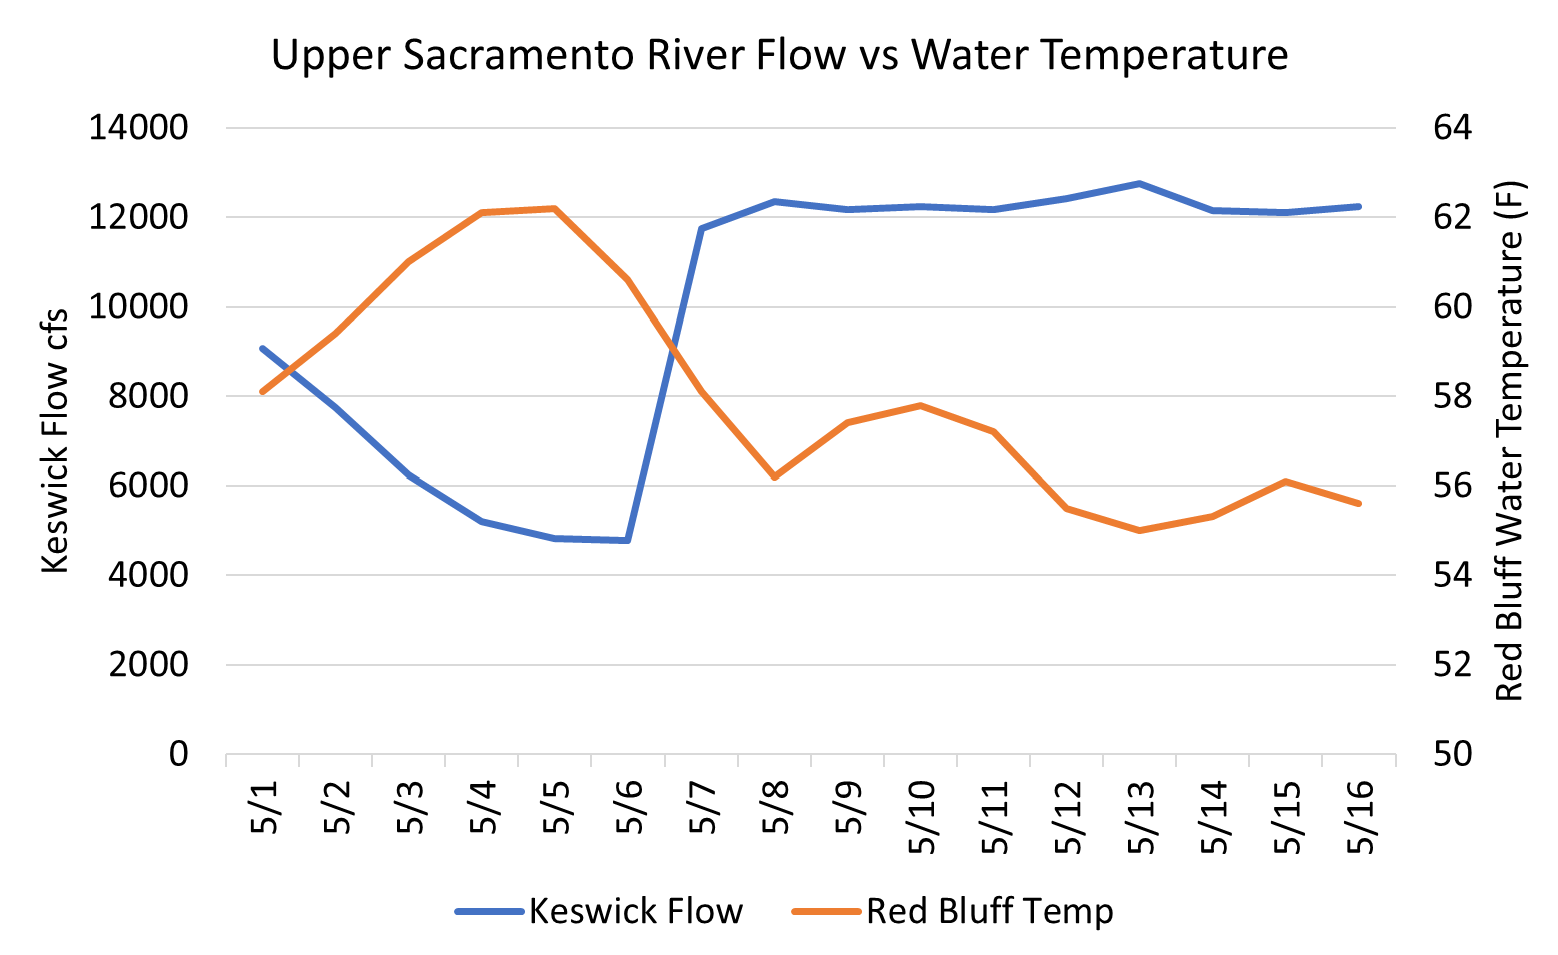
Figure 1. May 2017 flow and water temperature conditions in upper Sacramento River. Source: CDEC.
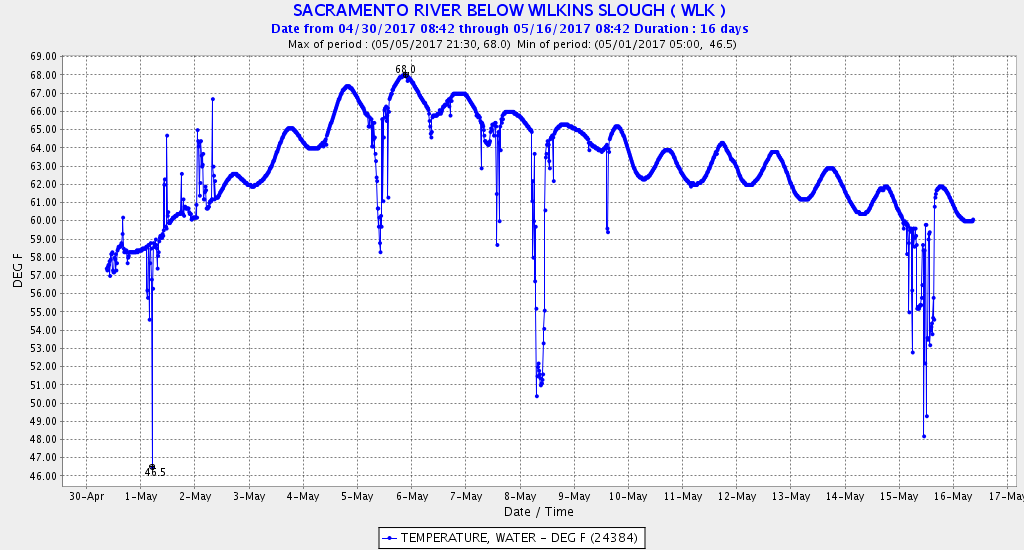
Figure 2. May 2017 water temperature in lower Sacramento River at Wilkins Slough. Source: CDEC.
- The Coleman Hatchery near Redding on Battle Creek is operated by the US Fish and Wildlife Service. The hatchery operates under the Central Valley Project as mitigation for Shasta Dam on the upper Sacramento River ↩
- http://calsport.org/fisheriesblog/?p=1703 ↩
- http://calsport.org/fisheriesblog/?p=878 ↩
- Survival rate is defined as percent of smolts that were subsequently collected as adults in fisheries, spawning surveys, and at Central Valley hatcheries. Average rate of multiple groups is shown. ↩
- Poor ocean conditions in 2007-2009 likely contributed to poor survival. ↩