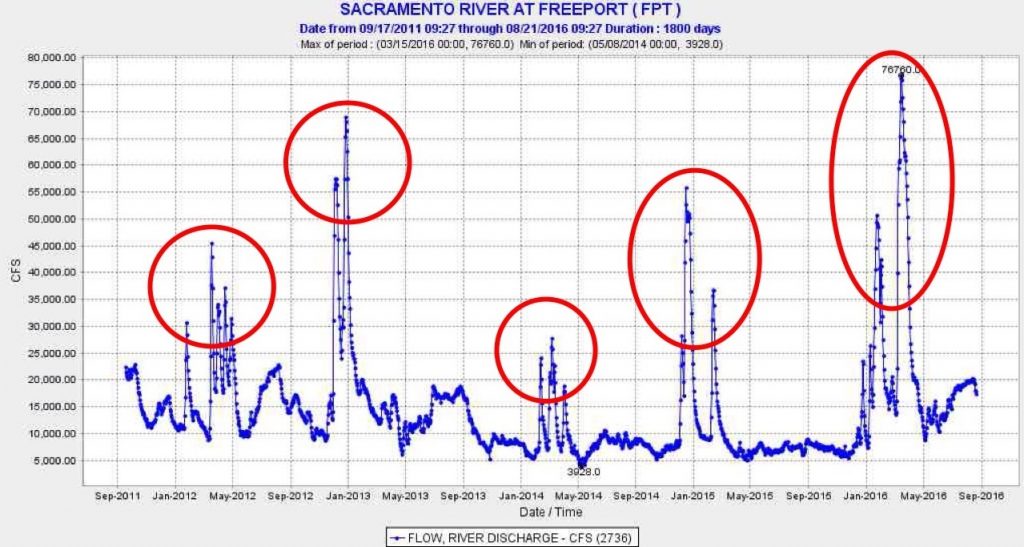
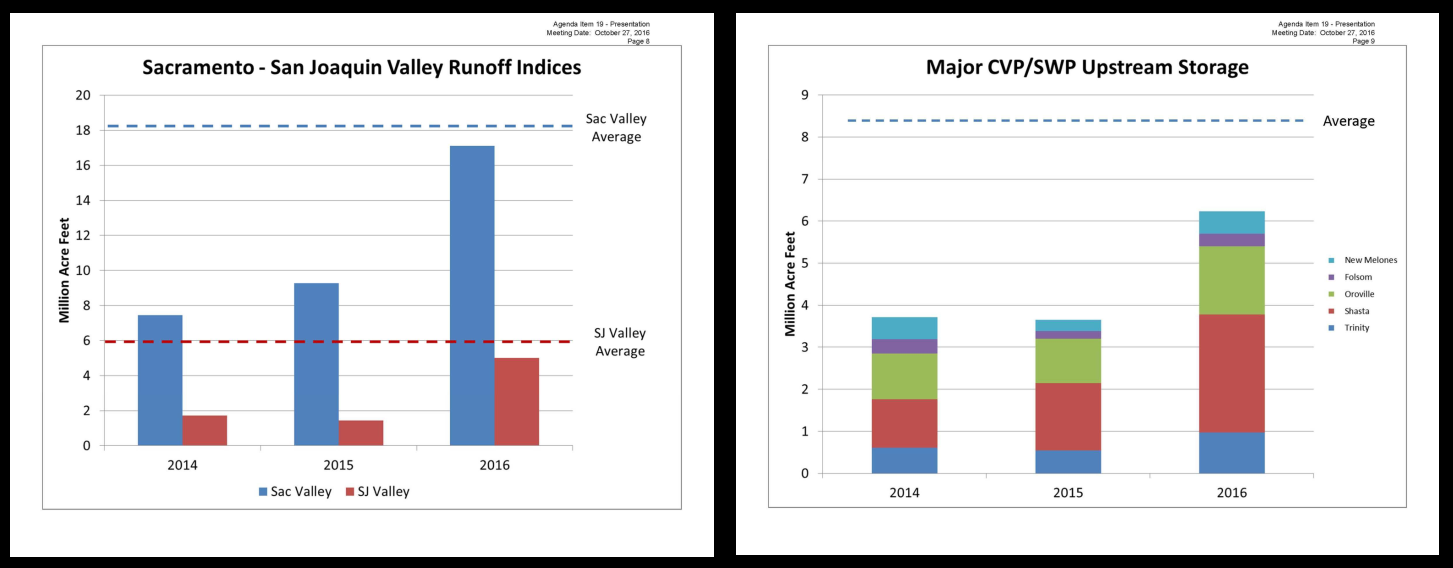
At an October 27, 2016 meeting of the Delta Stewardship Council, John Leahigh, Department of Water Resources chief operator for the State Water Project, briefed the council on Water Year 2016. Precipitation-runoff and reservoir storage were up considerable compared to 2014 and 2015. However exports were lower than expected, with reduced deliveries – only 5 to 75% – to south of Delta water contractors.
 Mr. Leahigh attributed lower Delta exports to several factors:
- A concerted effort to conserve Shasta storage (for winter-run salmon) at the expense of water deliveries, mainly to south-of-Delta contractors.
- Higher summer Delta outflow that was needed to repel saltwater intrusion into the Delta caused by higher-than-normal tides associated with the warm-water “blob” along the coast. (This outflow served the dual purpose of reducing the salinity of Delta export water and allowing the water projects to meet salinity standards for Delta agriculture – see previous post.)
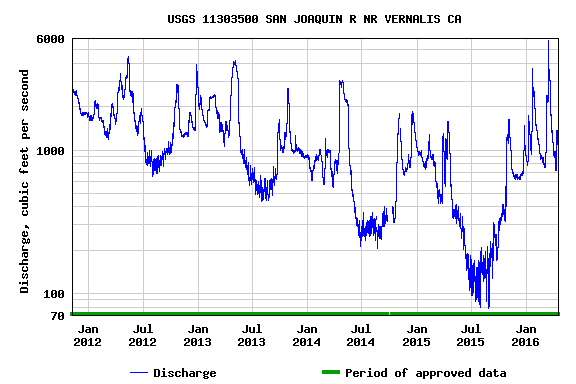
- Lower San Joaquin River Delta inflow that “creates a dynamic in the Delta that makes it difficult to move stored water from the Sacramento basin to the south Delta”.
- An inability to export Valley stormwater in winter-spring: “If we don’t pick it up, it ends up in the Bay and into the ocean.” (This is a not-too-subtle reference to winter-spring export restrictions for endangered fish and pitch for the proposed Delta tunnels.)
Mr. Leahigh concluded: “I think the key messages would be flexibility, nimbleness, and the fact that we have processes in place that would help us react to whatever we end up seeing in the coming year; there’s always a new challenge with respect to the hydrologic pattern and the regulatory environment, so just having those processes in place puts us one step forward.”
The important lesson here is that the state and federal water projects are flexible and nimble when it comes to water exports and deliveries. When it comes to the short-term needs of the fish and their habitat, not so much. The projects are ready with Temporary Urgent Change Petitions to benefit water deliveries, but not the environment.