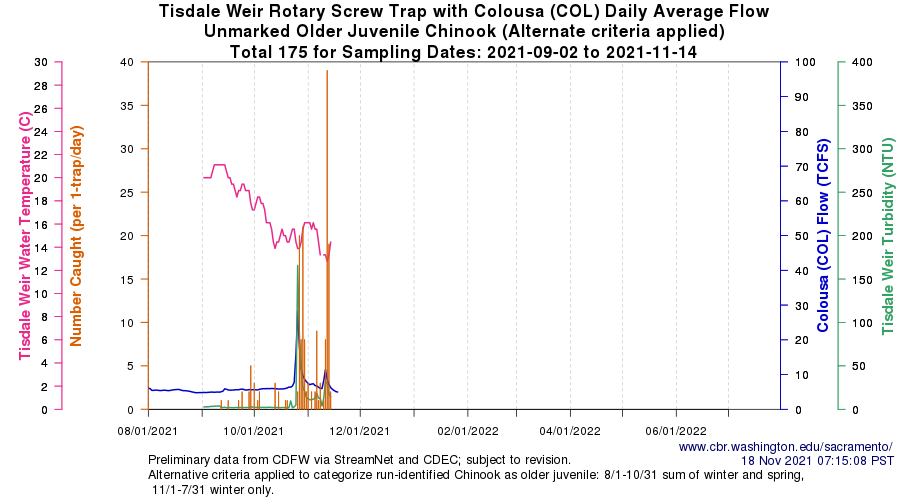
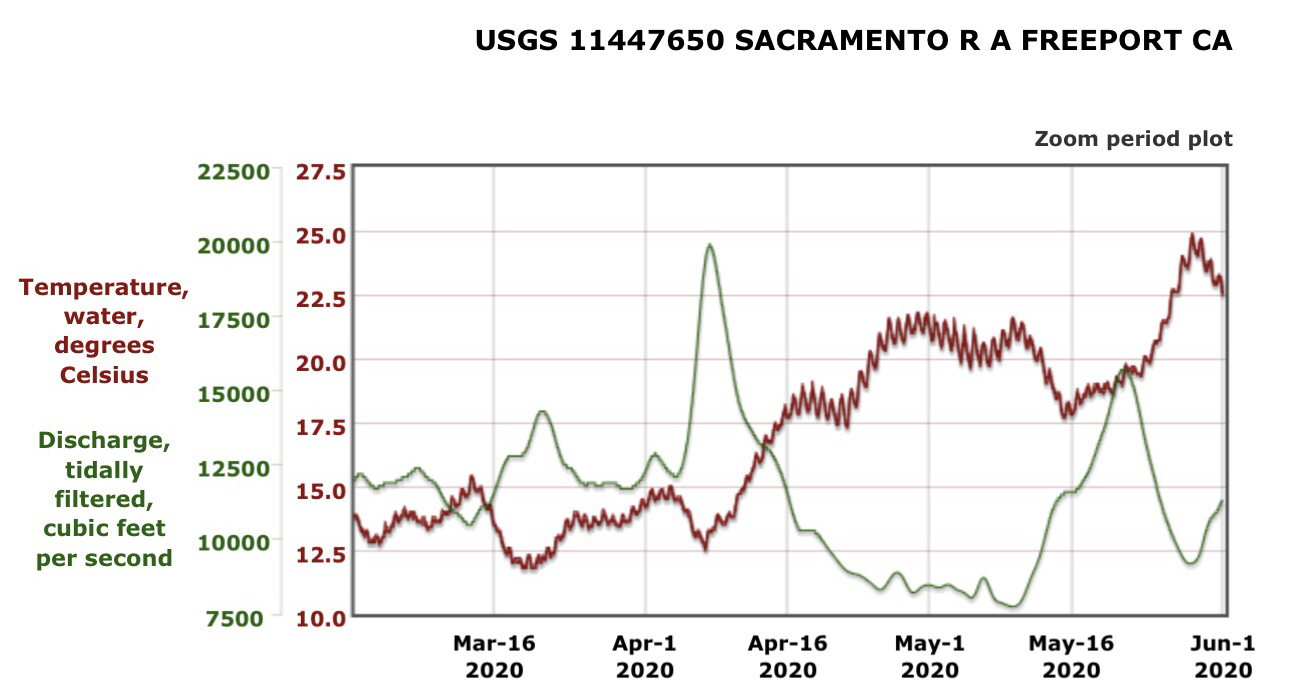
During early November, juvenile winter-run salmon were moving into the Delta after two short fall rainfall pulses (Figure 1). The allowed export of 65% of Delta inflow is not protective of these wild young winter-run salmon, which are in short supply this year. My October 30 post, in which I warned about the threat of rising Delta exports on this year’s production of juvenile winter-run salmon entering the Delta, is being borne out.
From November 9-12, south Delta exports exceeded 70% of Delta inflow,1 with about 2000 cfs of calculated Delta outflow. The USGS measurement of Delta outflow on November 8-9 was as low as -3000 cfs. Delta exports were simply drawing from the Delta’s freshwater reservoir supplied by the recent rains. The cries of San Joaquin Valley farmers for the capture of the runoff before it was “wasted” into the Bay and Ocean were indeed being answered. The Delta export pumps were shipping 15,000-20,000 acre-feet of water south each day.
Up at the Delta Cross Channel (open) and Georgianna Slough, over half the daily flow was being diverted into the central Delta. With the False River Barrier installed, most of the diverted water (and young salmon) flowed south toward the export pumps. Since no young salmon were showing up in the export fish salvage collections, it is likely that few successfully made the 50-mile journey from the northern Delta through the predator-laden central Delta corridor.
Hopefully, the several hundred thousand winter-run hatchery smolts will have better circumstances when they are released this winter near Redding for their 300-mile migration to the ocean.
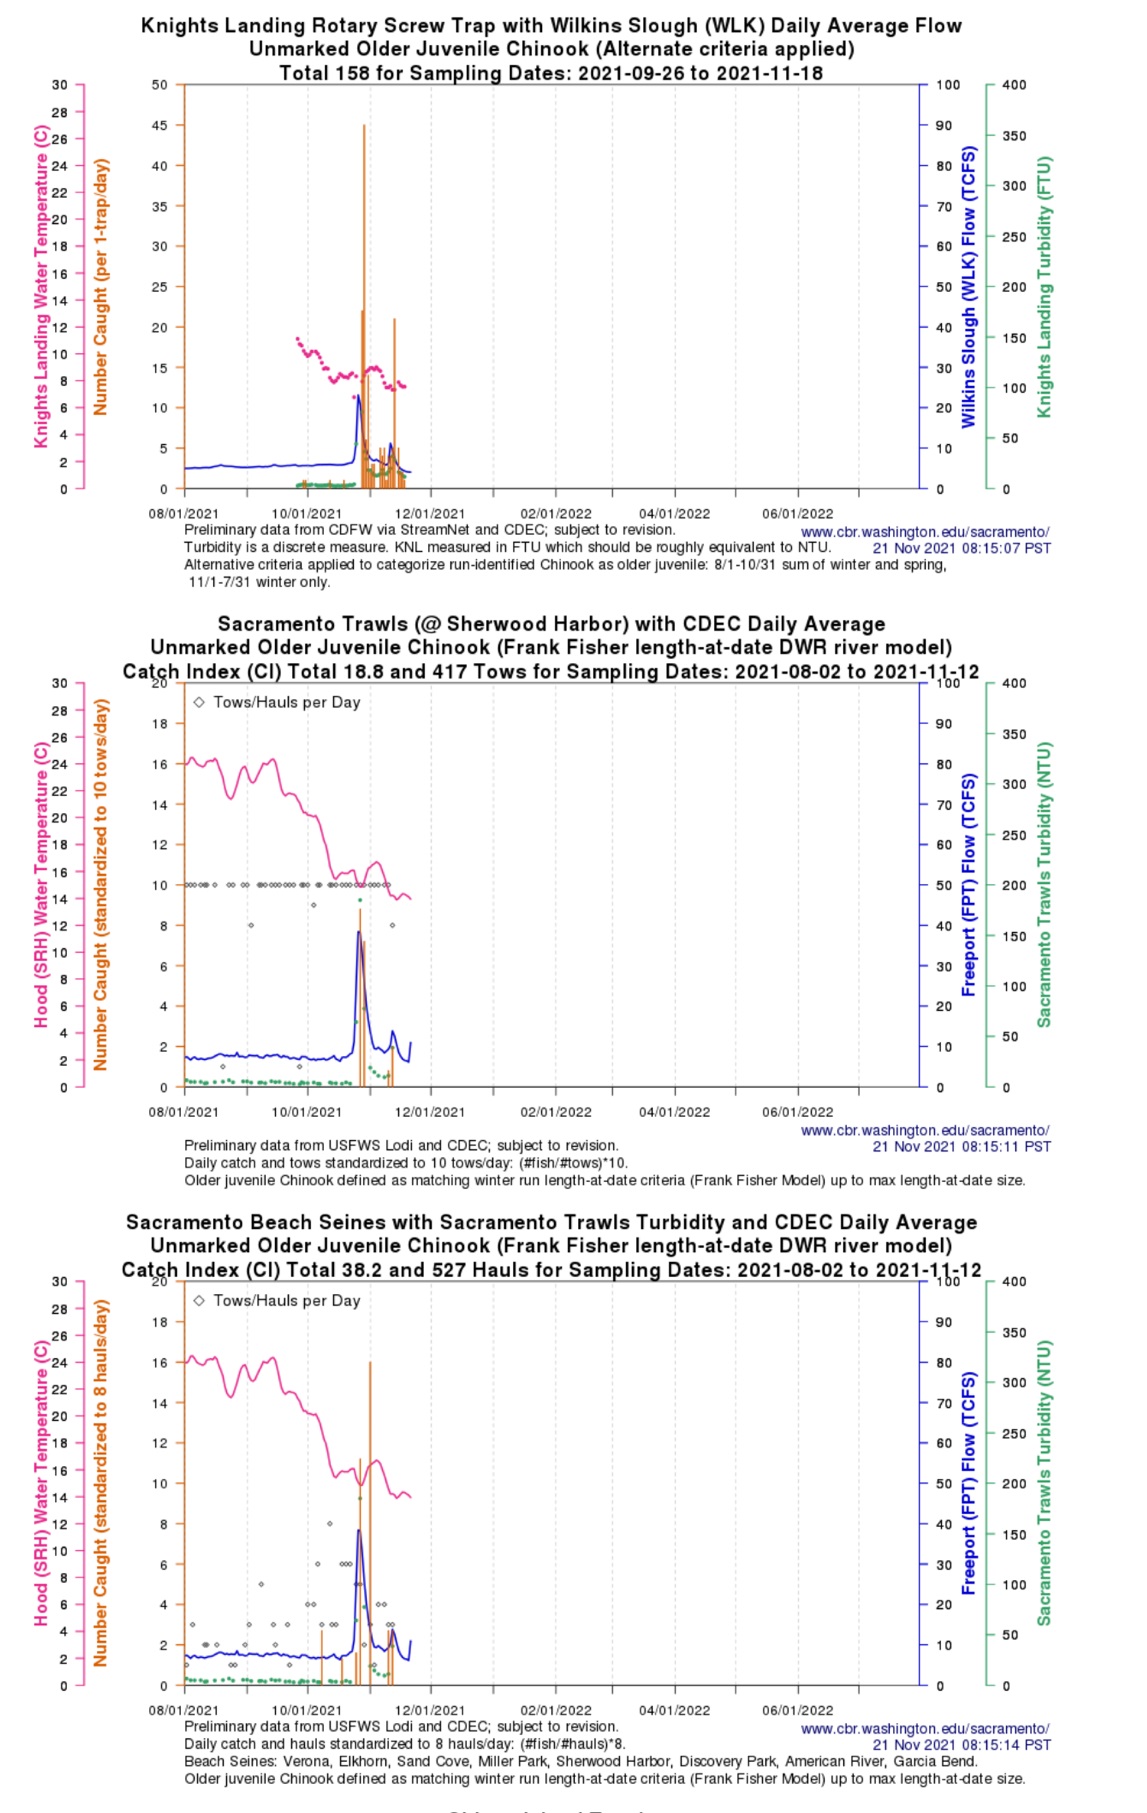
Figure 1. Capture of juvenile winter run salmon in the lower Sacramento River in 2021.