The Problem
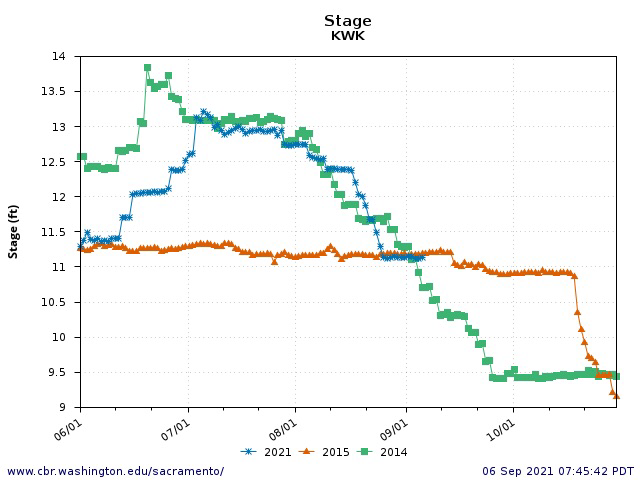
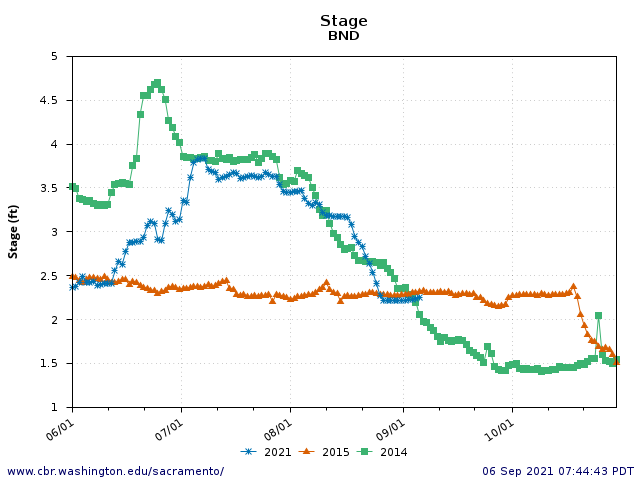
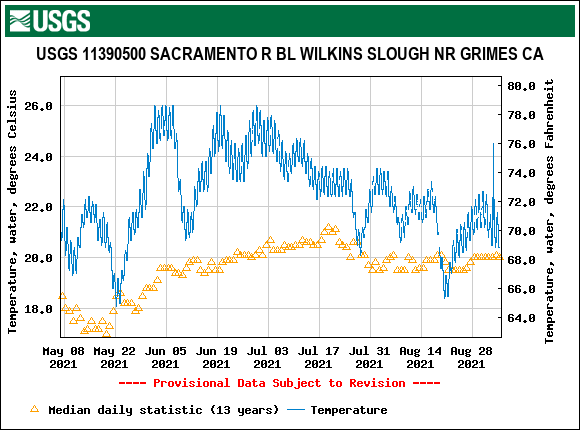
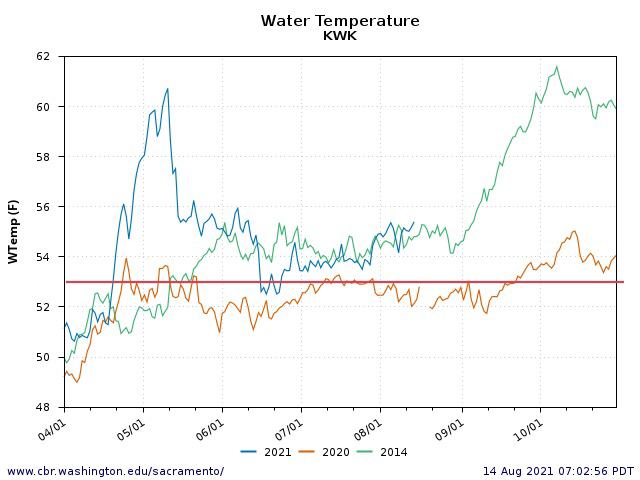
The 2021 target upper water temperature limit for salmon spawning and gravel-bed egg incubation below Shasta/Keswick dams on the Sacramento River near Redding was 55oF. It is a little late for that now. Since September 1, Keswick releases have been greater than 56.5ºF, and are now approaching 58ºF. That’s too warm for the winter-run salmon who have finished spawning (Figures 1 and 2).
But what about the far larger run of fall-run salmon during their peak October spawning? Can water temperatures downstream of Keswick be lowered back to 55oF in October? The answer is a qualified yes.
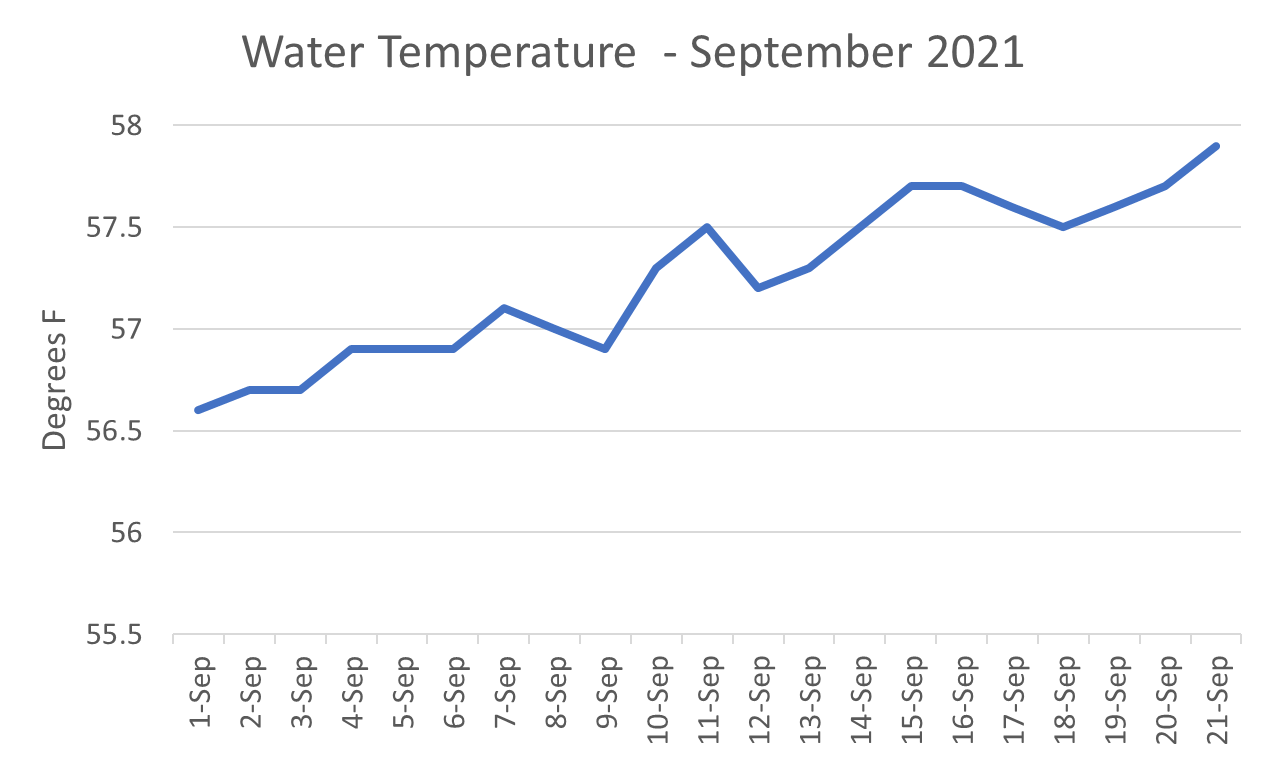
Figure 1. Daily average water temperature of Sacramento River near Redding (SAC gage), September 1-21, 2021.
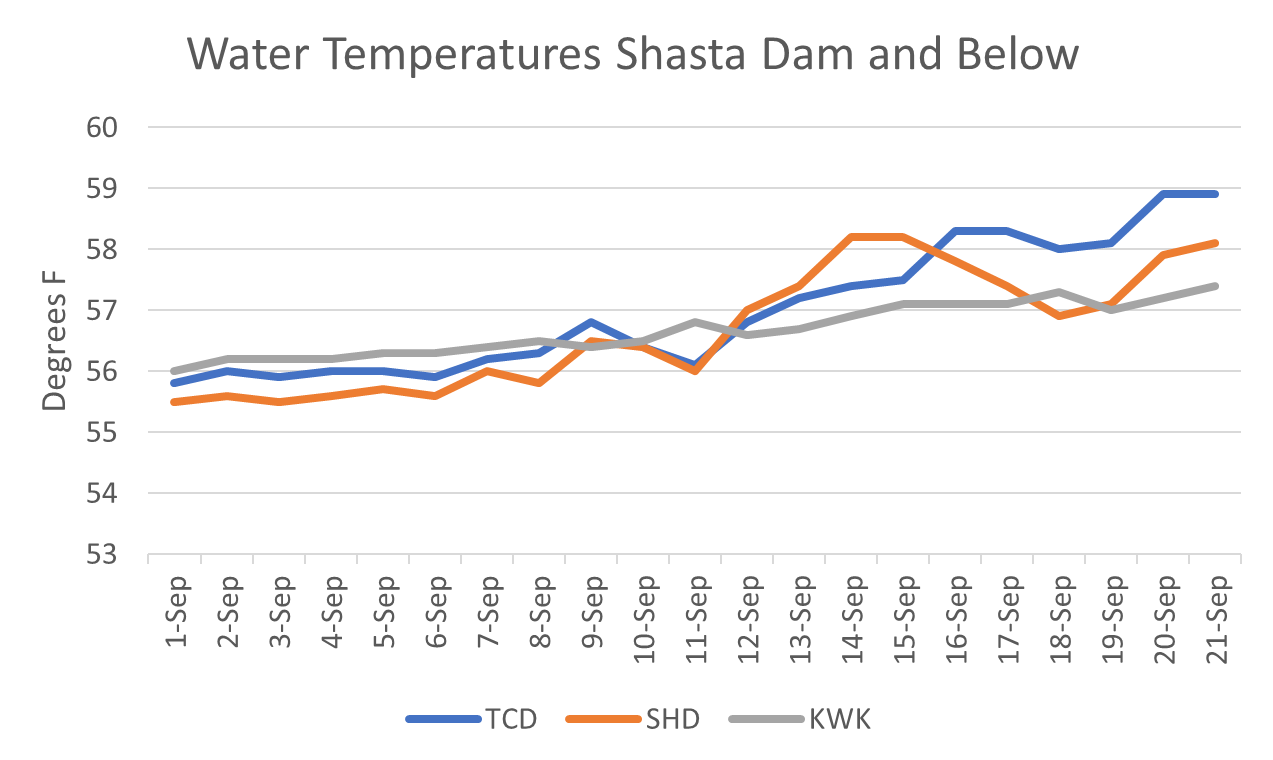
Figure 2. Daily average water temperatures from Shasta Dam powerhouse (TCD), immediately below Shasta Dam (SHD), and from Keswick Dam (KWK) to Sacramento River, September 1-21, 2021.
The Solution
A “qualified yes” means it would be a complex undertaking involving two actions possible under Reclamation’s operation of its Shasta/Trinity Division:
- Switching most or all of Shasta releases to the cold-water lower river outlets of the dam and ceasing warm-water hydropower releases from the dam’s powerhouse.
- Minimizing warm-water hydropower releases from Whiskeytown Lake to Keswick Reservoir.
Much of the remaining cold-water pool in Shasta Reservoir is being used to overcome warm-water hydropower releases into Keswick Reservoir (~60oF or higher) before water is released to the Sacramento River below Keswick Dam. Cutting hydropower releases and rationing the available cold-water-pool supply through Shasta Dam’s lower river outlets is therefore a potential solution to warm water releases to the river. Though this would reduce hydropower in the short-term, it would save storage in the long-term.
The solution would require a substantial reduction in Shasta Reservoir releases to ensure the cold-water-pool is not exhausted over the next month or more. However, reducing releases would lower river water levels and strand salmon redds or reduce egg-embryo survival of remaining active winter-run redds or any newly spawned spring-run and fall-run redds.
A possible resolution is to drop flows after the vast majority of winter-run fry have left their redds and before most of the fall-run salmon have spawned. This has been the standard management approach in many years to save storage – sometime in late September or in October.
Further Context
Under present conditions in late September 2021, access to the cold-water pool in Shasta Reservoir occurs primarily during the afternoon/evening, during peaking-power releases (Figures 3-5) from the penstocks via the Temperature Control Device (TCD) on the face of the dam. Side-gate openings on the TCD (Figure 6) are able to pull cold water from below only during peak releases. This pattern indicates that a modified solution might be to reduce warm-water power releases during non-peak operations, while retaining some peaking power releases from Shasta Dam in combination with lower level dam outlet releases.
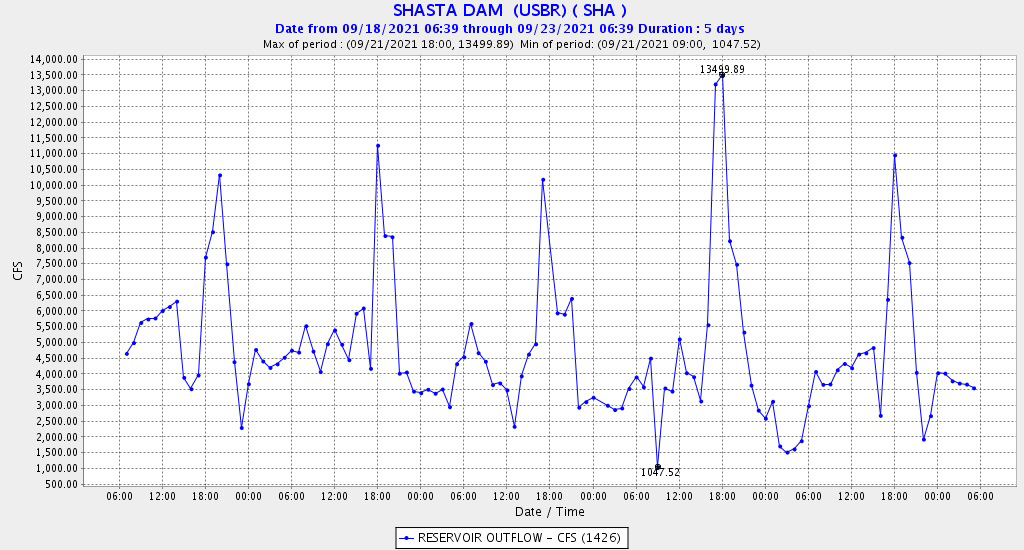
Figure 3. Hourly flow releases from Shasta Dam September 18-23, 2021.
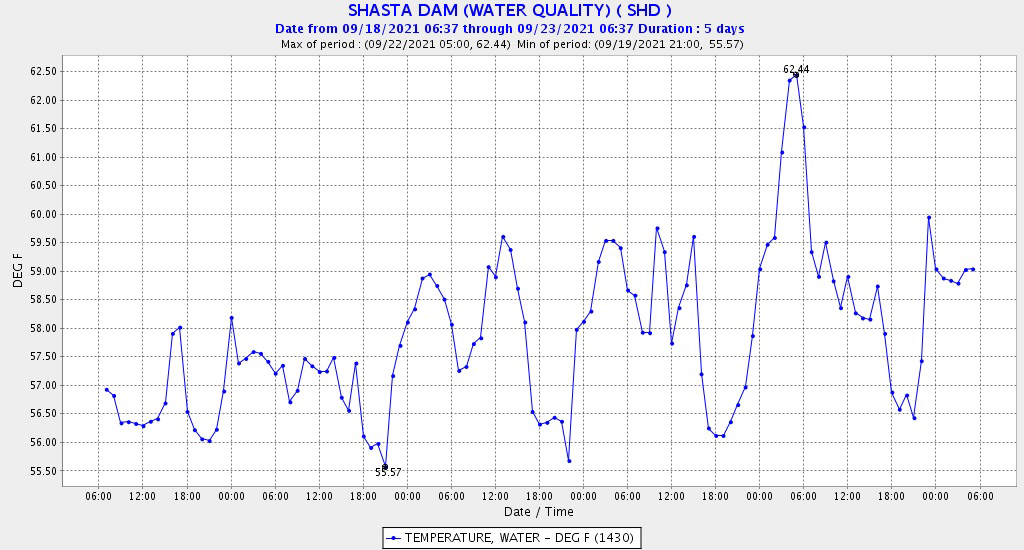
Figure 4. Hourly water temperature of water releases from Shasta Dam September18-23, 2021.
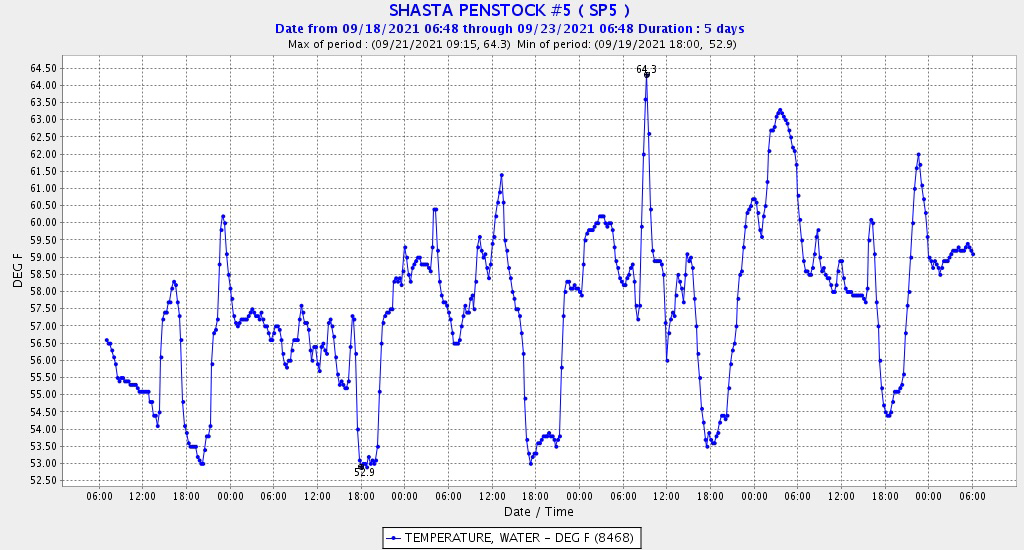
Figure 5. Hourly water temperature of water releases from a Shasta Dam penstock September18-23, 2021.
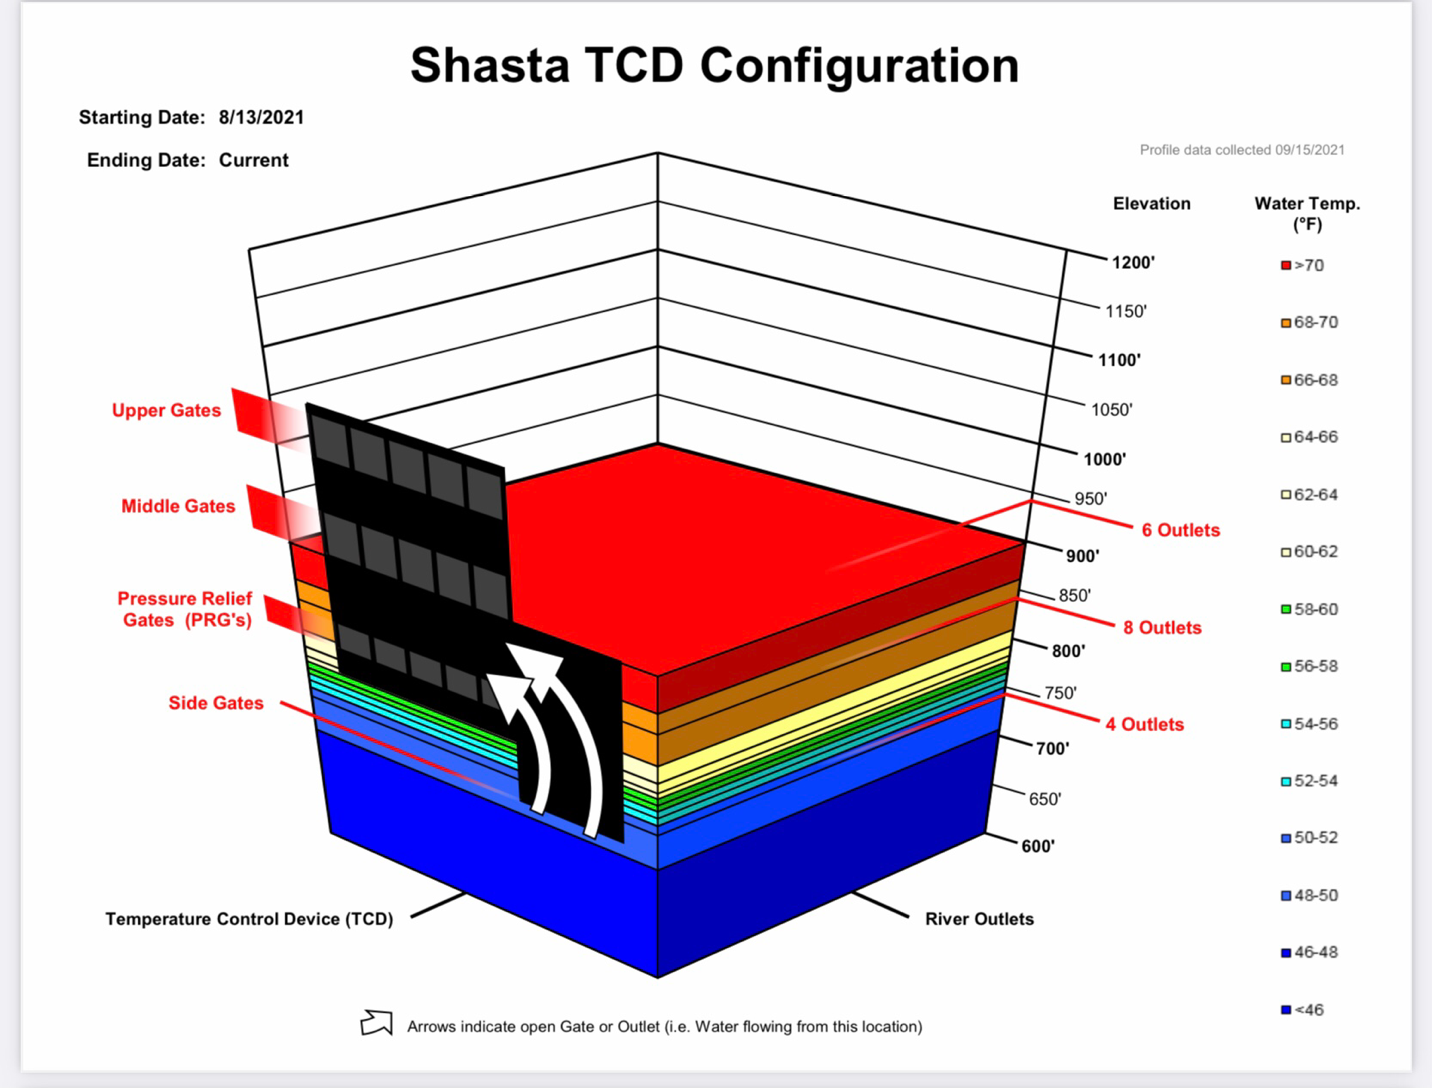
Figure 6. Shasta Dam conditions and operation on September 15, 2021.