
Following an introductory post, this is the second post in a series on the lessons learned by the National Marine Fisheries Service (NMFS) from the 2013-2015 drought that devastated Sacramento River salmon populations. The first post addressed Lesson #1 and its non-application in the first half of 2020.
This post addresses how the non-application of Lesson #1 in 2020 evolved into a tug-of-war in the second half of 2020 and has cascaded into non-action so far in 2021. For more detail and links, see CSPA’s March 15, 2021 letter to the State Water Board urging immediate action to protect Sacramento River and Delta fisheries in 2021. See also the State Water Board’s Sacramento River Temperature web page, though some of the links are not live, at: https://www.waterboards.ca.gov/waterrights/water_issues/programs/drought/sacramento_river/index.html
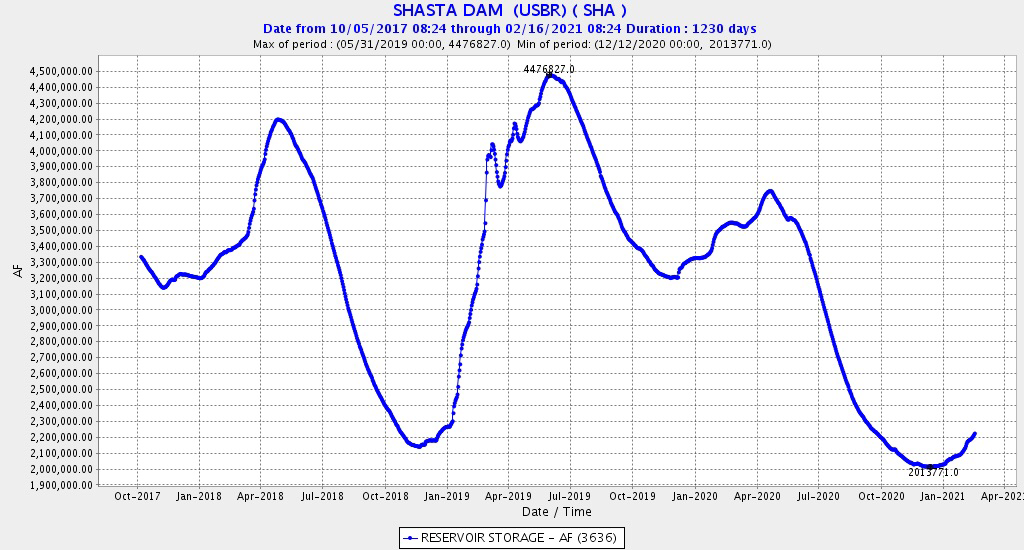
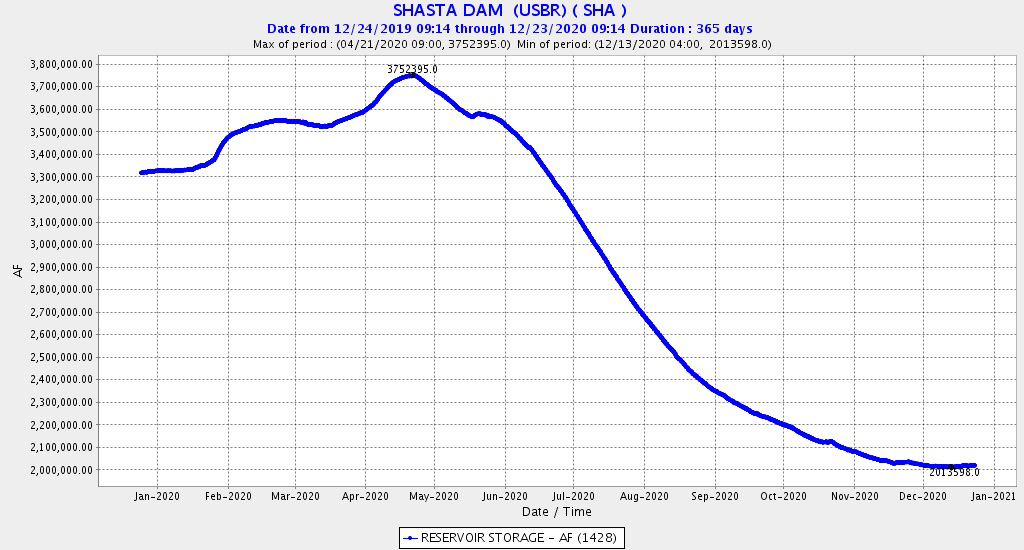
 Water and fisheries managers have known for many years that both the Lake Shasta storage level on April 1 and spring releases from Shasta determine how much cold water will be available in the lower Sacramento River through the summer. However, in 2020, as discussed in Part 1 of this series, the Bureau of Reclamation (Reclamation) refused to decide on water temperature management options for Shasta Reservoir and the lower Sacramento River before April 1. Reclamation submitted a draft temperature management plan (TMP) to the State Water Board on April 23 and a final TMP on May 20, neither of which evaluated reduced delivery options whose analysis the State Water Board had requested.
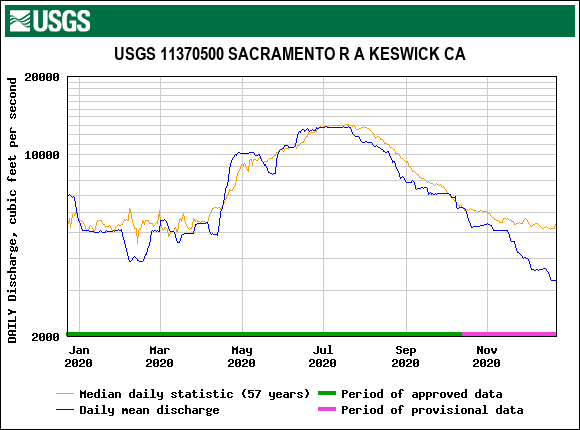
Meanwhile, Reclamation was operating in 2020 in the first year of the new Trump-era Biological Opinions for the long-term operation of the Central Valley Project (CVP) and the State Water Project (SWP).1 The stated purpose of these Opinions was to “maximize deliveries” of water to contractors, and did they ever deliver. See part of the results in Figure 4 of the previous post: very high deliveries to Sacramento River CVP contractors in April and May, so that water in Lake Shasta was committed before the plan to operate Shasta was complete.
By June 1, 2020, the State Water Board had rejected Reclamation’s TMP. In its June 1, 2020 letter refusing Reclamation’s May 20 TMP, the State Water Board wrote:
Reclamation has declined to evaluate additional operational scenarios. Reclamation’s position is that scenarios with different operational assumptions would be inconsistent with its contractual obligations, and are therefore beyond Reclamation’s reasonable control. The State Water Board disagrees. To the extent that Reclamation delivers water under its own water rights, Reclamation’s obligation to deliver water to its contractors does not take precedence over its permit obligations.
On July 17, 2020, CSPA and its partners reached a settlement agreement with the State Water Board that dealt in substantial part with Sacramento River temperature management. The settlement agreement requires the State Board to conduct a transparent Sacramento River Temperature Management process. The process must address all controllable factors, including deliveries, and ensure adequate staffing, modeling and public review. The CSPA settlement became part of the dispute between Reclamation and the State Water Board in the following months.
After exchanges of letters between Reclamation and the State Water Board in June and July, and an addendum to the TMP on July 31, the State Water Board gave up on 2020 and in an August 4 letter tentatively approved the TMP, subject to conditions, two of which stated:
- Reclamation shall develop a draft protocol by September 30, 2020, that meets the criteria identified by the State Water Board;
- By September 15, 2020, Reclamation shall provide additional information concerning fall operations, including the volume and timing of releases and deliveries each month through December.
On August 31, the State Water Board sent a follow-up letter clarifying its request of Reclamation:
As part of the State Water Board’s conditional approval of Reclamation’s 2020 Temperature Management Plan (TMP), Reclamation is required to develop an initial draft protocol by September 30, 2020. The State Water Board will hold a public workshop this fall in coordination with Reclamation to receive public comment on the initial draft protocol to inform its completion. Once public comments are received, the Board intends to work with Reclamation to refine and finalize the protocol before the beginning of the next temperature planning and water supply allocation season in February 2021. The Board has requested that the protocol include the elements specified in the settlement agreement with the California Sportfishing Protection Alliance, et al., which the Board recently forwarded to Reclamation. This letter provides additional detail regarding issues that should be addressed as part of the protocol.
None of it happened. No protocol. No public workshop. No public comments. No disclosure to the State Water Board of the timing and releases of release and deliveries from September through December. No final protocol by February 2021. Instead, one final letter from Reclamation on September 30, deflecting the issue to the settlement with CSPA even though the issues in the settlement were issues raised by the State Water Board months before the settlement was completed: “Reclamation does not consider a state court voluntary settlement, to which Reclamation is not a party, as valid, enforceable legal requirements imposed on Reclamation.”
After all the correspondence, Reclamation affirmed on September 30 that it was right the first time: “The process for analyzing conditions and incorporating the best information into water management decisions for temperature management at Shasta Reservoir is outlined in the Shasta Cold Water Pool Management Flow Guidance document which was shared with the State Board staff on April 2, 2020.”
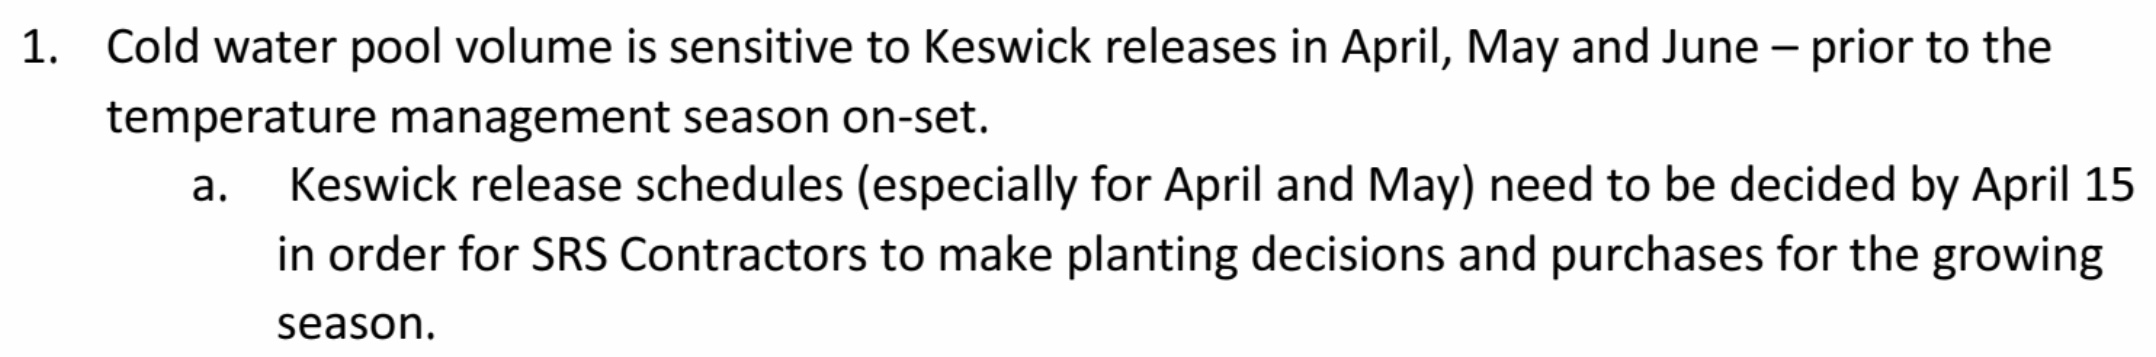
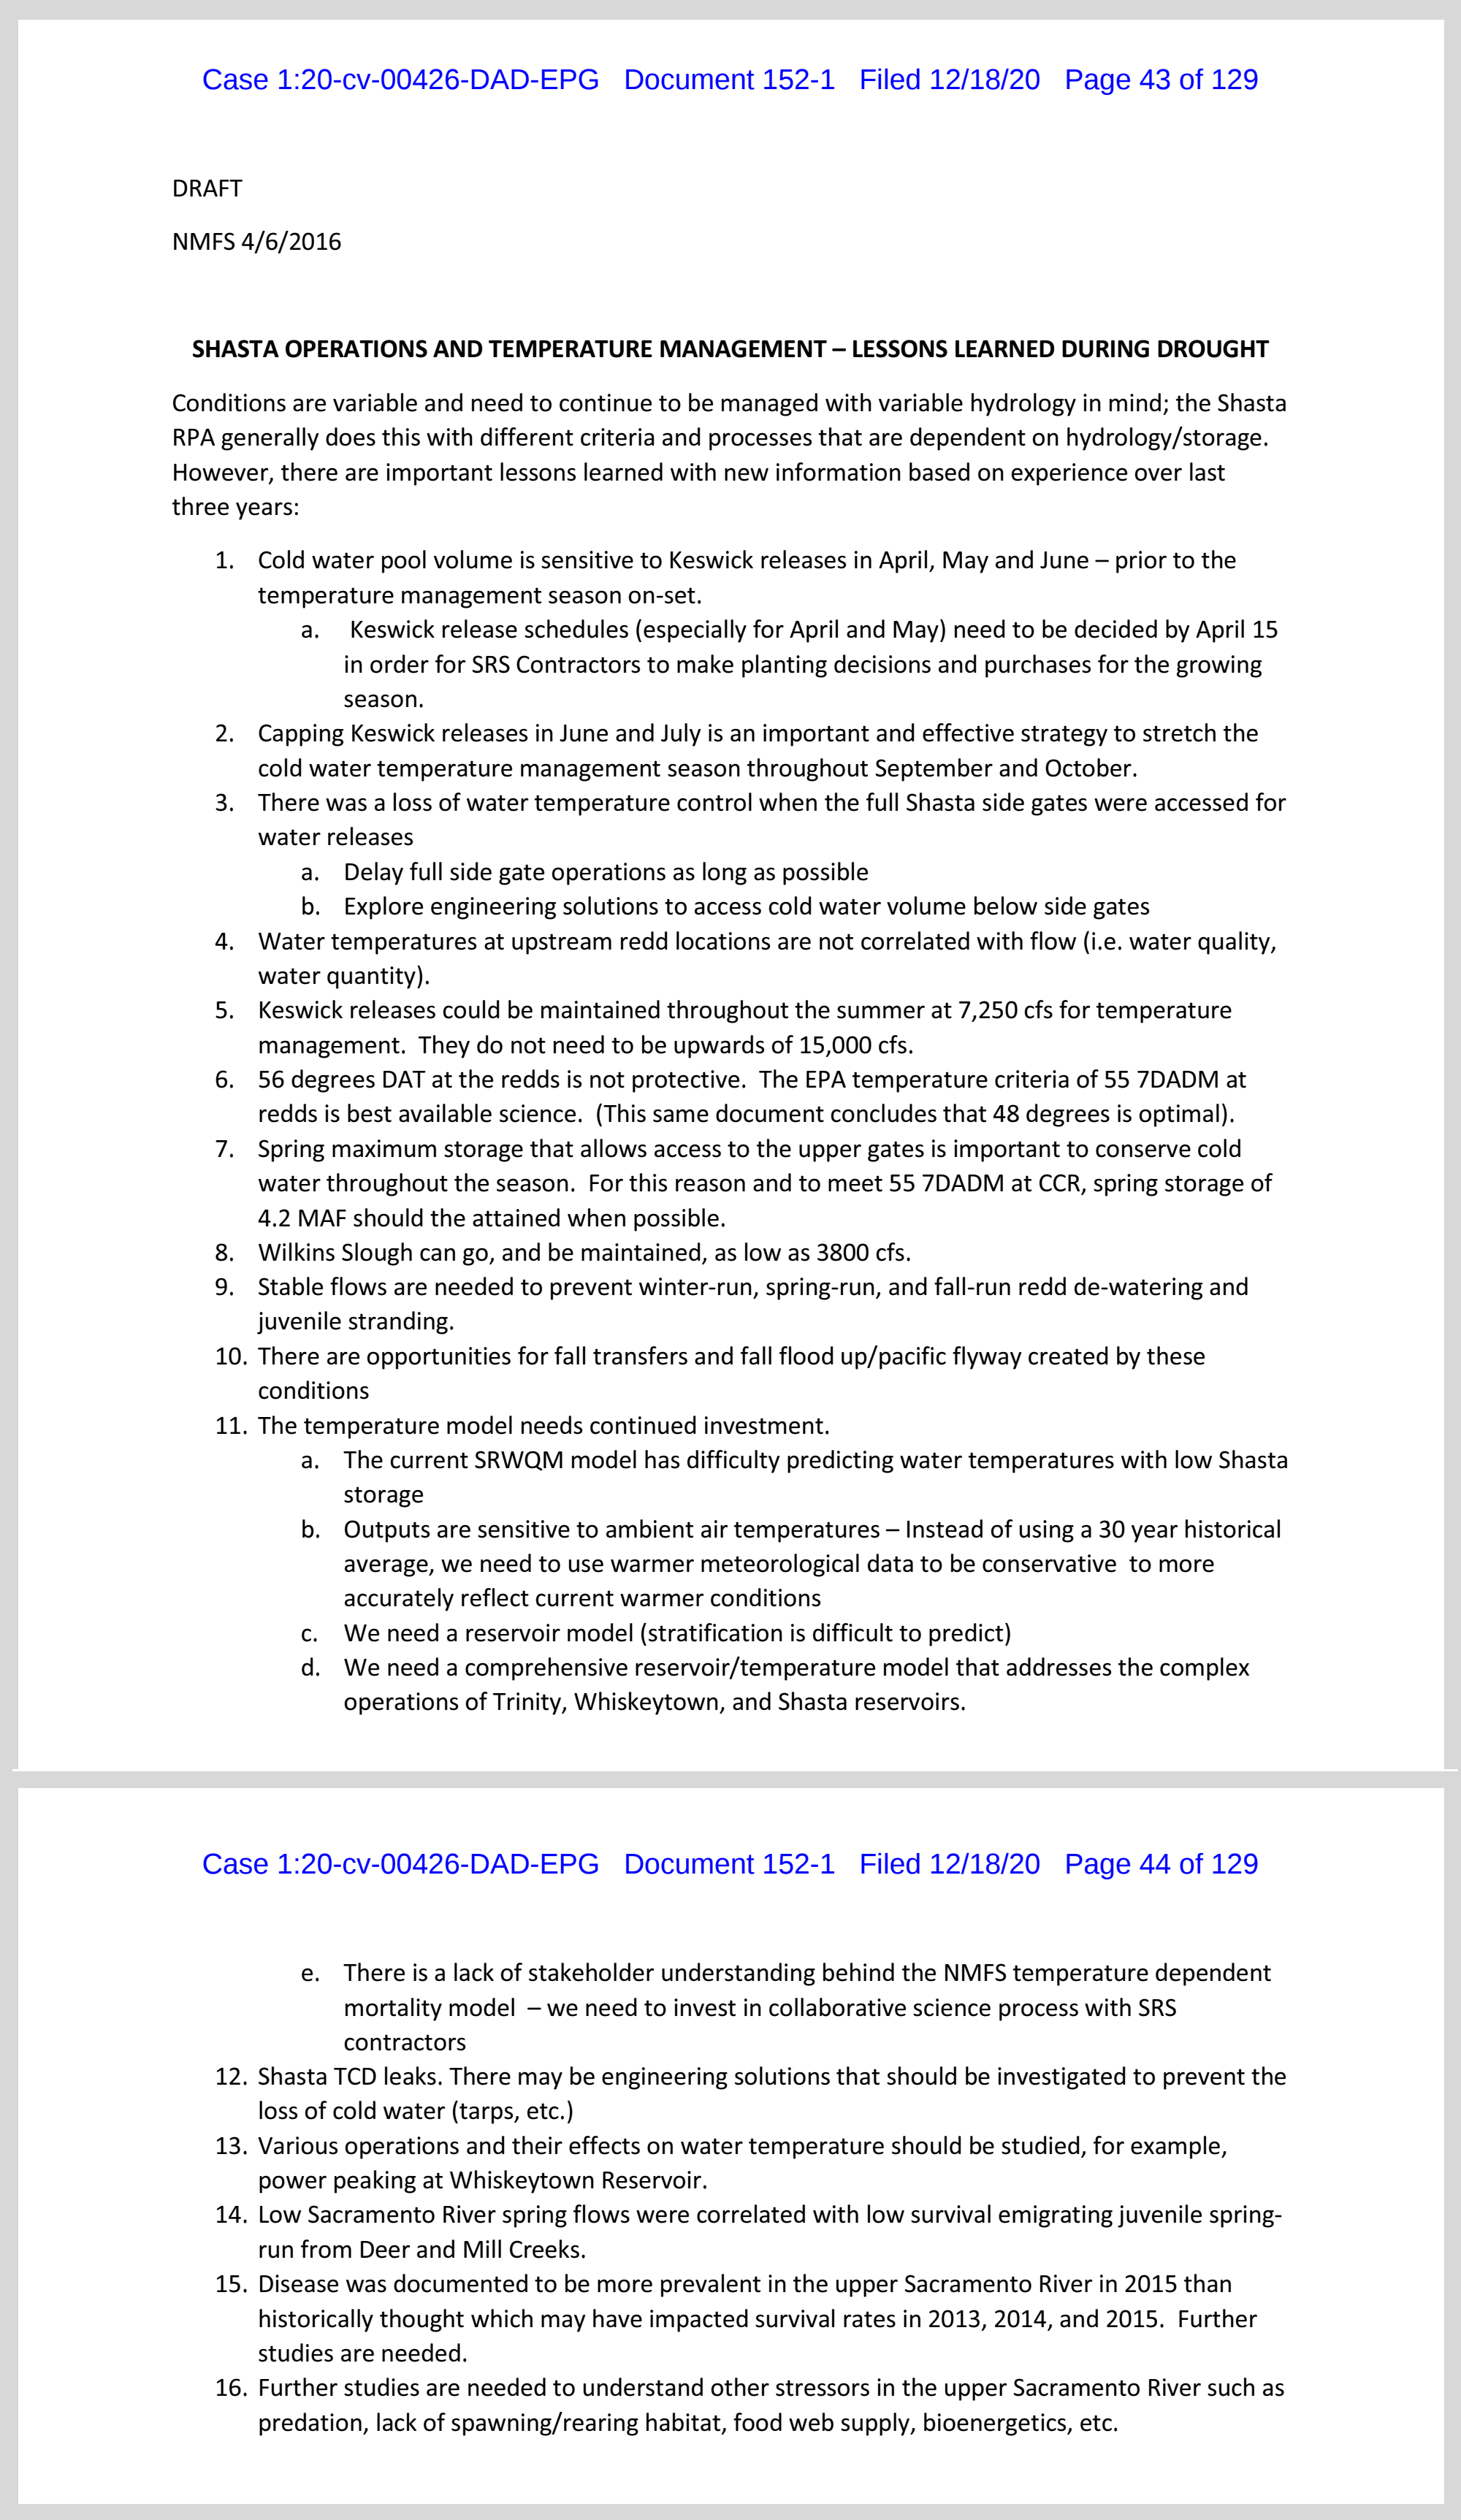
And so it comes full circle. Faced with adversity last fall, the State Water to date performed as it all too often has: it has done nothing. The Ides of March have passed, and there is every sign that the State Water Board will for a second straight year allow Reclamation to once again defy Lesson #1: Keswick releases need to be decided by April 15.
- For analysis, see https://calsport.org/fisheriesblog/?p=2889. ↩