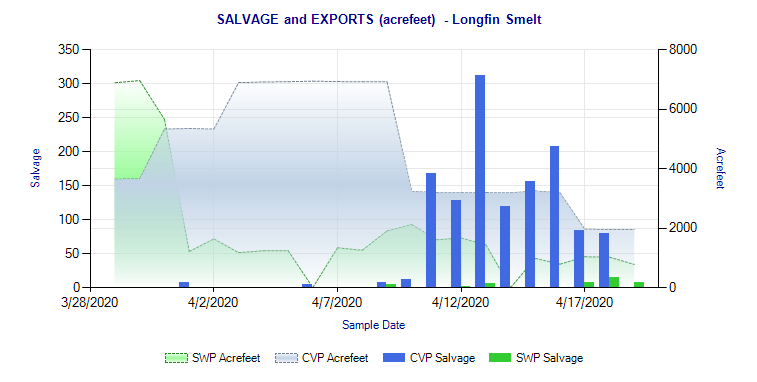
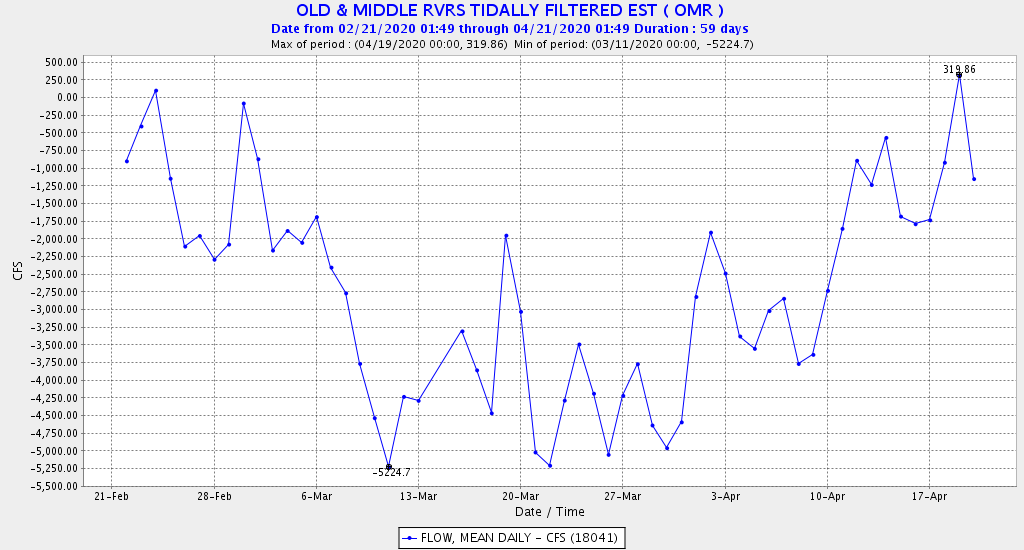
In a May 2019 post, I described the central Delta as a salmon trap for juvenile salmon. This post describes the “smelt trap.” Franks Tract in the central Delta (Figure 1) is a longfin and Delta smelt trap. Longfin smelt were vulnerable to the trap in March 2020 (Figures 2 and 3). Flow was reversed in False River (Figure 4) because of south Delta exports.
It’s not just the net flow that makes Franks Tract a smelt trap. It is also tidal pumping of 50,000 cfs in-and-out. What goes into Franks Tract on the flood tide does not come back out the same (Figures 5-9). It is different water, warmer, clearer, with less plankton, and probably less smelt larvae and juveniles. Smelt are simply tidally-pumped into the central Delta where they are susceptible to warmer, less turbid, predator-laden waters of Franks Tract and the central and south Delta. Most young smelt probably succumb before reaching the south Delta export pumps.
This is another reason why winter Delta exports need restrictions and why the Franks Tract restoration project with its tide gate on False River needs to proceed as part of the state’s program to recover longfin and Delta smelt. For more detail on the proposed project see: https://mavensnotebook.com/2019/02/07/bay-delta-science-conference-franks-tract-feasibility-study-applying-the-guidance-of-a-delta-renewed/ .
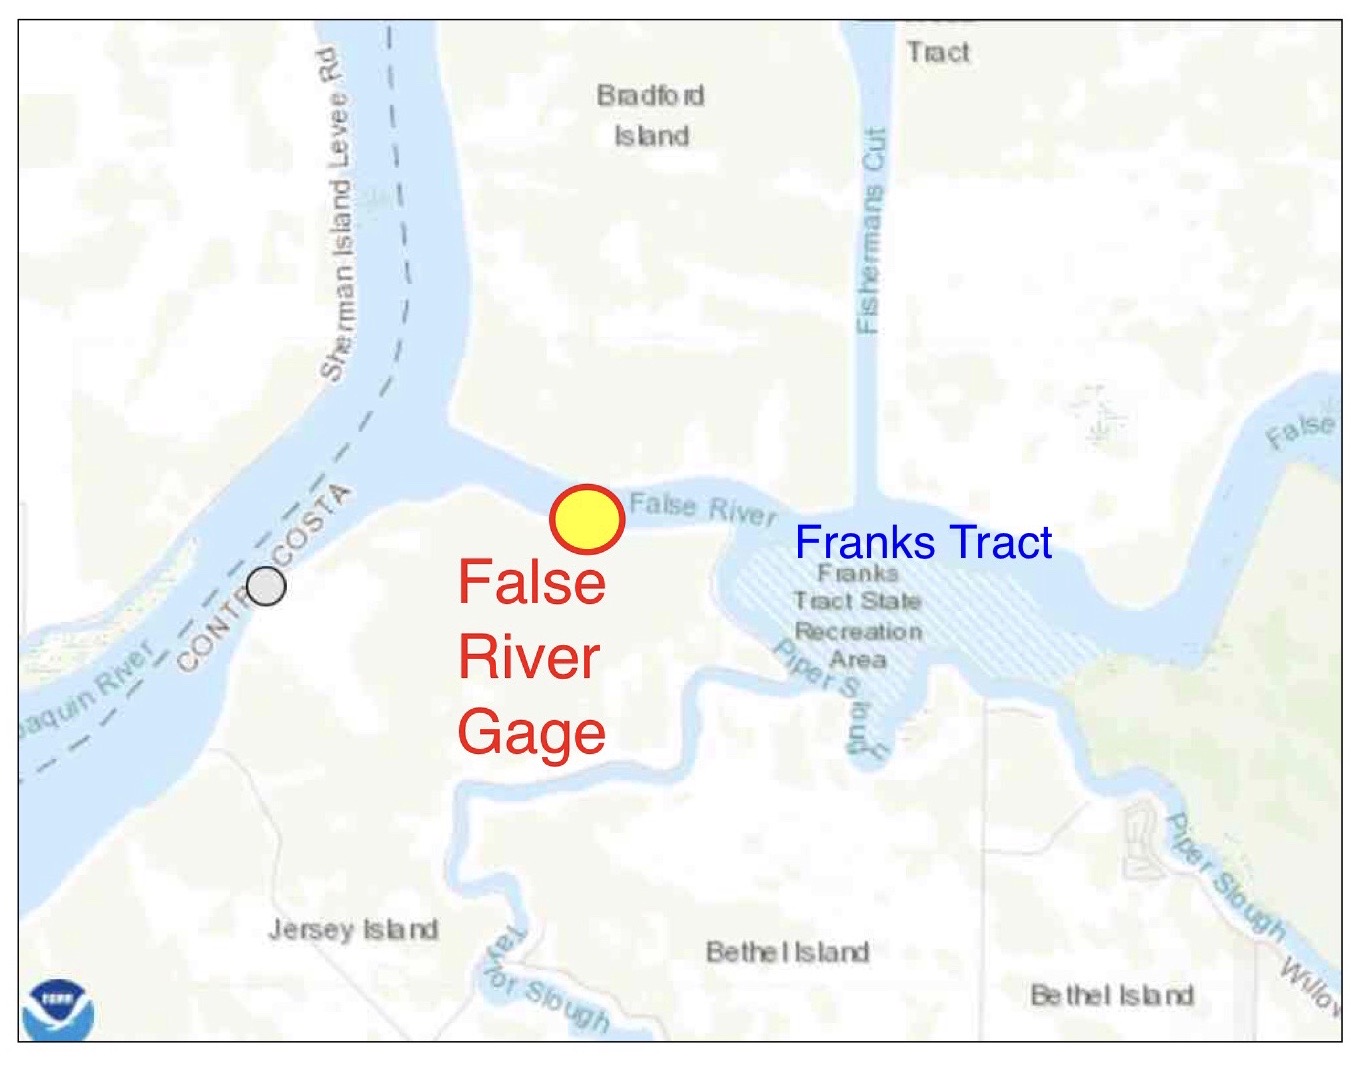
Figure 1. Franks Tract and False River gage location in west Delta.
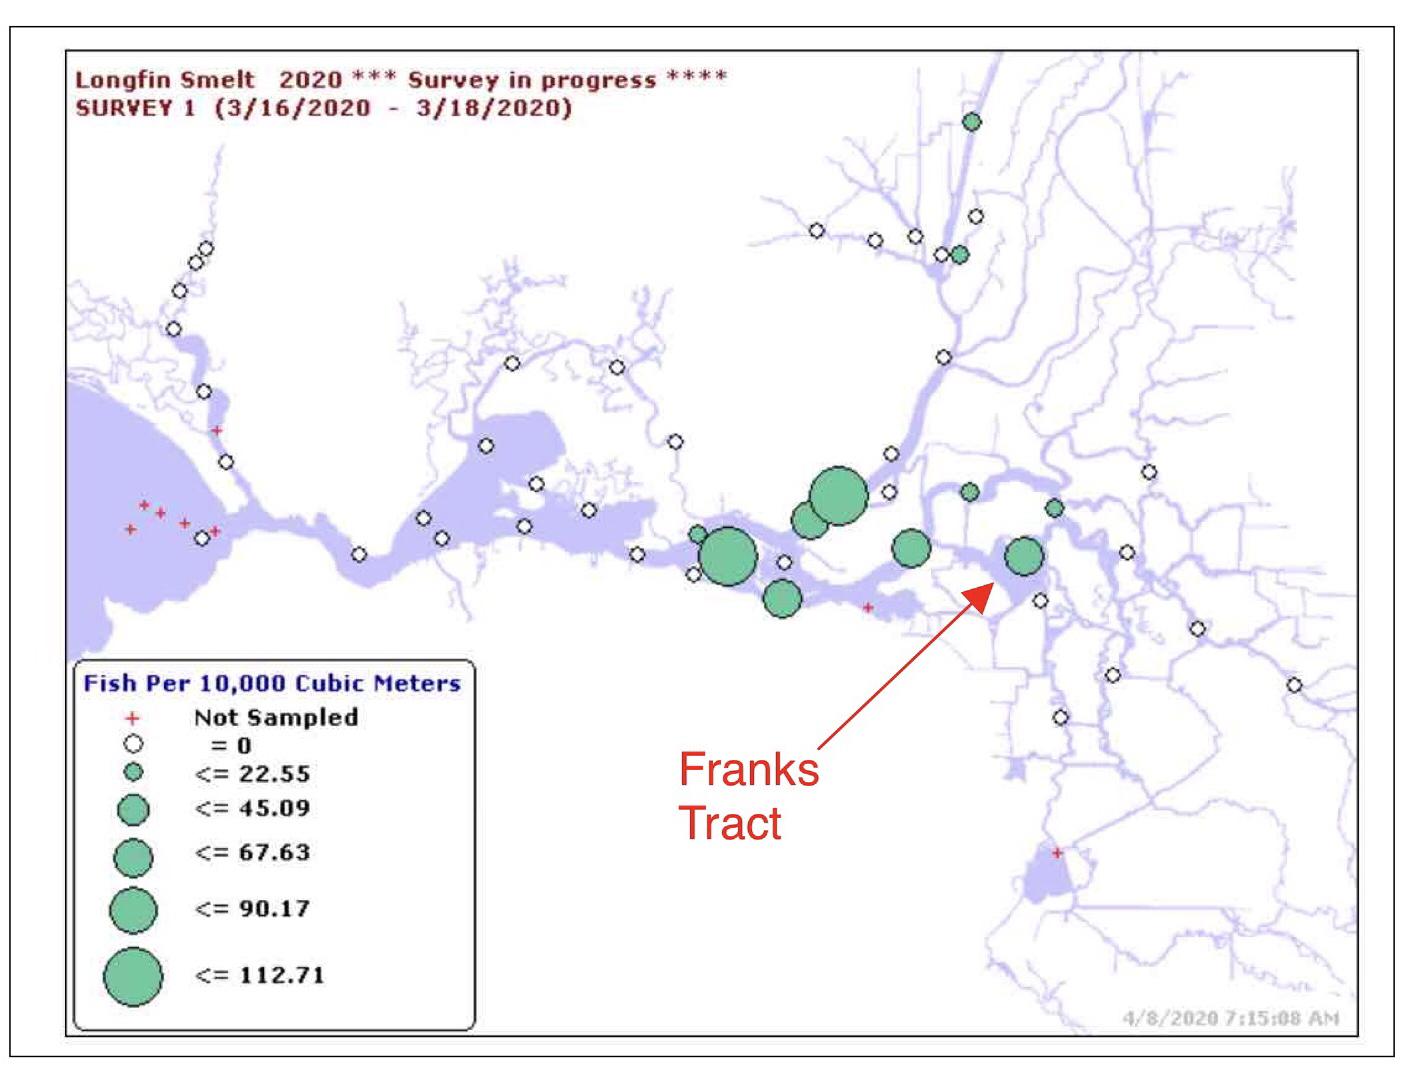
Figure 2. Longfin smelt distribution in March 2020 20-mm Survey #1.
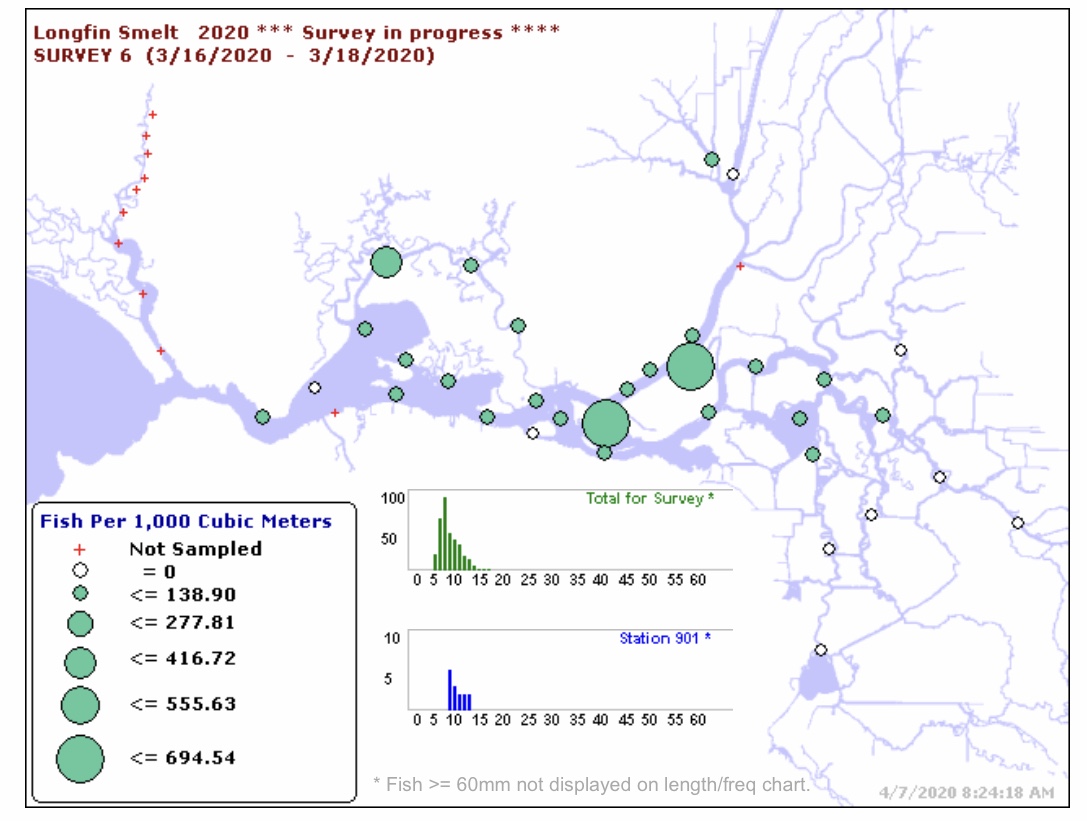
Figure 3. Longfin smelt distribution in March 2020 Larval Smelt Survey #6. Station 901 is in Franks Tract.
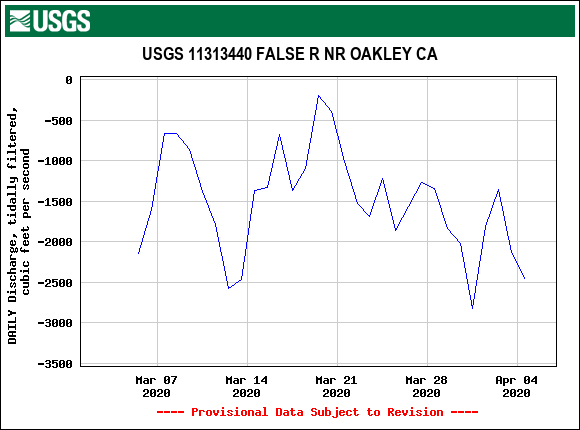
Figure 4. False River net daily tidally filtered flow (cfs) in March 2020.
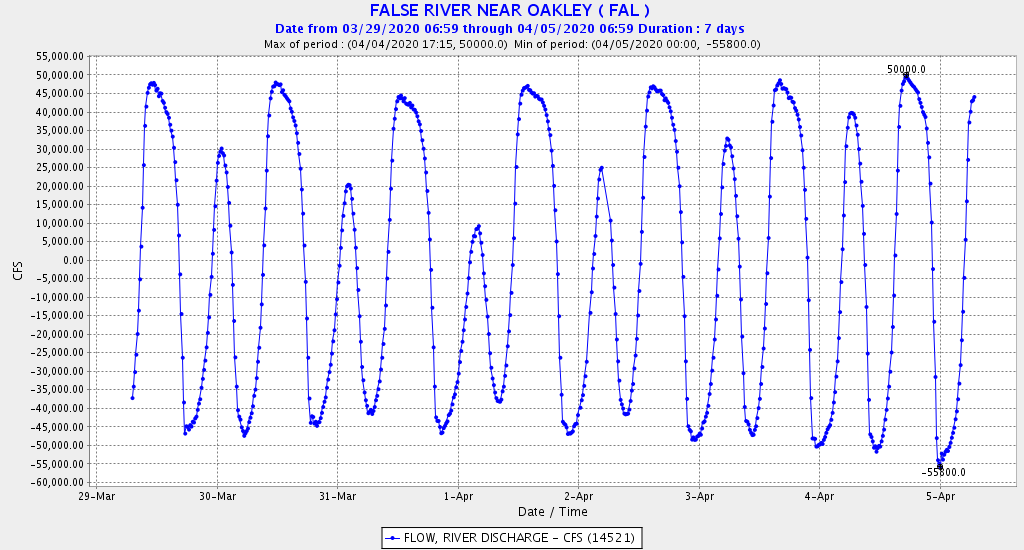
Figure 5. Hourly flow at False River gage March 29 to April 5, 2020.
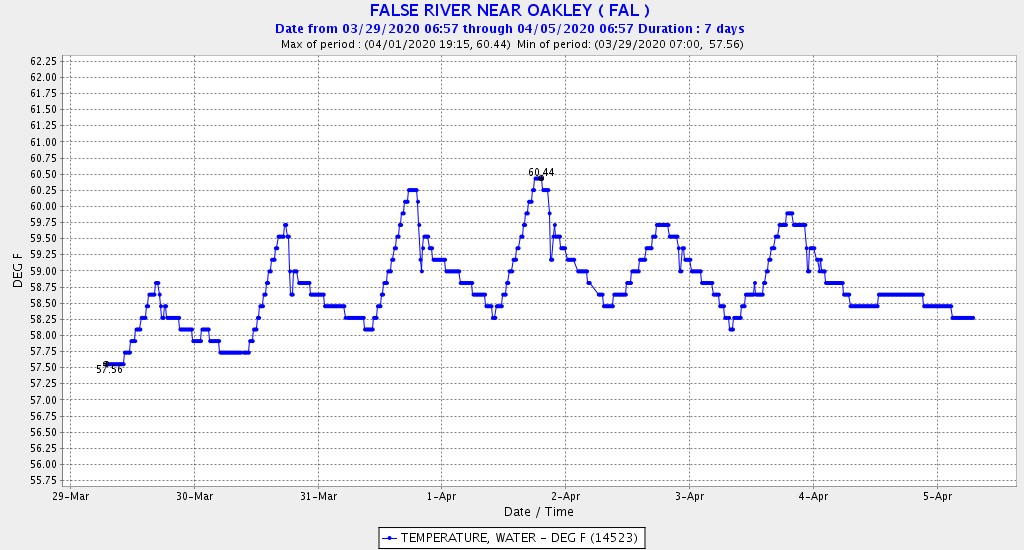
Figure 6. Hourly water temperature at False River gage March 29 to April 5, 2020.
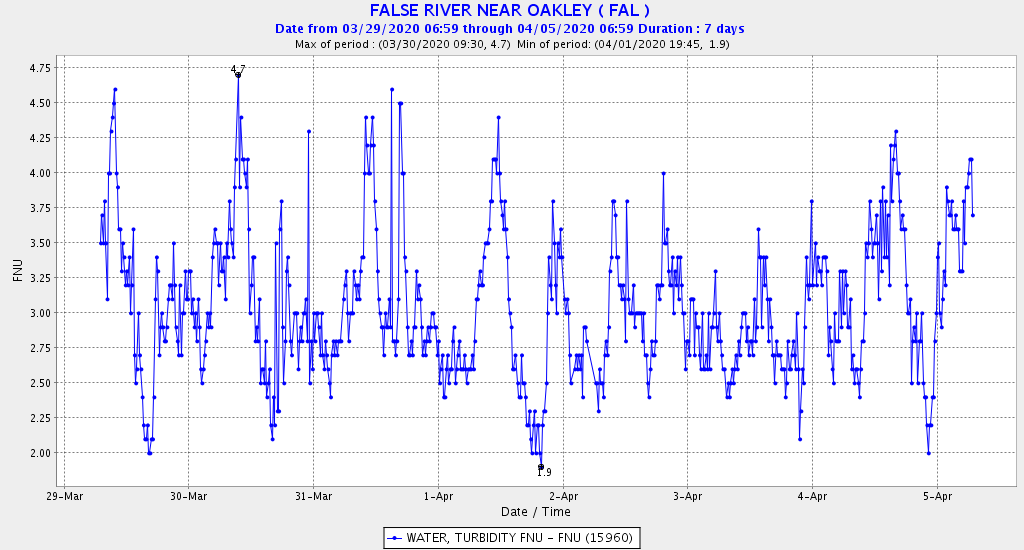
Figure 7. Hourly turbidity at False River gage March 29 to April 5, 2020.
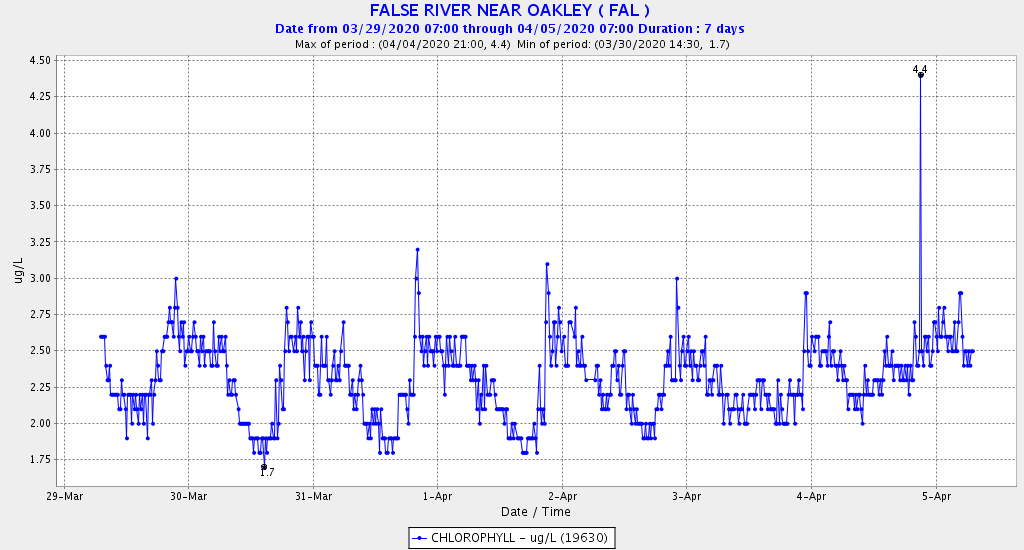
Figure 8. Hourly chloropyll at False River gage March 29 to April 5, 2020.
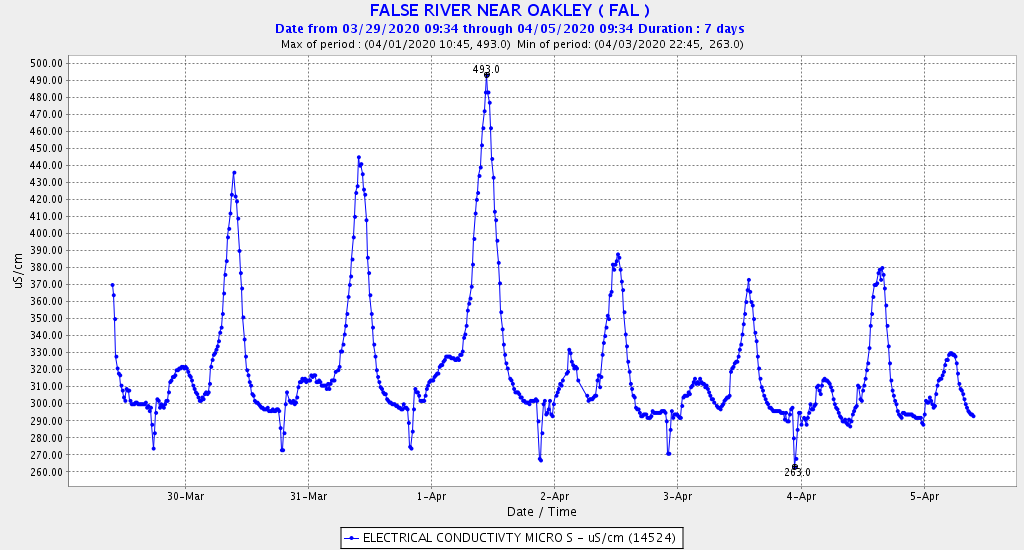
Figure 9. Hourly EC at False River gage March 29 to April 5, 2020. Note slightly brackish water (300-500 EC) moves upstream in False River on flood tides (Figure 5), but returns fresher on ebb tide from mixing in Franks Tract.