The National Marine Fisheries Service (NMFS), in an August 2023 Assessment, provided a status review of spring-run Chinook salmon in California’s Central Valley. The Assessment found that salmon are declining, but primarily as part of a short-term trend, under the burden of climate change.
The conclusions of the August Assessment stand in stark contrast to October’s condor-like effort to preserve remaining wild spring-run salmon in a conservation hatchery at UC Davis. This contrast demonstrates the limitations of the federal and state resource agencies’ focus on climate change and the ocean as the cause of the salmon declines and the reason to shut down fisheries.1 The resource agencies need to direct more attention to controllable elements: water operations. On that level, they must take immediate action, before another one of California’s most important public trust resources is lost.
Quotes from NMFS’ 2023 Update to the Viability Assessment for Spring-Run Chinook, and Comments
Populations in many ESUs declined in abundance compared to the previous review five years ago. In most cases, these declines appear to be caused by variation in survival rates in the ocean environment. In the coming decades, climate change, including negative effects in the ocean, is expected to be a major factor impacting Pacific salmon (Crozier et al. 2019). In the near term, however, we generally viewed the recent declines as mostly being short-term and not necessarily indicative of a major underlying change in ESU/DPS status. Several populations within each ESU/DPS were evaluated to have a declining trend in overall viability (i.e., increased extinction risk) since the last review. … No new information suggests that the delineation of the CVSRC ESU should change at this time. (p. 2) [emphasis added]
Comment: I generally disagree with NMFS’s conclusions, because these conclusions do not reflect the reality of effects of the 2013-2015 drought or the more recent 2021-2022 drought. NMFS predicted these effects in its 2016 review, particularly the effects on the freshwater river and estuary habitat conditions, and the roles played by state and federal water management. Thiamine Deficiency continues to be the theory driving NMFS’s focus on the ocean. However, NMFS has not addressed alternative theories that water management in freshwater exacerbates the effects of the lower thiamine that stems from ocean feeding on anchovies.
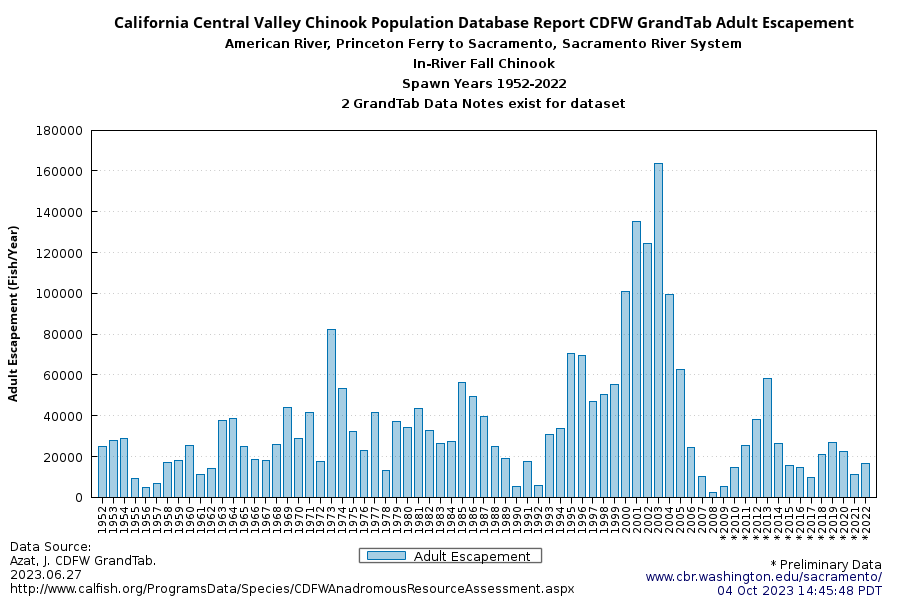
As to the statements that recent declines are “near-term” and that “no new” information warrants a change in the level of risk status for Central Valley spring-run, one must assume that NMFS regrets these conclusions in light of the catastrophic numbers of spring-run spawners in September and October of 2023.
Climate plays an important role in salmon (Oncorhynchus spp.) habitat at every stage of their lifecycle. For instance, predictable seasonal climate variations interact with the physiography of salmon watersheds to provide predictable seasonally varying water temperature and streamflow regimes that create diverse life-history pathways for different salmon populations of the same and different species. Likewise, irregular climate and weather variations like persistent drought, episodic floods, or persistent marine heatwaves, can impact salmon populations by altering their aquatic habitats and food-webs, which in turn affect individual salmon growth and survival rates in ways that can impact salmon populations at local to regional scales. Climate variations impacting regions across 100s to 1000s of kilometers can thus impact ESU/DPS viability through impacts on abundance, productivity, spatial diversity, and distribution. (p. 6)
Comment: Water management in the Central Valley can also be a major problem, if not the main problem. NMFS holds some of the responsibility for this water management, but continues to avoid it. Yes, droughts have been frequent, but the effects of droughts on salmon have gotten worse because of drought-year water management. NMFS’s role in 2013-2015 and in 2021-2022 was to quietly acquiesce to the California State Water Resources Control Board’s decisions to grant the requests of state and federal agencies to weaken flow and temperature requirements during drought conditions.
It is NMFS’s responsibility to oppose the federal agencies’ requests to weaken standards during droughts. Such requests are federal actions. NMFS continues to act as though it has no authority over the Bureau of Reclamation’s deliveries of water from Shasta and Trinity reservoir water to California’s water contractors. But these deliveries are most certainly federal actions that require NMFS’s review and approval under the Endangered Species Act (ESA).
The period of 2013–2021 has been exceptional for its high frequency and magnitude of West Coast drought and terrestrial heat, widespread and severe wildfire, and record-setting marine heatwaves in the California Current Large Marine Ecosystem and broader northeast Pacific Ocean. Climate extremes from 2013–2021 have contributed to extreme bottlenecks in West Coast salmon survival rates for multiple West Coast salmon populations and subsequent declines in abundance for many DPSs and ESUs. (p. 6)
Comment: While poor ocean conditions may have been a major part of the problem in 2008-2009, this was not the case in the 2013-2021 period, at least in terms of the Central Valley salmon. NMFS needs to look closer to home to address the causes and solutions to the Central Valley salmon collapse.