The last significant brood year reproduction of Delta Smelt occurred in 2011 (Figure 1a and 1b). The last significant brood years occurred from 2010-2012, and the population then collapsed during the 2013-2015 drought. The Delta is too warm in summer to allow a Delta Smelt recovery.
The demise of the Delta Smelt started in the late 1990s and accelerated from 2005-2006, above-normal and wet years that had unusually warm western Delta water temperatures in the prime Delta Smelt low-salinity-zone rearing habitat. The 2005-2026 decline of Delta Smelt and other pelagic Delta species was termed the Pelagic Organism Decline (POD).1 The POD was studied for two decades, with multiple factors considered, including warming of the Delta as it relates to increasing Delta water exports and the associated lower Delta outflow.
After two decades of new environmental data available for the Delta, it looks more and more like increased water temperature was the main culprit in the demise of Delta Smelt. One of the best sources of long-term water temperature data is the gage at Emmaton in the western Delta, near the confluence of the Sacramento River and San Joaquin River channels at the entrance to San Francisco Bay in east Suisun Bay (see map, Figure 14). Water temperatures in early summer in wetter years 2005-2006 were higher than average and into the 73-75oF lethal range for Delta Smelt (Figures 2 and 3). Similar warm temperatures were recorded at the Collinsville gage in east Suisun Bay in summer 2005 and 2006 (Figures 4 and 5). The western Delta and eastern Suisun Bay are the prime early-summer low-salinity-zone habitat of Delta Smelt.
The warmer summer trend in the western Delta continued after 2010-2012, the last Delta Smelt recovery years (Figures 6-9). Water temperatures were also high in summer in west Suisun Bay in many recent years (Figure 10).
Causes
Generally, the blame goes to Climate Change (i.e., Global Warming, El Niños, etc.) that cause droughts and warmer air temperatures. It is difficult to put blame on any one factor, especially when the potential factors are highly variable, often not controllable, or not always measured.
However, for Delta Smelt that usually live only one year, it is useful to look for causes in sudden drops in population indices or periods of declines (like droughts). I have analyzed many of these factors and trends, and I often come back to July (early summer) when juvenile Delta Smelt are usually settled into the low salinity zone in the western Delta and Suisun Bay. If that key habitat area gets too warm, then it only takes a few days to kill-off most of the population.
For this reason, I tend to focus on POD years 2005 and 2006 as a prime factor in the demise of Delta Smelt. As shown in Figure 3, July water temperatures reached lethal levels during the POD years; they had been at non-lethal levels in most years of the 1990s. A major change was that south Delta exports under Water Rights Decision 1641 (after 1999) were greater than occurred during the 1990s (Figure 11, Table 1). July exports were about 25% greater during the POD years, because D-1641 allowed higher exports (Figure 12). West Delta water temperatures were particularly high in the summer of water year 2005 (Figure 13). The combination of high early- summer (June-July) exports (Table 1) and high July water temperatures was a likely contributing factor to the post-2002 Delta Smelt summer and fall indices.
Table 1. June and July monthly-average exports in 2005. Pre-1995 exports limits are shown.
| Month | June | July |
| Export Rate CFS | 10,100 | 11,900 |
| Pre-1995 Max CFS | 6,000 | 9,000 |
After the 2010-2012 period in which the Delta Smelt population showed some recovery, the population collapsed to near zero. That decline was likely related to the persistent lethal water temperatures in summer in the western Delta and east Suisun Bay. There is ample evidence of warmer summers under the temporary urgency change petitions and orders in the two most recent multiyear droughts (2013-2015; 2020-2022).2
In summary, it is extremely difficult for the Delta Smelt population to recover in the Bay-Delta Estuary under current water management and environmental conditions, because water temperatures are too high in summer. Surely it remains possible to affect change with more progressive water management, but the capacity to affect change diminishes
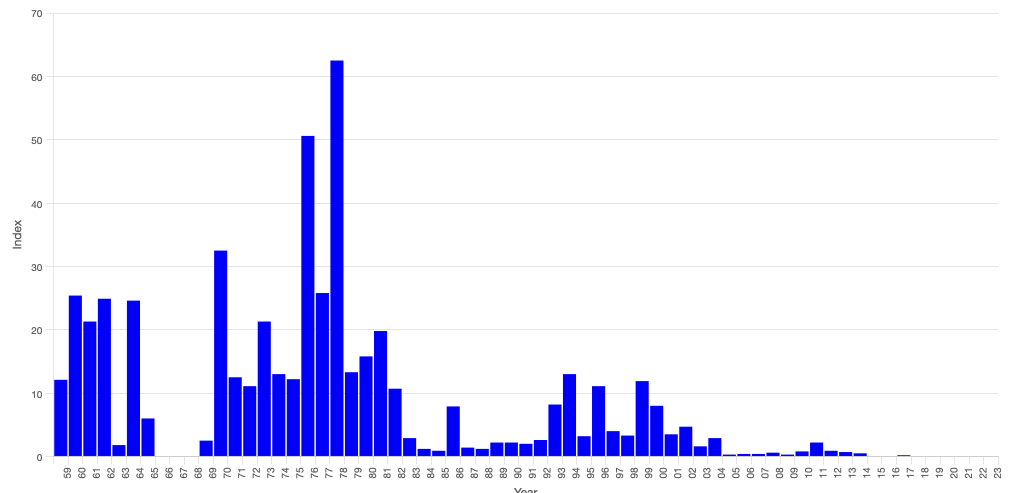
Figure 1a. Delta Smelt Summer Townet Survey Index 1959-2023. Source: CDFW
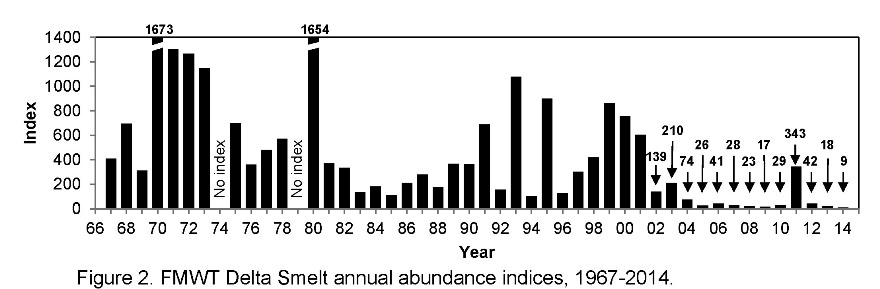
Figure 1b. Delta Smelt Fall Trawl Survey Index 1967-2014. Source: CDFW.
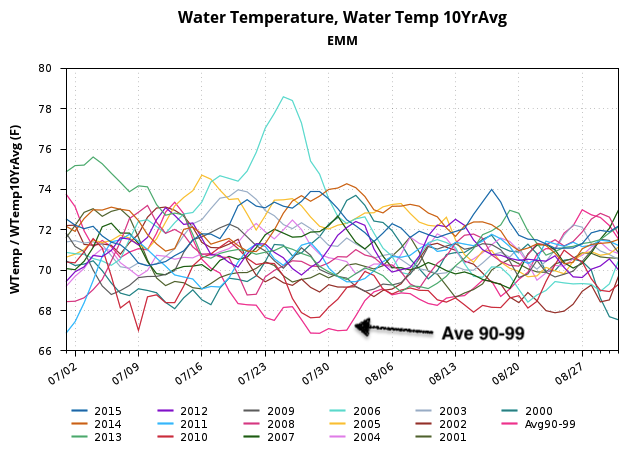
Figure 2. Summer water temperature at Emmaton gage near the confluence of the Bay and Delta from 2000 to 2015. See map (Figure 14) for gage location.
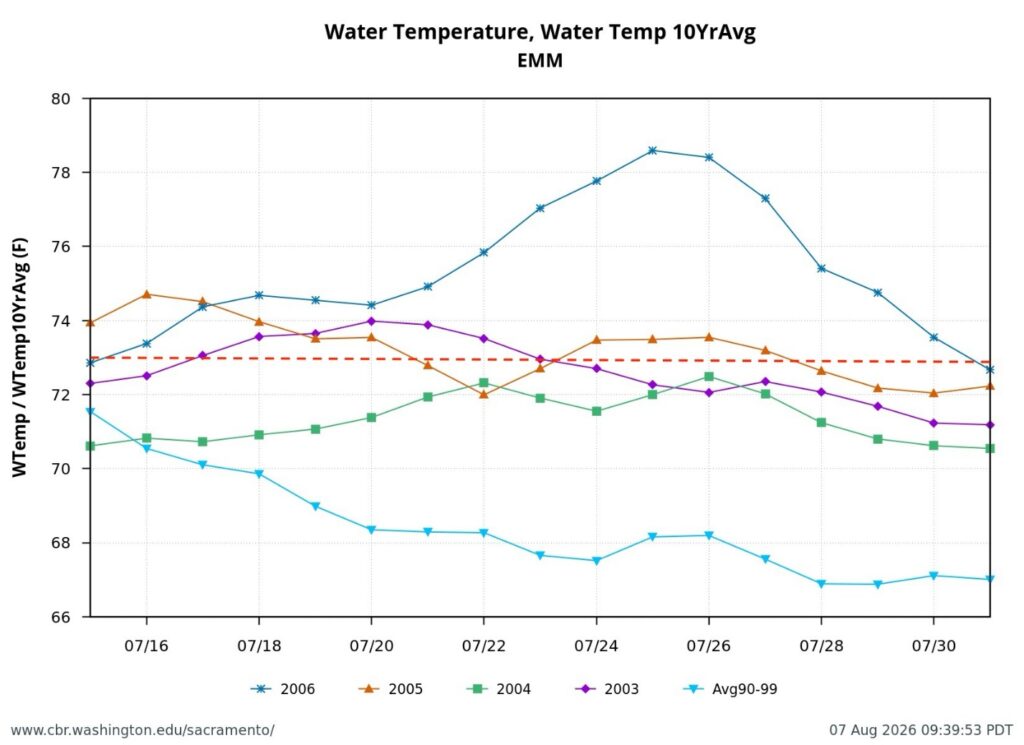
Figure 3. Average daily water temperature is shown for July of years 2003-2006 at Emmaton in the western Delta. Also shown is the average water temperature at Emmaton for the same dates for years 1990-1999. The red line is the level above which water temperature is considered highly stressful or lethal to Delta Smelt with long-term exposure.
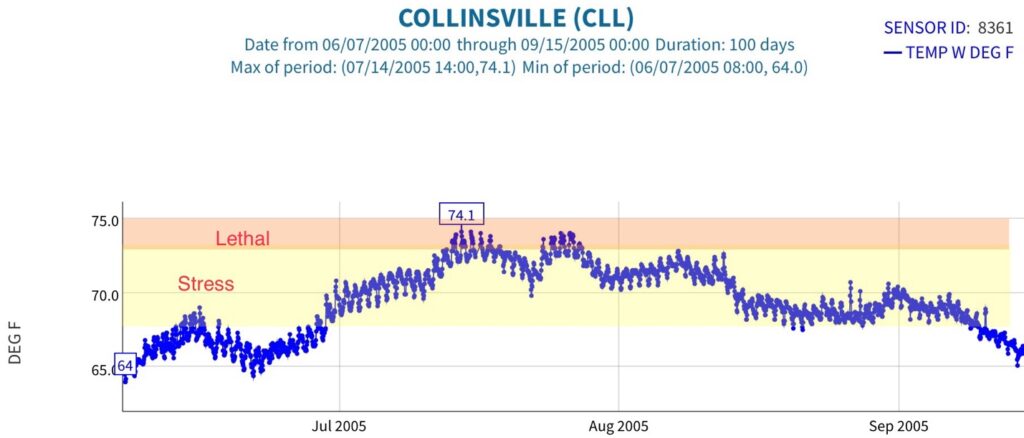
Figure 4. Water temperature (recorded hourly) at Collinsville gage in eastern Suisun Bay in 2005. Stress and lethal levels on Delta Smelt shown in colors.
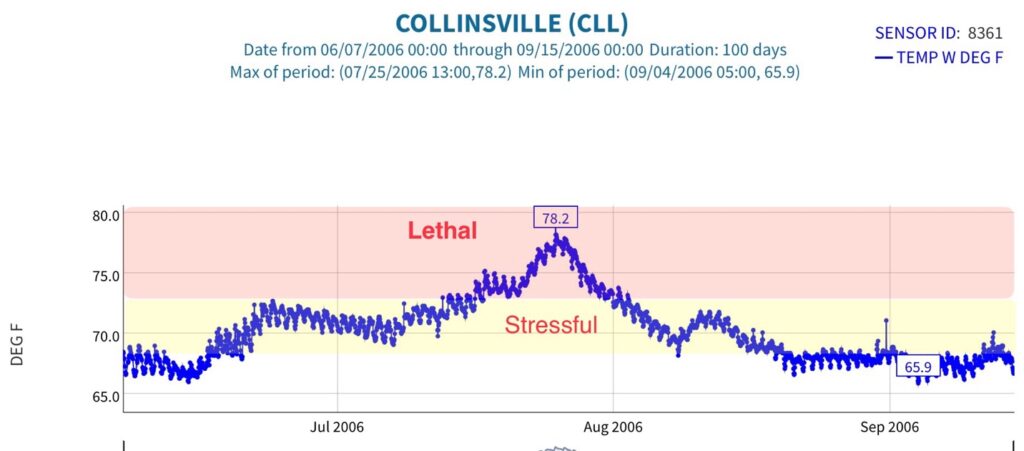
Figure 5. Water temperature (recorded hourly) at Collinsville gage in eastern Suisun Bay in 2006. Stress and lethal levels on Delta Smelt shown in colors.
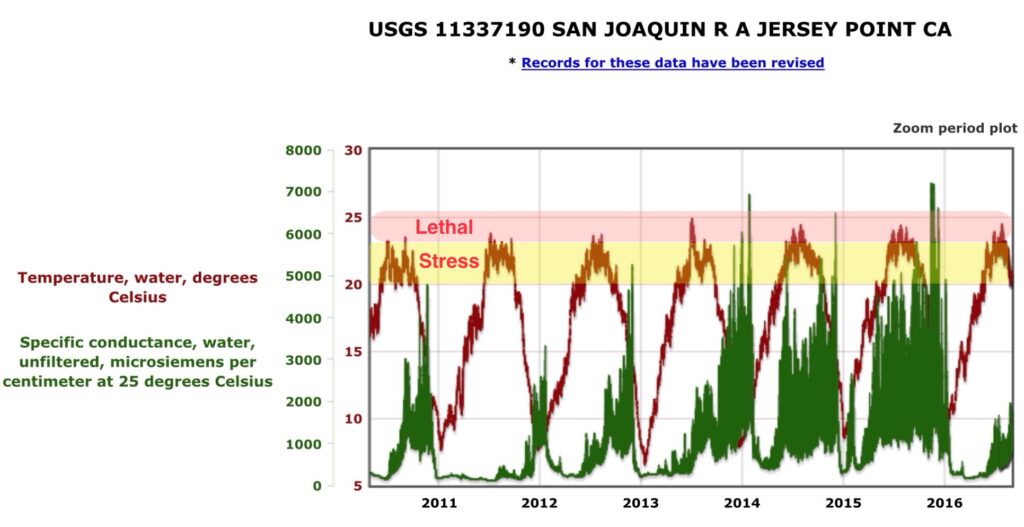
Figure 6. Water temperature and salinity (recorded hourly) at the Jersey Point gage in the west Delta channel of the San Joaquin River 2010-2016. Stress and lethal water temperature levels on Delta Smelt shown in colors. Note the higher summer water temperatures in drought years 2013-2015 and below-normal year 2016, as compared to the 2010-2012 recovery period.
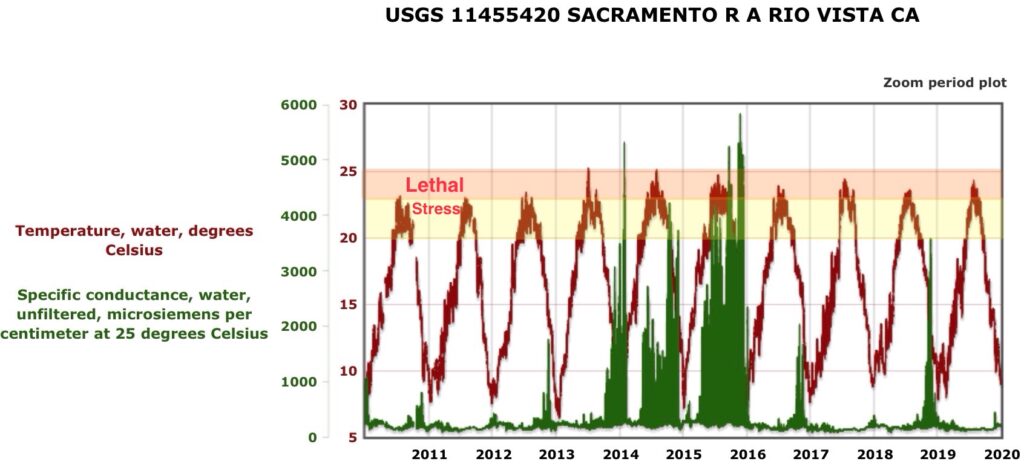
Figure 7. Water temperature and salinity (recorded hourly) at the Rio Vista Bridge gage in the west Delta channel of the Sacramento River from 2010-2019. Stress and lethal water temperature levels on Delta Smelt are shown in colors. Note the higher summer water temperatures in drought years 2013-2015 and below-normal years 2016 and 2018, and wet years 2017 and 2019 than in the 2010-2012 recovery period.
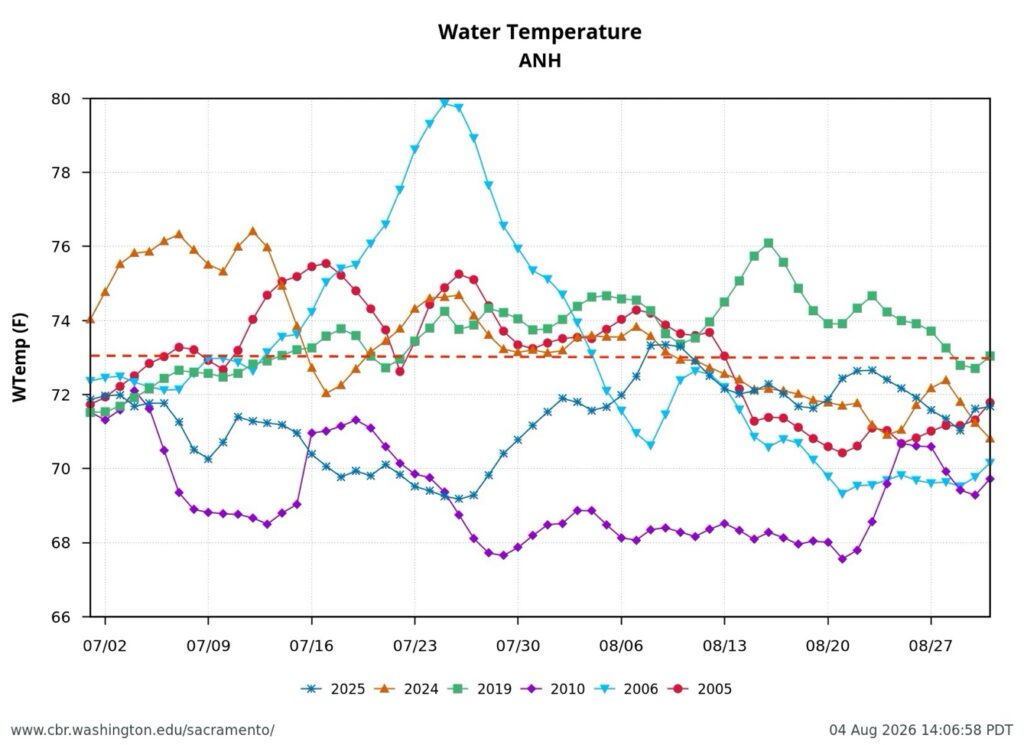
Figure 8. July water temperatures at Antioch gage in western Delta San Joaquin River channel in six normal and wet years including 2010. Note red dotted line of 73ºF above which water temperature is known to be lethal to Delta Smelt in long-term exposure. Note lower water temperatures in 2010, a Delta Smelt recovery year.
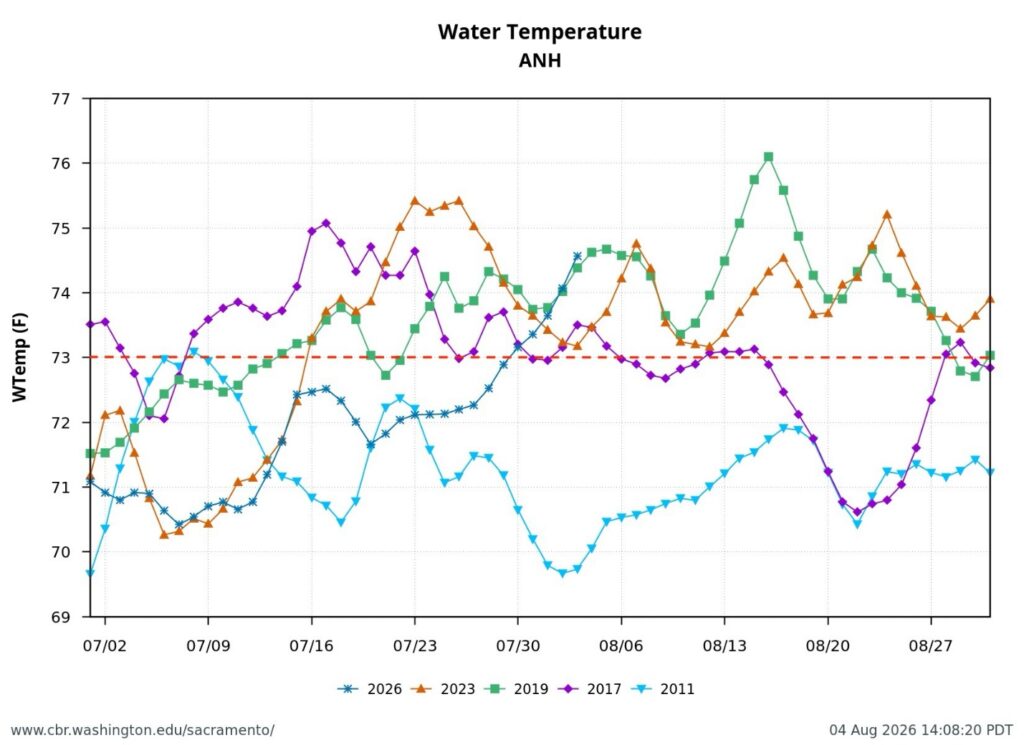
Figure 9. July water temperatures at Antioch gage in western Delta San Joaquin River channel in five normal and wet years including 2011, a Delta Smelt recovery year. Note red dotted line of 73ºF above which water temperature is known to be lethal to Delta Smelt.
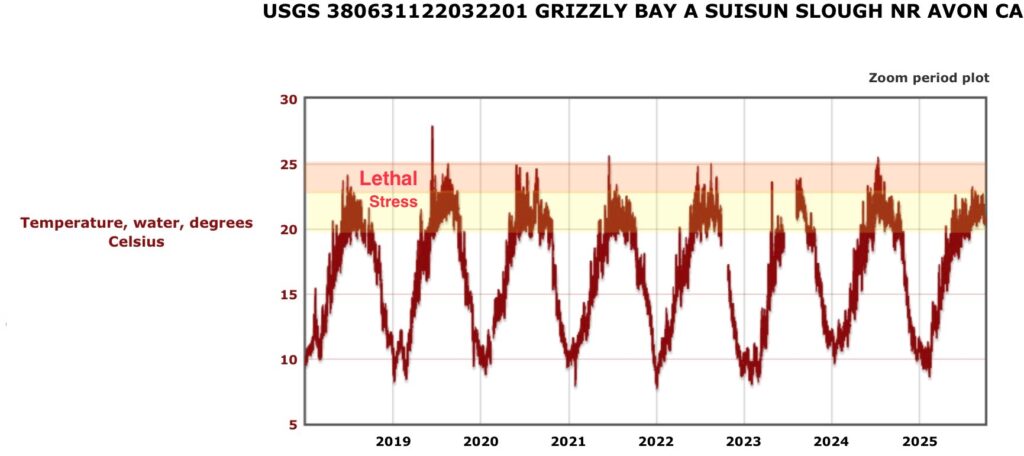
Figure 10. Water temperature (recorded hourly) at the Grizzly Bay gage in the west Suisun Bay 2018-2025. Stress and lethal water temperature levels on Delta Smelt shown in colors. Note the high summer water temperatures in these years except for wet year 2023 and above-normal year 2025.
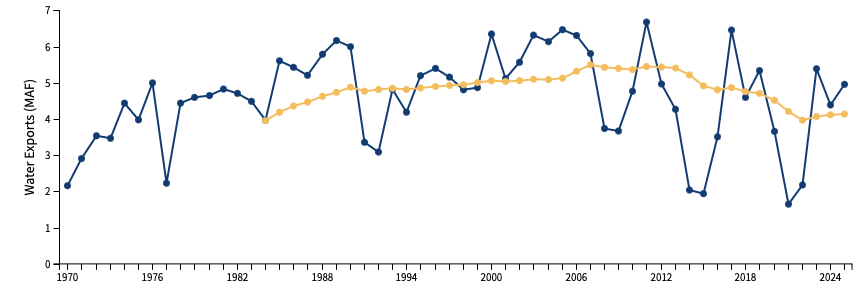
Figure 11. Annual south Delta exports and running average trend line for years 1970-2025.
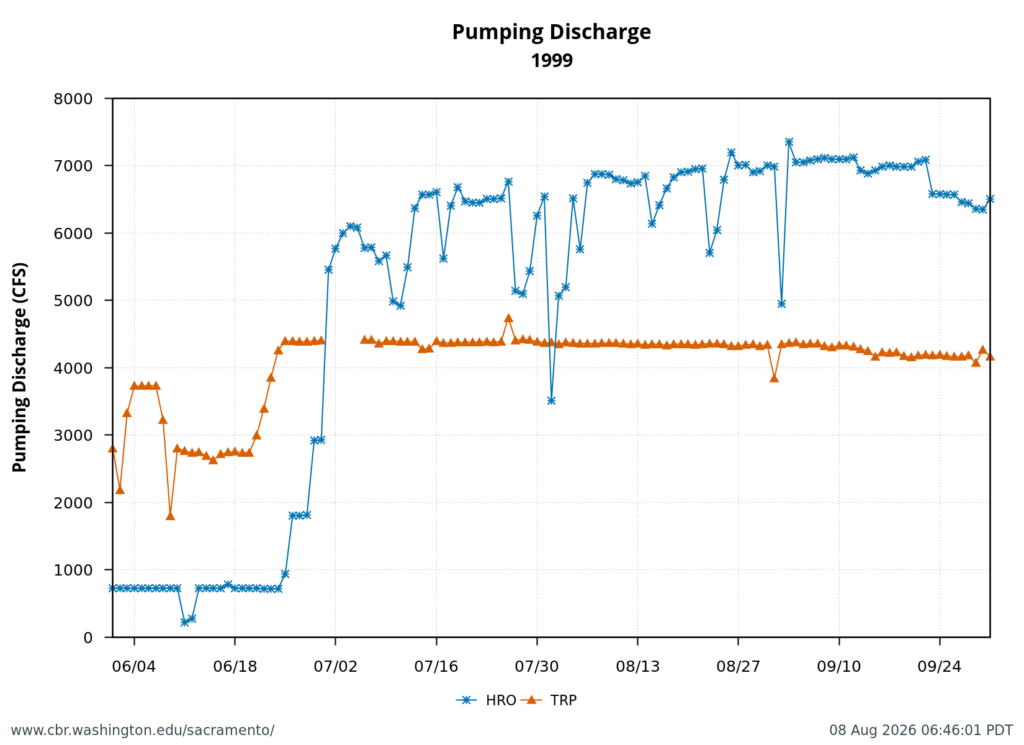
Figure 12. Maximum exports allowed under D-1641 (11,400 cfs) occurred in July 1999. The state Banks Plant (HRO) maximum rate is approximately 7000 cfs. The federal Tracy Plant (TRP) maximum rate is about 4400 cfs. Prior to 1995 the maximum south-Delta export rate was 9000 cfs under D-1485.
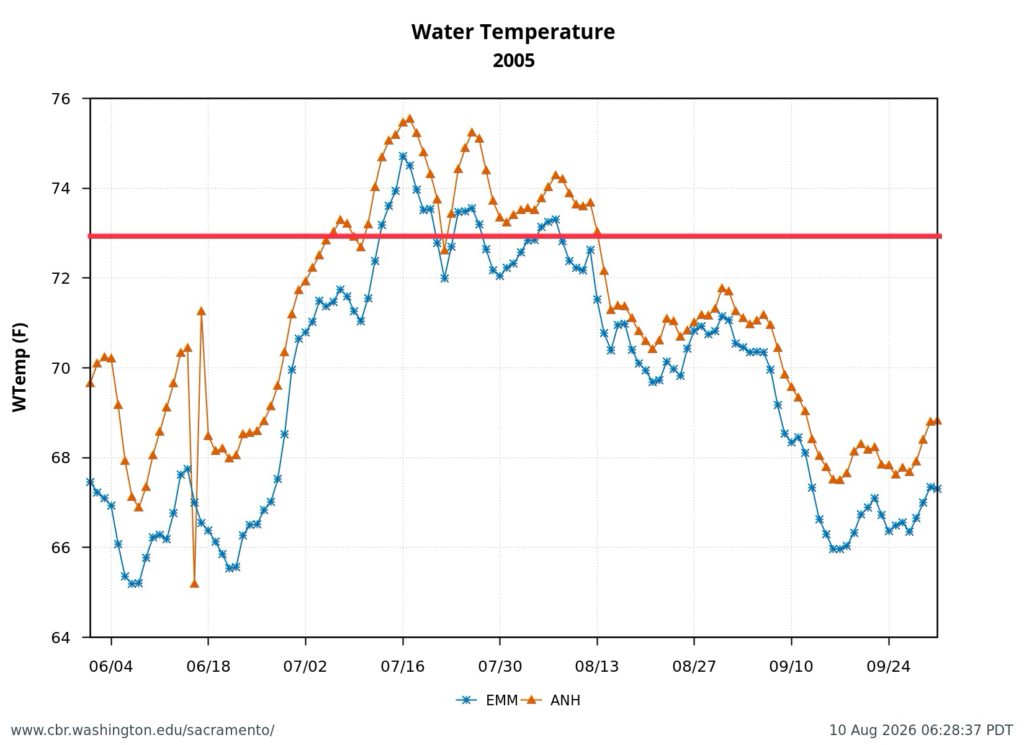
Figure 13. Summer water temperatures at Antioch and Emmaton gages in western Delta in above-normal water year 2005. Note red line at 73F above which is known to be lethal to Delta Smelt.
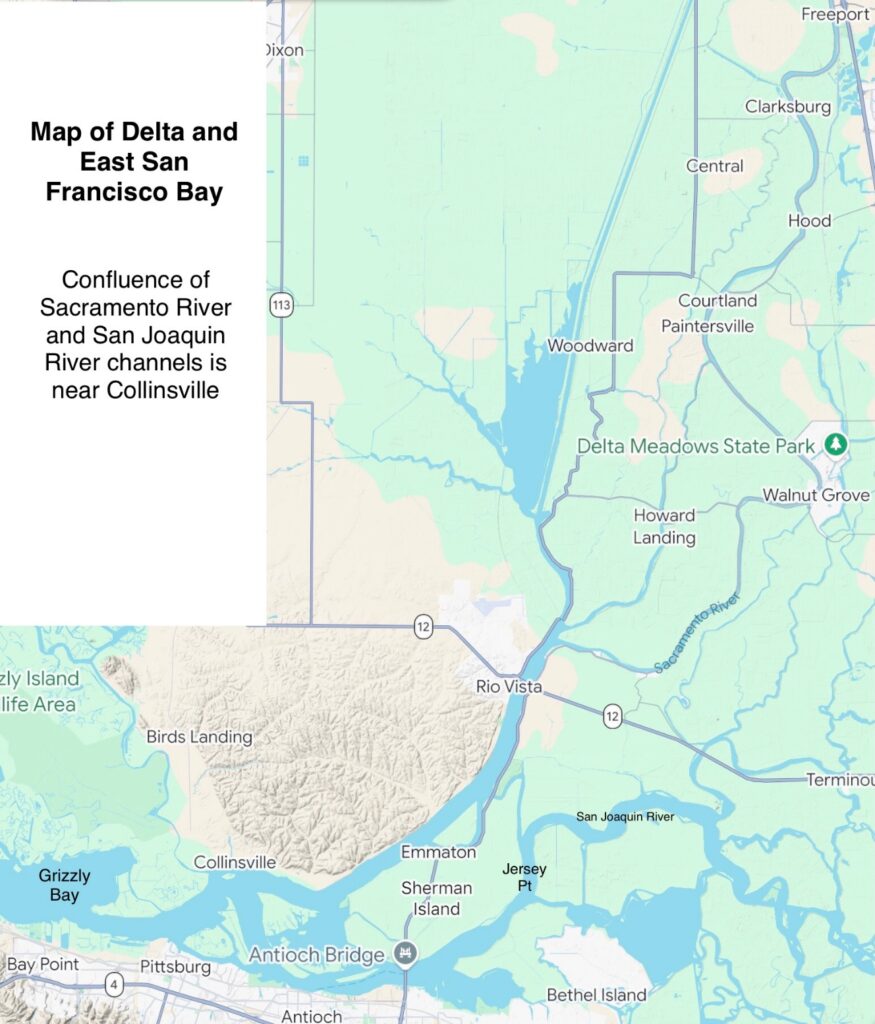
Figure 14. Map of the northern Delta and eastern San Francisco Bay (Suisun Bay)