A SacBee article on October 22, 20151 describes the nearly completed Knights Landing Outfall Gates (KLOG or Outfall Gates) screening project on the Sacramento River: “local, state and federal officials are close to completing a $2.5 million project that will block an entrance wayward salmon use to get into the Colusa Basin Drain”. The operative word here is “an”, because the other entrance, and by far the more important, is the Knights Landing Ridge Cut (KLRC or Ridge Cut) outlet into the upper Yolo Bypass (Map 1).
Upstream-migrating Winter Run Chinook Salmon bound for spawning grounds below Shasta Dam near Redding in the Sacramento River can be attracted into irrigation and stormwater drainage system outfalls and eventually lost. The two largest outfalls are the Yolo and Sutter bypasses (see my previous blog on the bypass attraction – http://calsport.org/fisheriesblog/?p=421 ). Of lesser importance are a series of agricultural outfalls from low-lying basins adjacent to the Sacramento River. Chief among these are the Knights Landing Outfall Gates, which drain the Colusa Basin on the west side of the Sacramento River Valley.
The new screens on Outfall Gates will ensure that no salmon leave the river for the basin through the gates. But that is not the big problem. The Colusa Basin Drain (CBD or Drain) is also a stormwater drain that can flow mightily in winter storms even in drought years such as 2013-2015 (Charts 1 and 2). When stormwater-driven high flows in the Drain occur, the Outfall Gates’ outlet is usually closed because the river is higher than the gates during storm runoff. Under these high flows, water in the Drain is forced down the Knights Landing Ridge Cut into the upper Yolo Bypass (see Map 1).
Storm runoff that passes through the Ridge Cut into the Yolo Bypass attracts many salmon, steelhead, and sturgeon into the Drain and to their eventual demise in the dead-end Colusa Basin. Storm flow to the Yolo Bypass reaches 4000-6000 cfs in drought years, while non-storm flows through the Outfall Gates are usually only several hundred cfs (Charts 1 and 2). Flows leaving the Yolo Bypass and entering the Delta at Cache Slough (Map 2) attract many salmon, steelhead, and sturgeon moving through the Delta. During floods, the Sacramento River spills into the Yolo Bypass, adding even more attraction flows through Cache Slough. With limited passage options past the Fremont Weir at the upper end of the Yolo Bypass (Map 1 or 2), many of fish moving up the Yolo Bypass are attracted to and migrate up the Ridge Cut.
In short, the Knights Landing Ridge Cut outlet also needs to be blocked to keep fish from migrating into the Colusa Basin and being lost. The threat is serious not only to Winter Run Chinook, but also to Fall Run, Late Fall Run and Spring Run Chinook, as well as Steelhead, Green Sturgeon and White Sturgeon. Fish passage facilities at Fremont Weir are also needed so that adult fish that migrate up the Yolo Bypass are not stranded in the Bypass.
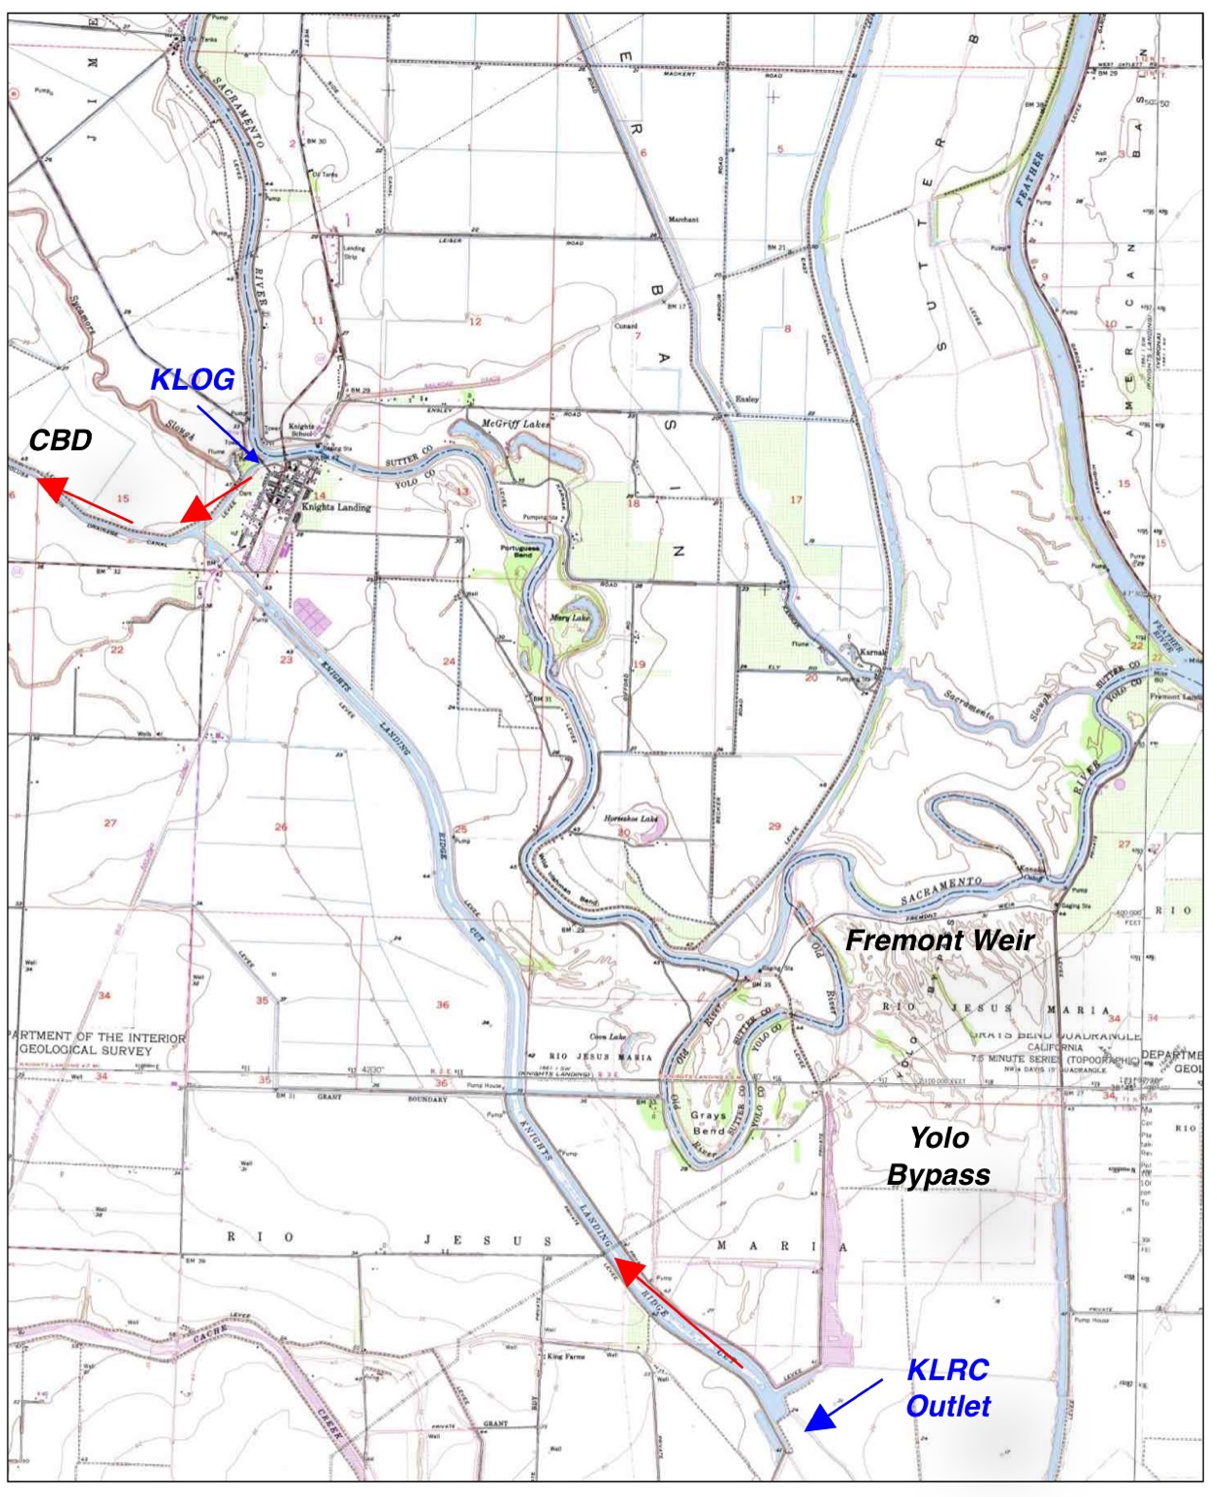
Map 1. Location of Knights Landing Outfall Gates (KLOG) on Sacramento River and Knights Landing Ridge Cut (KLRC) outlet in the Yolo Bypass near Knights Landing, CA. Red arrows point out routes taken by salmon into the Colusa Basin.
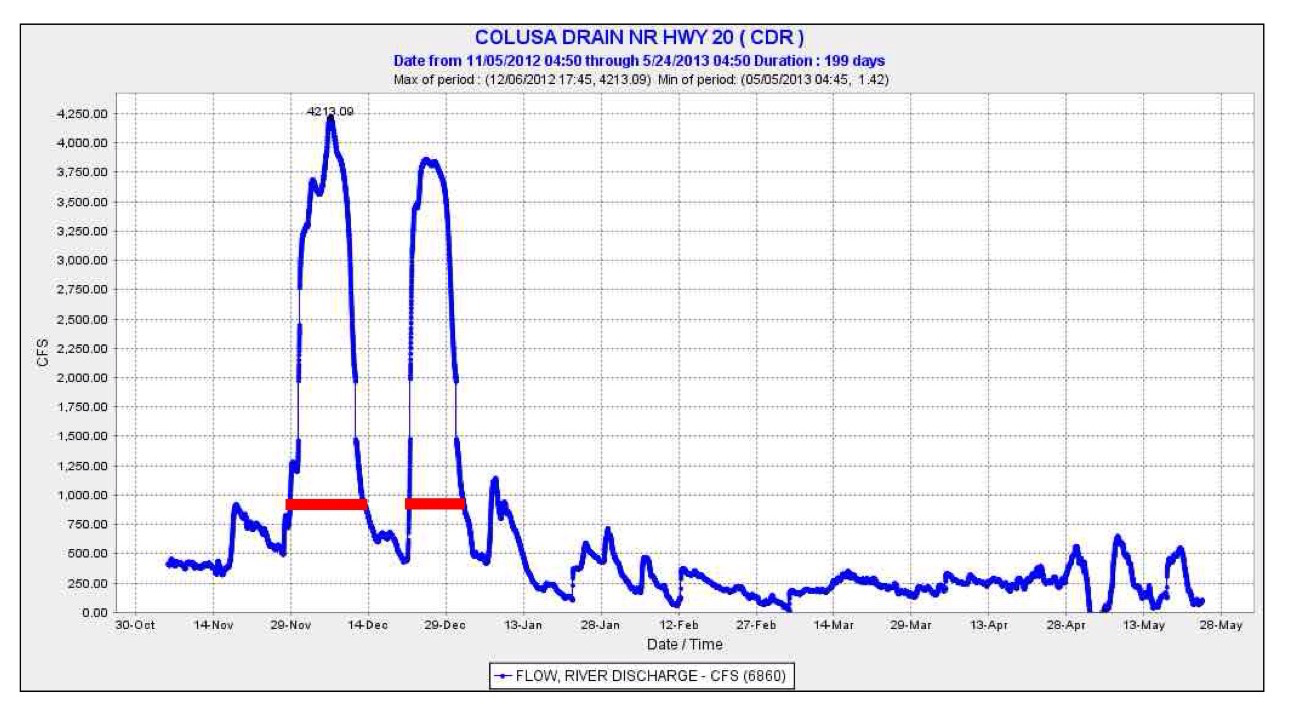
Chart 1. Flow in the Colusa Basin Drain Nov 2013 through May 2014. Red line depicts flow when KLOG were closed due to high Sacramento River stage. (At flows above about 900 cfs in the CBD the KLOG were closed and flow diverted to Yolo Bypass via KLRC.)
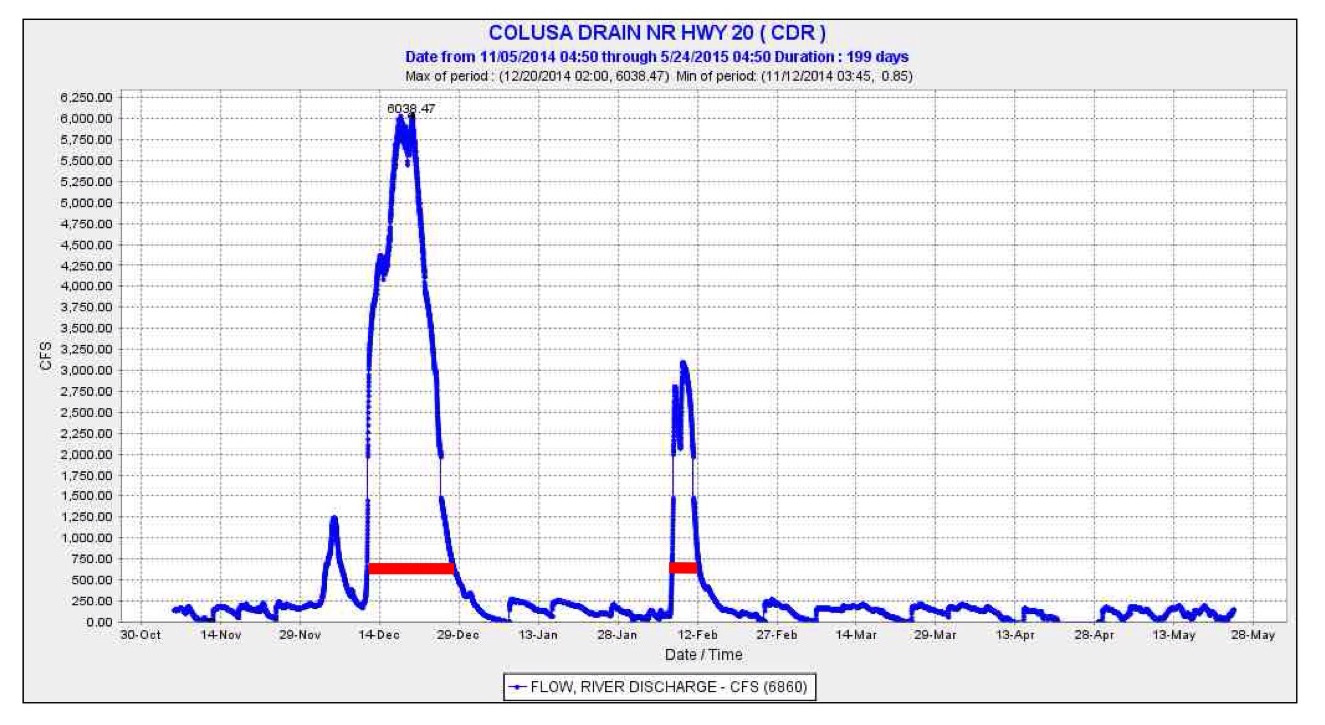
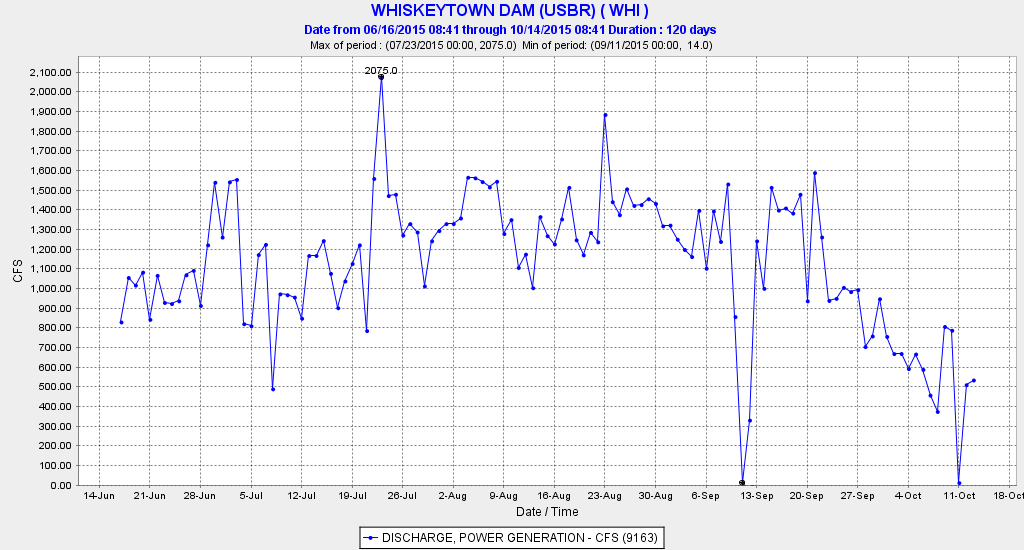
Chart 2. Flow in the Colusa Basin Drain Nov 2014 through May 2015. Red line depicts flow when KLOG were closed due to high Sacramento River stage.
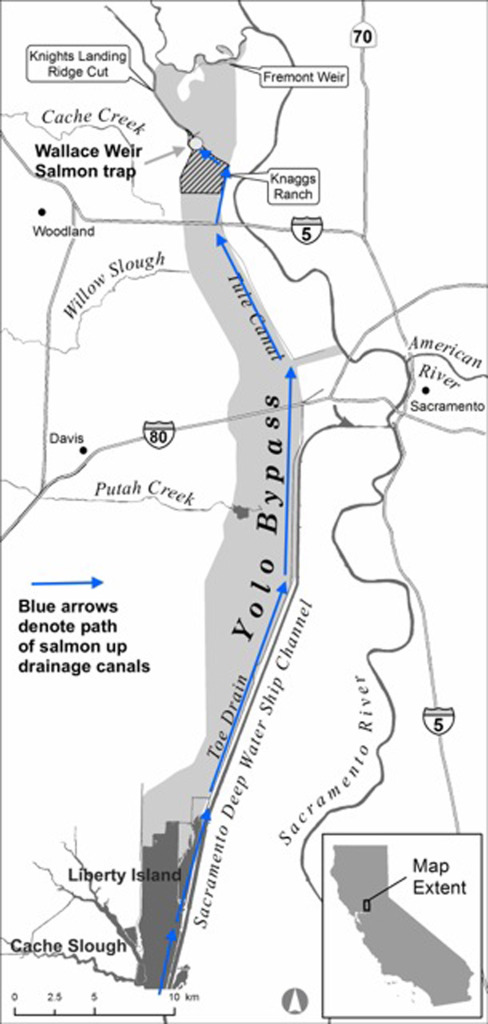
Map 2. Route salmon take from the Delta via Cache Slough up the Yolo Bypass when attraction flows are input from either the Knights Landing Ridge Cut or the Fremont Weir.