It is that time of year again for another Sacramento River Temperature Management Plan. You know, the plan adopted to protect Sacramento River salmon from the operation of the Shasta/Trinity Division of the federal Central Valley Project of US Department of Interior, Bureau of Reclamation (Reclamation). Past plans have failed to protect salmon since they became a requirement in 1990 in the State Water Board’s Water Rights Order 90-05.
The plans have failed even in wet years, including this wet year (four wet years have occurred since 2010). This year, Shasta Reservoir is full, and there is more than ample cold water to deliver to the salmon below Shasta Dam (a “Tier 1” wet year). Oroville and Folsom reservoirs are also full this year and ready to help Shasta supply the needs of salmon in the Sacramento River and Bay-Delta.
In this year’s 2023-sacramento-river-temperature-management-plan, Reclamation has committed to providing 53.5oF water in the upper ten river miles (RM) of the Sacramento River downstream of Keswick Dam (RMs 290-300). 53.5ºF is the upper optimal threshold water temperature for adult salmon spawning, egg incubation, and fry emergence. Reclamation has not always met this temperature in past wet years (Figure 1).
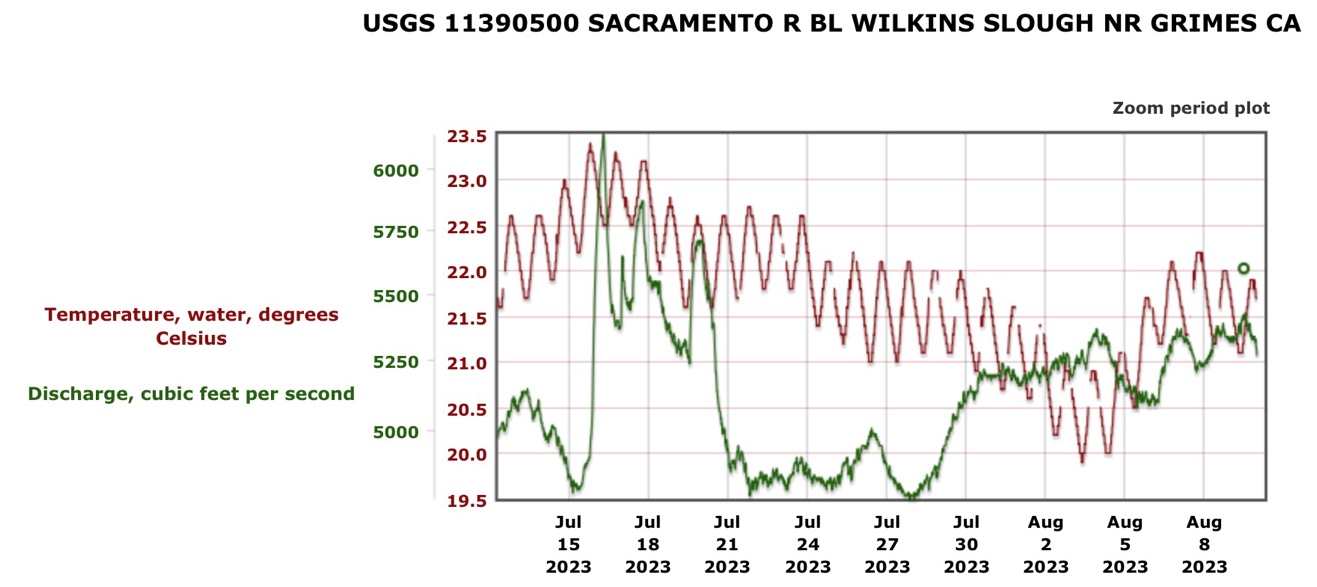
Other important benchmarks are maintaining lower Sacramento River water temperatures at and upstream of Red Bluff (RM 240) at <56oF and at <68oF downstream of Red Bluff (RMs 100-240). Reclamation has exceeded these temperatures in the three most recent wet years (Figure 2). Reclamation has not met summer water temperatures in the lower Sacramento River below 56oF at Red Bluff (RM 240) and below 68oF at Wilkins Slough (RM 120), because water diversions leave flows too low in summer (Figure 3). In fact, Reclamation has given up trying to meet those temperatures. The 2023 TMP evaluates maintaining 56oF at Balls Ferry, 36 miles upstream of Red Bluff, but concludes, without any supporting data or evidence, that maintaining that objective would be too uncertain and risky.
Analyses of flow and water temperature data for Wilkins Slough indicates it generally takes 6,000 to 10,000 cfs flow at Wilkins Slough to maintain water temperatures below 68oF in June, depending on air temperatures. Note the water temperature in early June 2023 reached above 68oF (Figure 2) as flows fell below 10,000 cfs (Figure 3).
Table 1 shows optimal temperatures for adult migration, holding, and spawning. Adult salmon migrating, holding, or spawning are stressed by water temperatures above 60oF. Water temperature above 68oF are considered “lethal” for migrating salmon – such temperatures occurred in June of three wet years (Figure 2). Stressful water temperatures occurred during the spring in the lower Sacramento River in all four wet years (Figure 3). Spawning and egg incubation water temperatures exceeded the target 53oF for spring-summer spawning winter run salmon in all four wet years (Figure 1).
The 2023 Sacramento River Temperature Management Plan
“Significant uncertainties exist within the forecast that will require intensive real-time operations management throughout the summer to achieve the various goals and targets throughout the system.” (2023 TMP, p. 3)
Comment: Reclamation’s repeated strategy of staying close to 56º in a limited stretch of the Sacramento River, even in a year like 2023 when there is really no reason to adopt such a conservative strategy, unnecessarily compromises the salmon and sets a course for failure to meet permit requirements. At the beginning of June, there were still endangered adult winter-run and spring-run salmon migrating up the lower Sacramento River.
As in 2023, Reclamation made overt decisions in 2017 and 2019 to drop flows below 7000 cfs in the lower reaches of the lower Sacramento River, knowing water temperatures would exceed their permitted upper limit and water quality standard of 68oF. Flows closer to Keswick Dam in Redding also dropped, allowing Red Bluff water temperatures to exceed their limit of 56oF.
“The strategy of meeting 53.5 at CCR will likely result in average daily temperatures at or near 56 degrees F at BSF. Reclamation does not propose to operate the TCD explicitly to meet 56 degrees F at BSF under conditions that may require changes to TCD operations that could risk cold water pool resources for use later in the temperature management season. This would cause an unreasonable risk to other goals and objectives”. (2023 TMP, p. 4)
Comment: The TMP acknowledges from the start that Reclamation has no intention of meeting the 56oF standard at Balls Ferry (RM 276), let alone Red Bluff (RM 240). With CCR maintained at 53oF, it takes more dam releases to keep the 60-mile upper river reach below 56oF and the 100+ miles of lower river below 68oF. The 2023 Plan thus plainly ignores these other license and water quality standard requirements important to salmon survival. Lower river water temperatures above 68oF through late summer will also compromise the fall-run salmon migration up the river.
Update
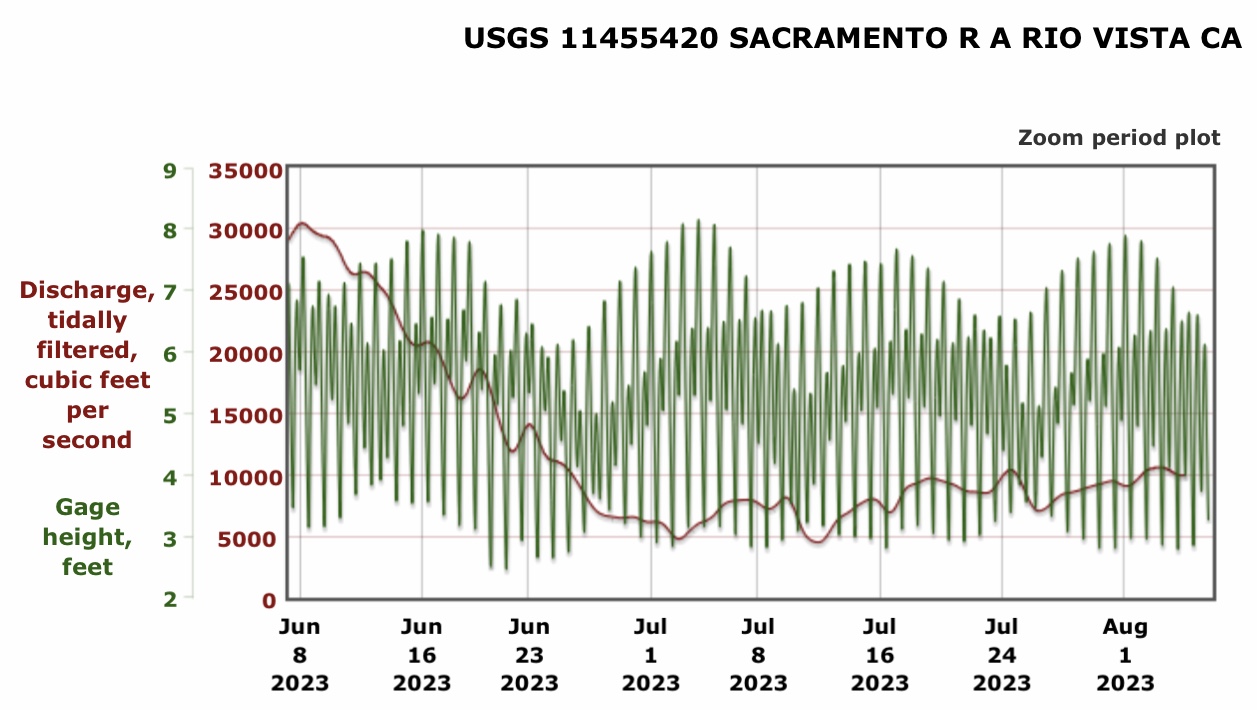
Water temperatures in the Sacramento River downstream of Red Bluff steadily increased through June (Figure 4). In over 100 miles of the Sacramento River from Red Bluff downstream to the mouth of the Feather River, Reclamation is operating in violation of federal/state water quality standards, the federal/state Endangered Species Acts, and state water rights permits. Water temperatures have reached lethal levels for migrating adult and juvenile salmon blocking their migrations up and down the river, respectively. Stress, disease, and predation are compromising two brood years of salmon production in a wet year! Water diversions from the river below Red Bluff are approaching 6000 cfs (Figure 5) not counting diversions upstream or from tributaries.
In Conclusion
In conclusion, the Sacramento River Temperature Management Plan should cover all of Reclamation’s obligations under its permits and all applicable water quality standards, not just water temperatures in the upper 10 river miles of over 200 river miles used by salmon.
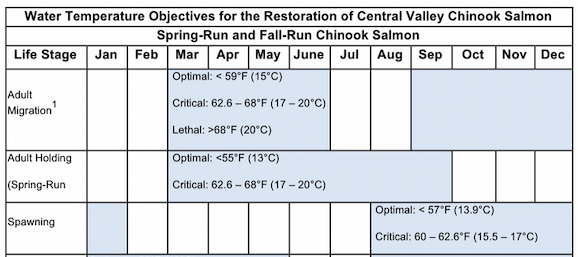
Table 1. Water temperature objectives for adult Central Valley salmon. (Sources: San Joaquin River Recovery Plan). Note that the temperatures cited in this figure are the maximum daily temperatures. The 2023 TMP target for winter-run Chinook spawning is an average daily temperature of 53.5ºF.
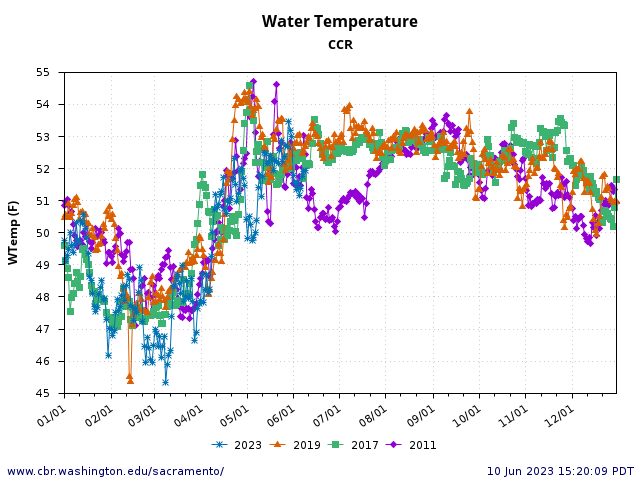
Figure 1, Water temperature (daily average) at the Clear Creek gage in the Sacramento River above the mouth of Clear Creek (RM 290) in wet years 2011, 2017, 2019, and 2023.
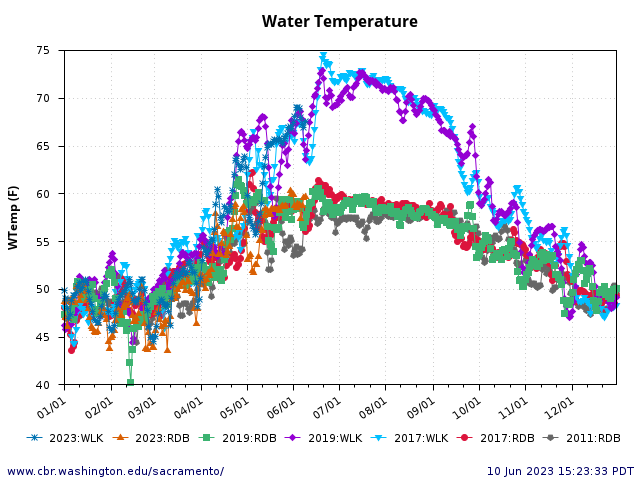
Figure 2. Water temperature (daily average) at the Red Bluff (RM 240) and Wilkins Slough (RM 120) gages in the Sacramento River in wet years 2011, 2017, 2019, and 2023.
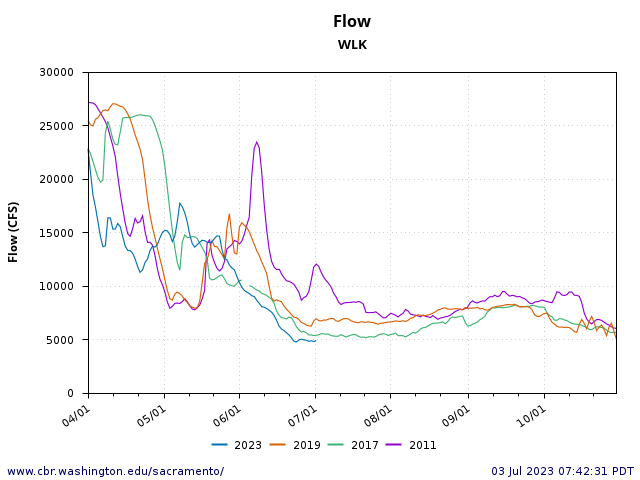
Figure 3. Lower Sacramento River flow at the Wilkins Slough gage (RM 120) in wet years 2011, 2017, 2019, and 2023.
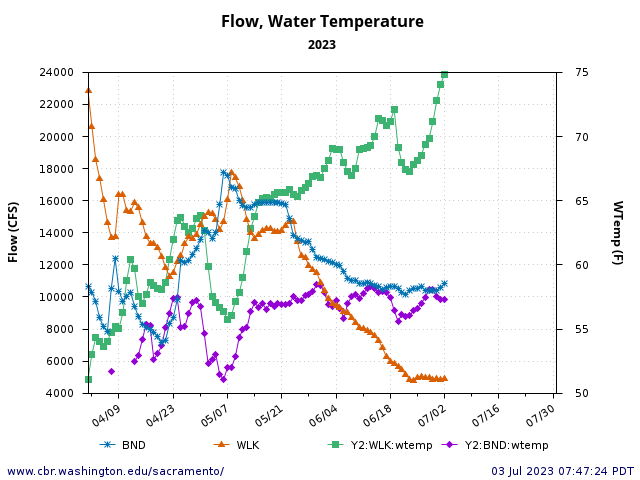
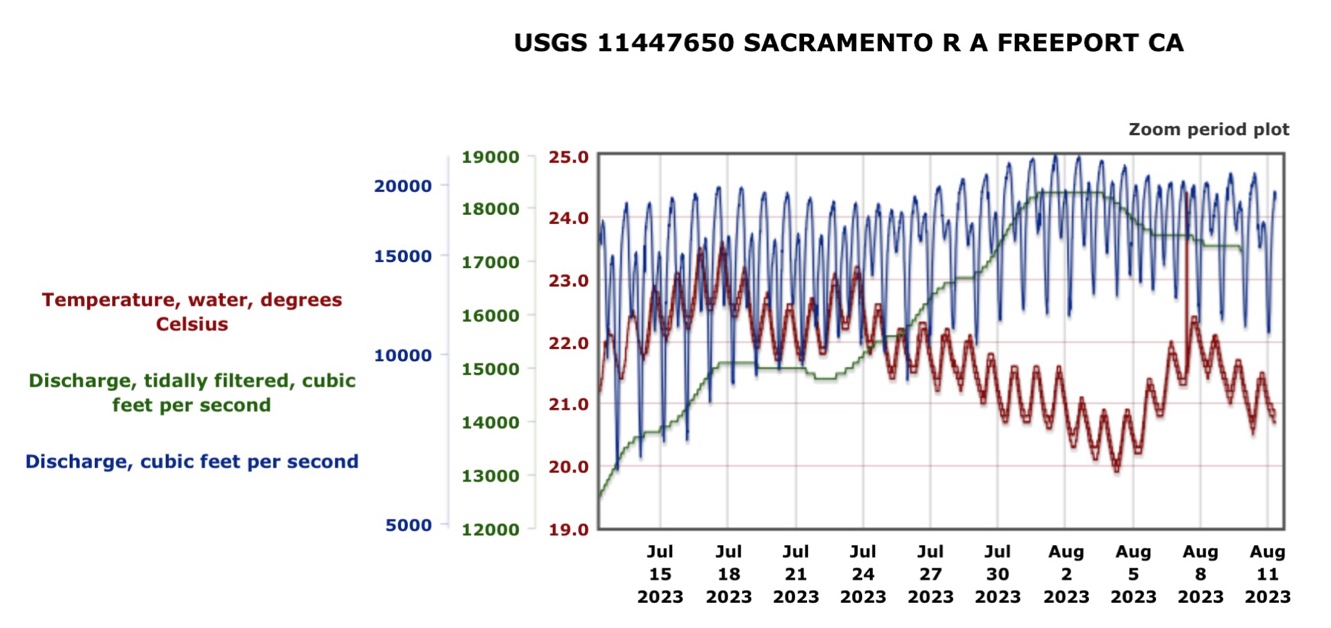
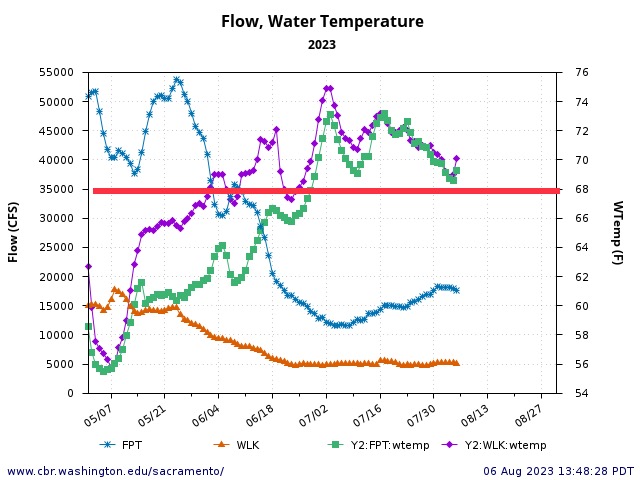
Figure 4. Water temperature and streamflow at Bend Bridge (RM 250) and Wilkins Slough (RM 120) in May-June 2023. Note 68oF water quality standard and critical water temperature for salmon is exceeded.in late June at Wilkins Slough gage. The 56oF standard was exceeded at Bend Bridge for much of May and June.
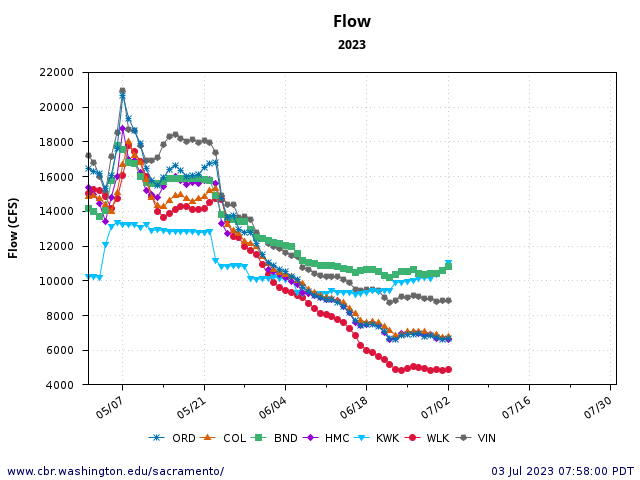
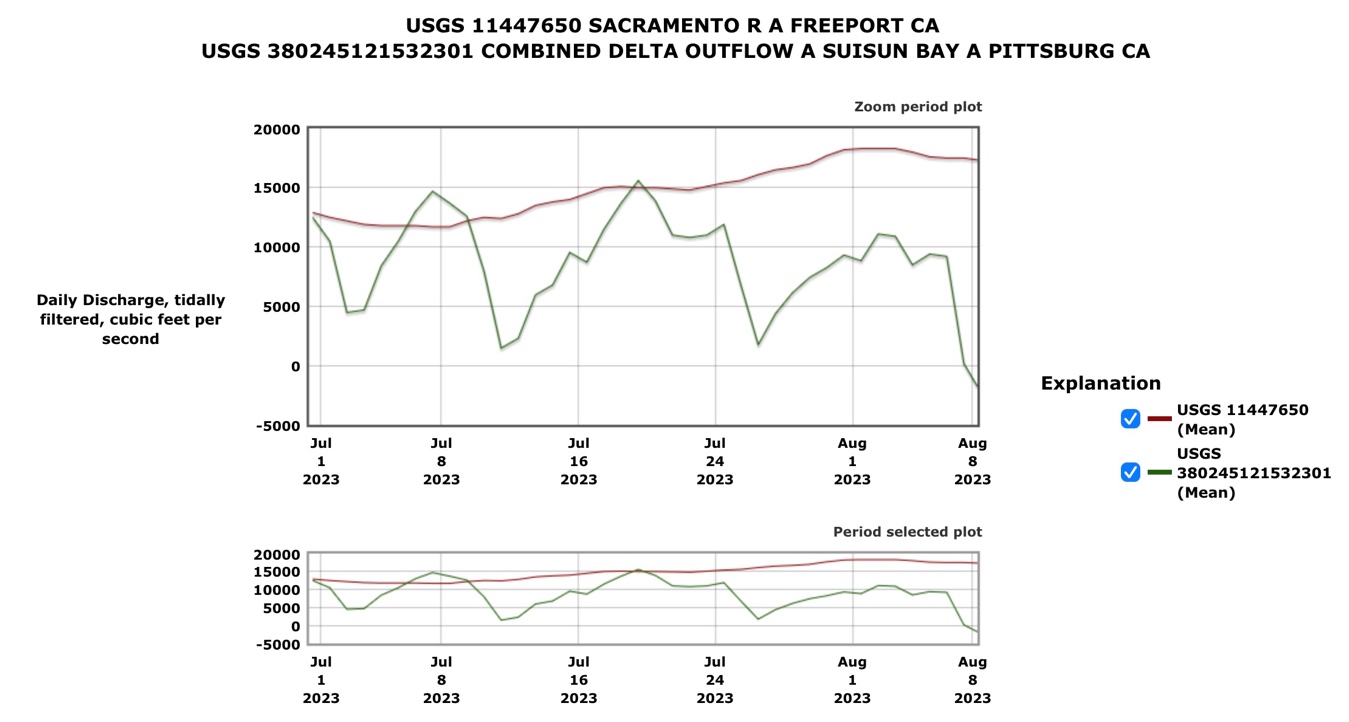
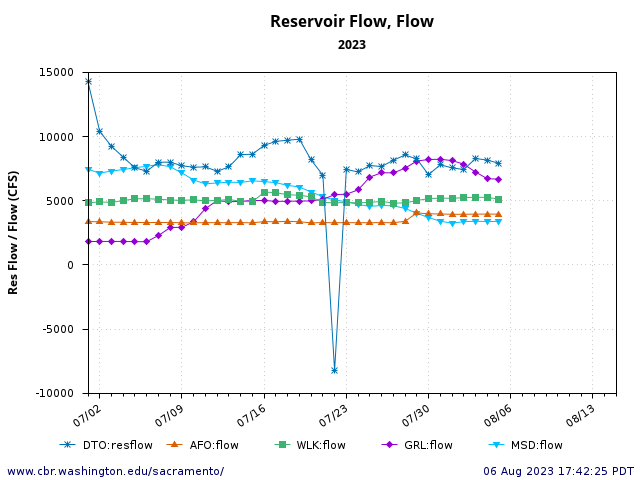
Figure 5. Streamflow at various gages in the Sacramento River from Keswick Dam (RM 300), Bend Bridge (RM 250) downstream to Wilkins Slough (RM 120) in May-June 2023. Note: tributary inflows in the reach below Bend gage in mid-June were approximately 5000 cfs in mid-May. Keswick Dam releases were increased in late June to maintain deliveries and sustain 5000 cfs at Wilkins Slough gage.

![Graph showing Striped bass Fall Midwater Trawl Survey Index (log10[index+1]) versus prior Summer Townet Index (log10). Select years labeled, with color of number showing year type: blue=wet, green=normal, and red=critically dry.](https://calsport.org/fisheriesblog/wp-content/uploads/2023/08/image1.jpeg)