It is August 2023, and the month will feature two “Super Moons.” The first full moon is called a “Sturgeon Moon,” originally coined in reference to the ease of catching sturgeon in the Great Lakes during a full moon in summer. Its cycle began with the quarter moon and neap tide on July 24 until the full moon on August 1. This year’s Sturgeon Moon was regrettably prophetic in that it coincided with a new sturgeon die-off in San Francisco Bay in summer 2023.
Last summer, there was die-off of nearly a thousand adult white sturgeon in the greater San Francisco Bay due to a toxic algae bloom. More dead white sturgeon adults have been showing up on Bay beaches again this summer. After analyzing data related to the die-off, I now blame the white sturgeon die-off on the Sturgeon Moon (i.e., the tides) and some complicit factors.
Why are toxic algae blooms occurring, and sturgeon dying, again this year, in a wet flood year? Toxic blooms are not supposed to occur in wet years.
Based on the information available, this summer’s die-off event is occurring during a Sturgeon Moon. The Sturgeon Moon cycle (that occurred in late July and early August this year around the August 1 full moon) causes the Delta to rapidly fill from the Bay and stop flowing (termed a spring tide). In the recent heat, all that water in the Delta and lower rivers heated up to 75ºF. Then the Sturgeon Moon cycle drained (neap tide) the Delta into the Bay. When the top three feet or so of warm Delta water all drained into the Bay, it triggered the toxic algae bloom, low oxygen, and hot water. In combination, these factors are killing the fish.
Sturgeon likely suffered their initial stress from the warm lower rivers where they spawned in May. By the time of the Sturgeon Moon, many had moved downstream into the Delta toward the cooler Bay. The emptying of the warm Delta into the Bay during the neap tide likely stimulated further movement into the Bay. Once in the Bay, the stressed sturgeon received added stress from the warm Bay and its new toxic algae bloom and hypoxia conditions. The accumulated stress from the whole series of events likely caused the die-offs observed in the past two summers.
Yes, the Sturgeon Moon, Bay pollution, and algae seeds from last years bloom played a part, but the biggest culprits were state and federal water managers, who allowed the rivers and Delta to heat up in early summer by making high water deliveries upstream of the Delta and exporting high volumes of water from the Delta.
I worry about the accuracy of the loss estimates of adult white sturgeon in the Bay. As noted in the Chronicle article cited and linked above, there may be many dead sturgeon that have gone undetected at the bottom of the Bay. Last year, as many as 1000 sturgeon were found dead. There are probably less than 10,000 adult white sturgeon left in the Bay-Delta spawning population. Sport fishermen generally harvest about a thousand each year. The California Department of Fish and Wildlife and the California Fish and Game Commission are revisiting fishing regulations this fall and may close or restrict the popular sport fishery.
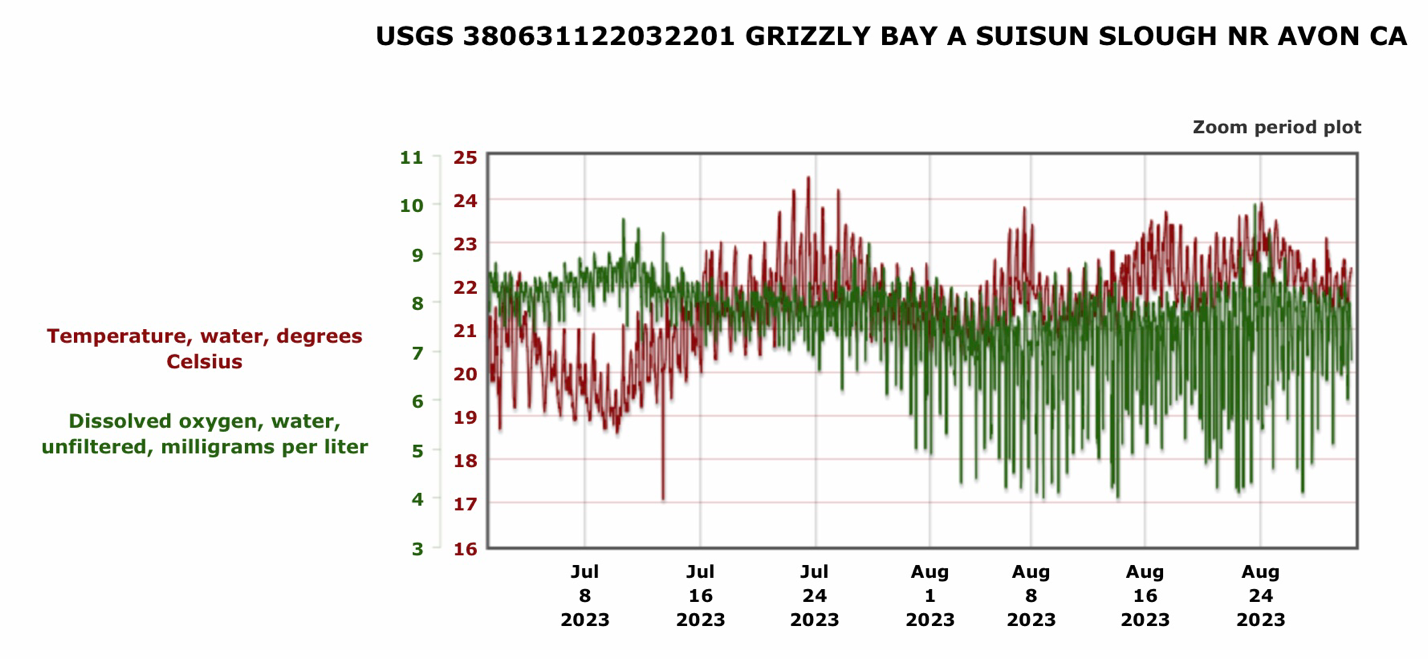
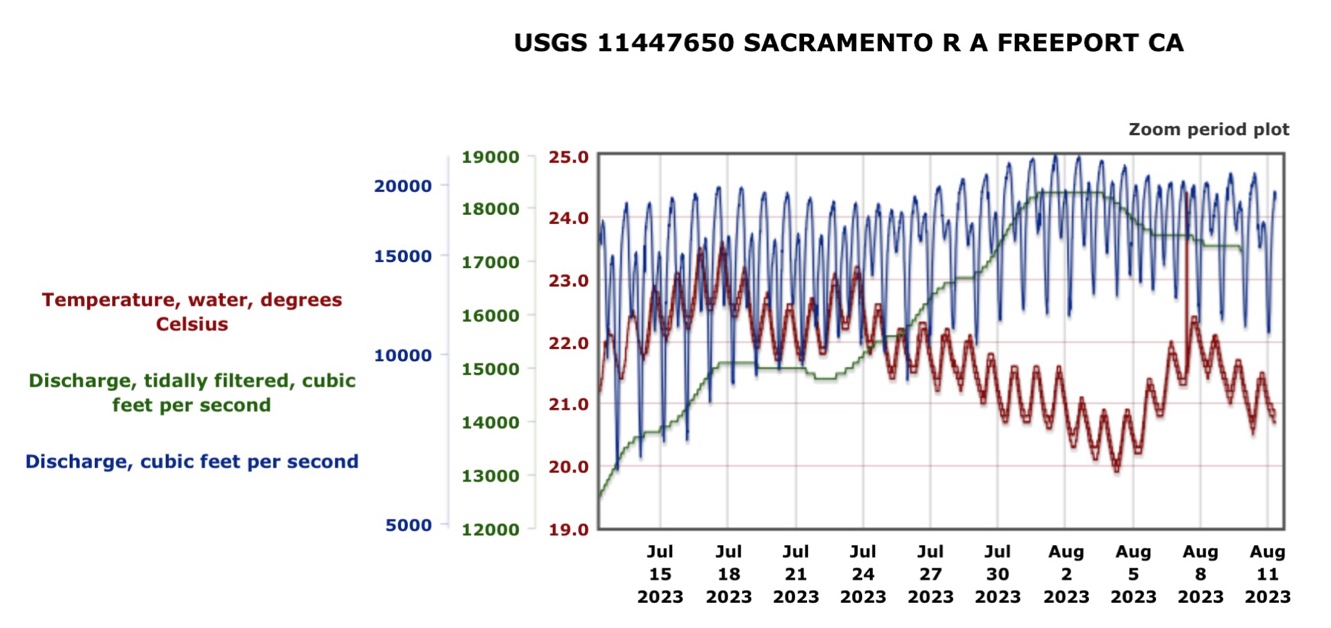
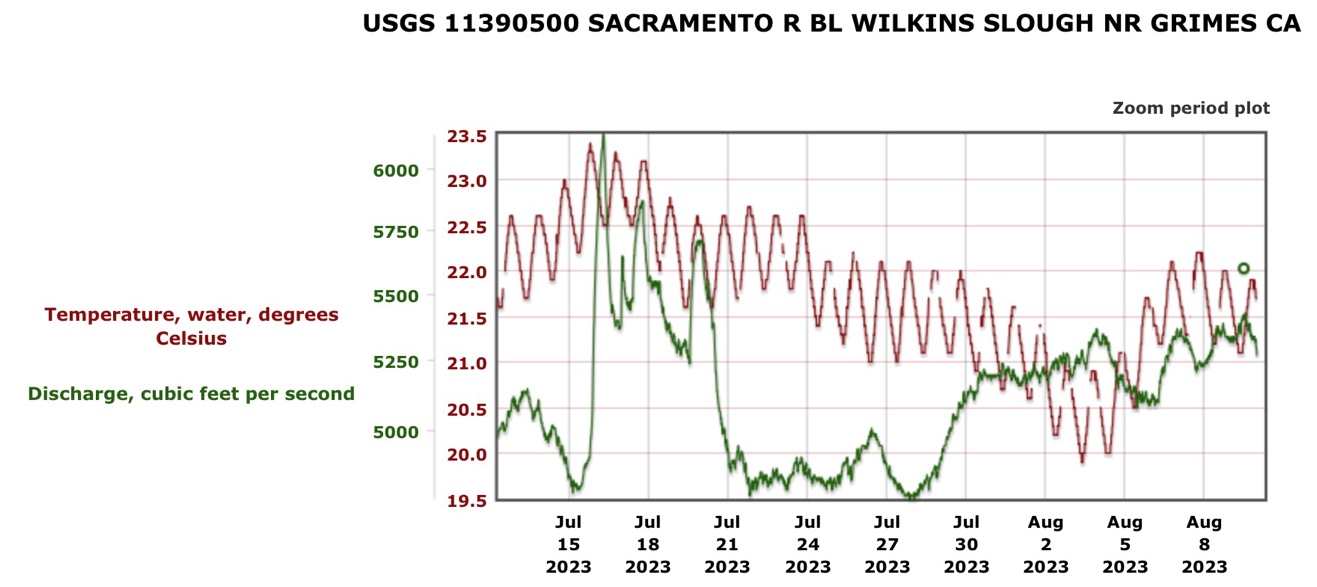
Could these circumstances have been avoided? Yes. First by maintaining lower Sacramento River and Delta inflow temperatures (Figure 1) at or below the state water quality standard of 68ºF (20ºC) with adequate flows (greater dam releases and/or less water deliveries). The lower Sacramento River flow of 5000 cfs is far too low for early summer, especially in a wet year. Second, by maintaining Delta temperatures at least in the 20-22ºC range (there is no Delta water temperature standard) with adequate cool inflows. Third, by maintaining water temperatures in Bay below 20ºC with adequate cool Delta outflow during the spring tides. This solution would have been difficult to achieve in drought year 2022, but not in flood year 2023.
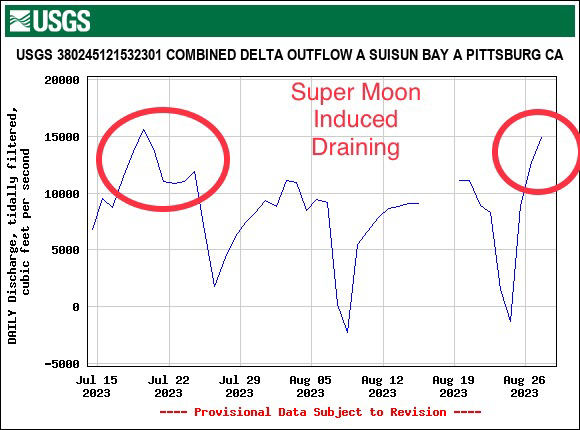
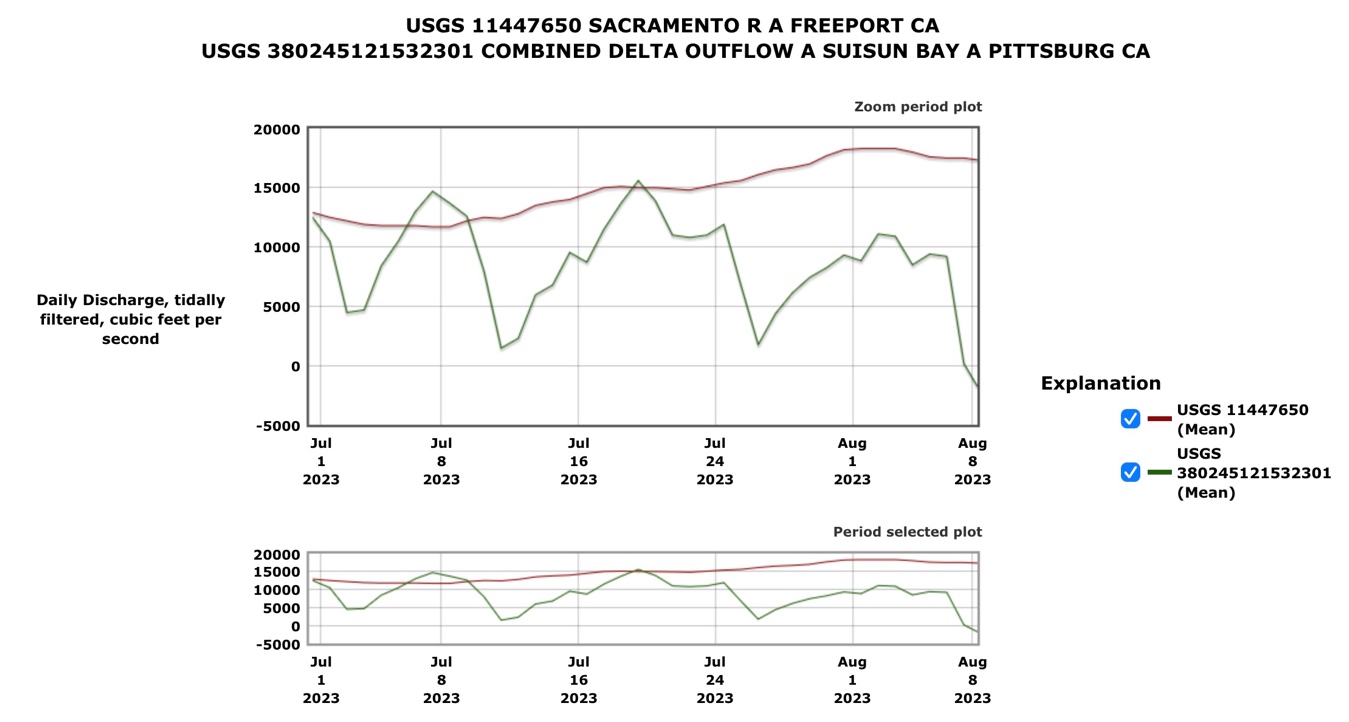
Water project managers should have foreseen the tidal patterns coming in the summer (Figure 2) and the inadequacy of the estimated flows they were providing to the Delta (Figure 3). Measured Delta outflow by USGS was actually lower than the DWR model predictions (Figure 4). Instead, water managers provided approximately 20,000 cfs of water deliveries, including near-maximum export pumping from the Delta (Figure 5). The upstream pull to the south Delta export pumps reached a peak near 10,000 cfs in interior Delta channels at the end of July (Figure 6).
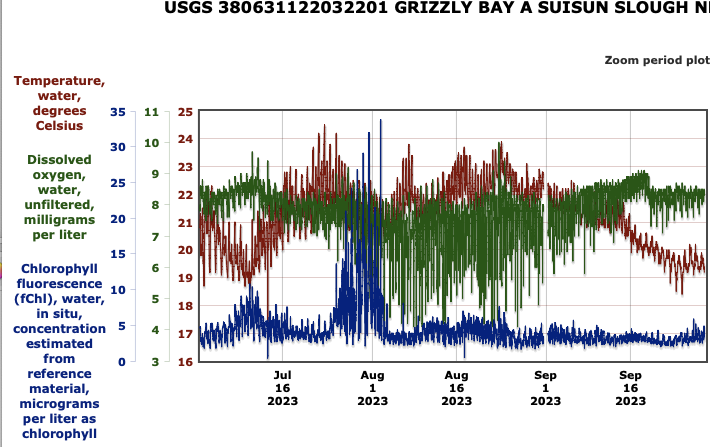
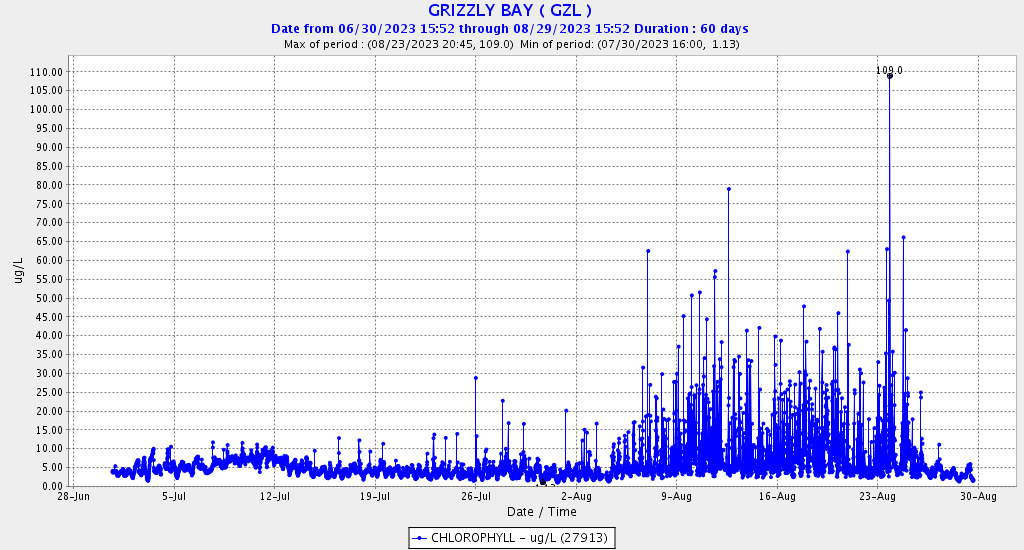
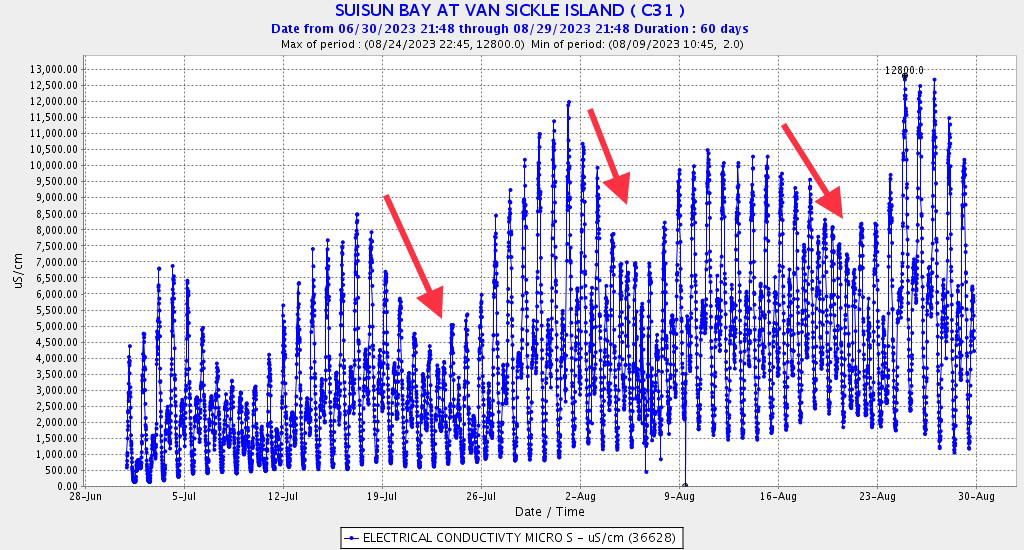
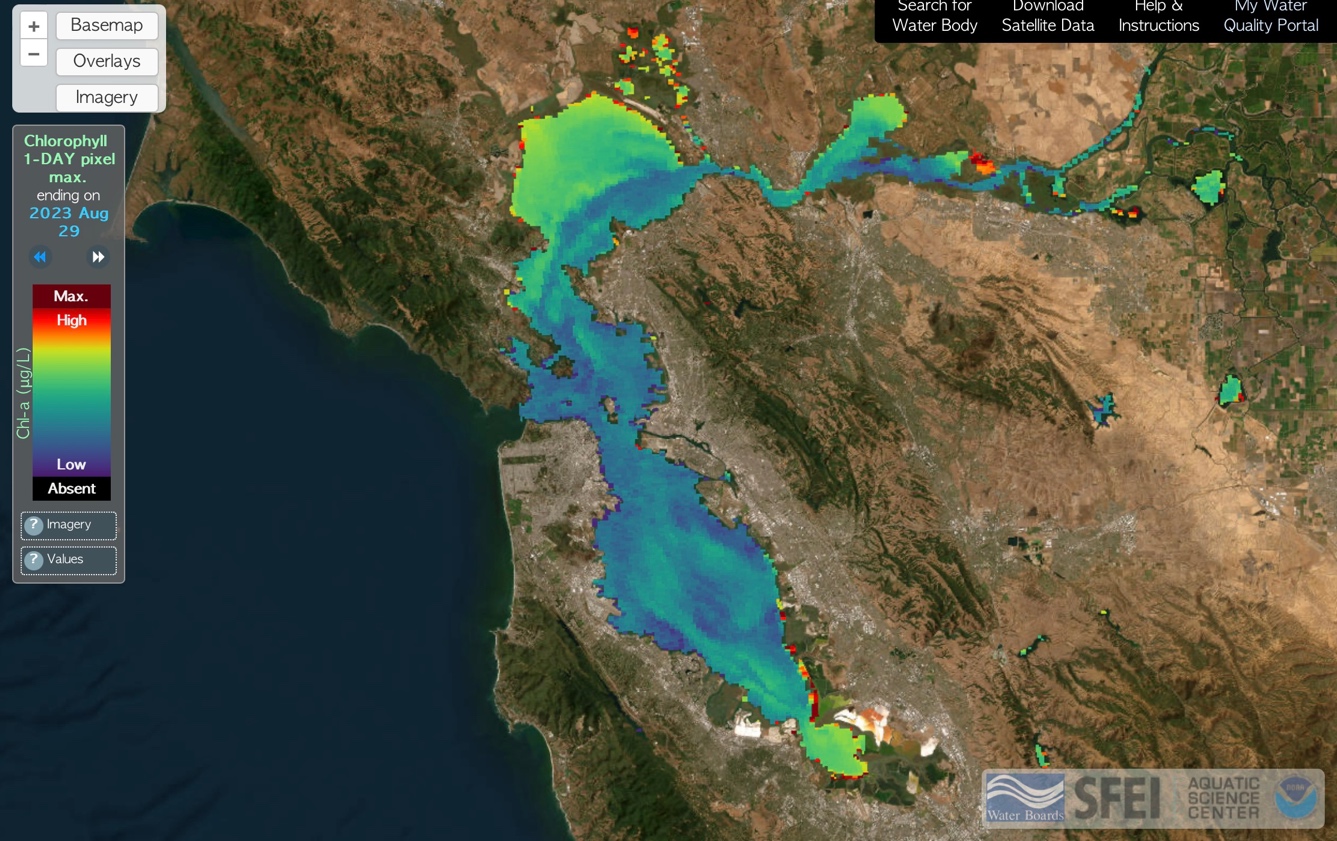
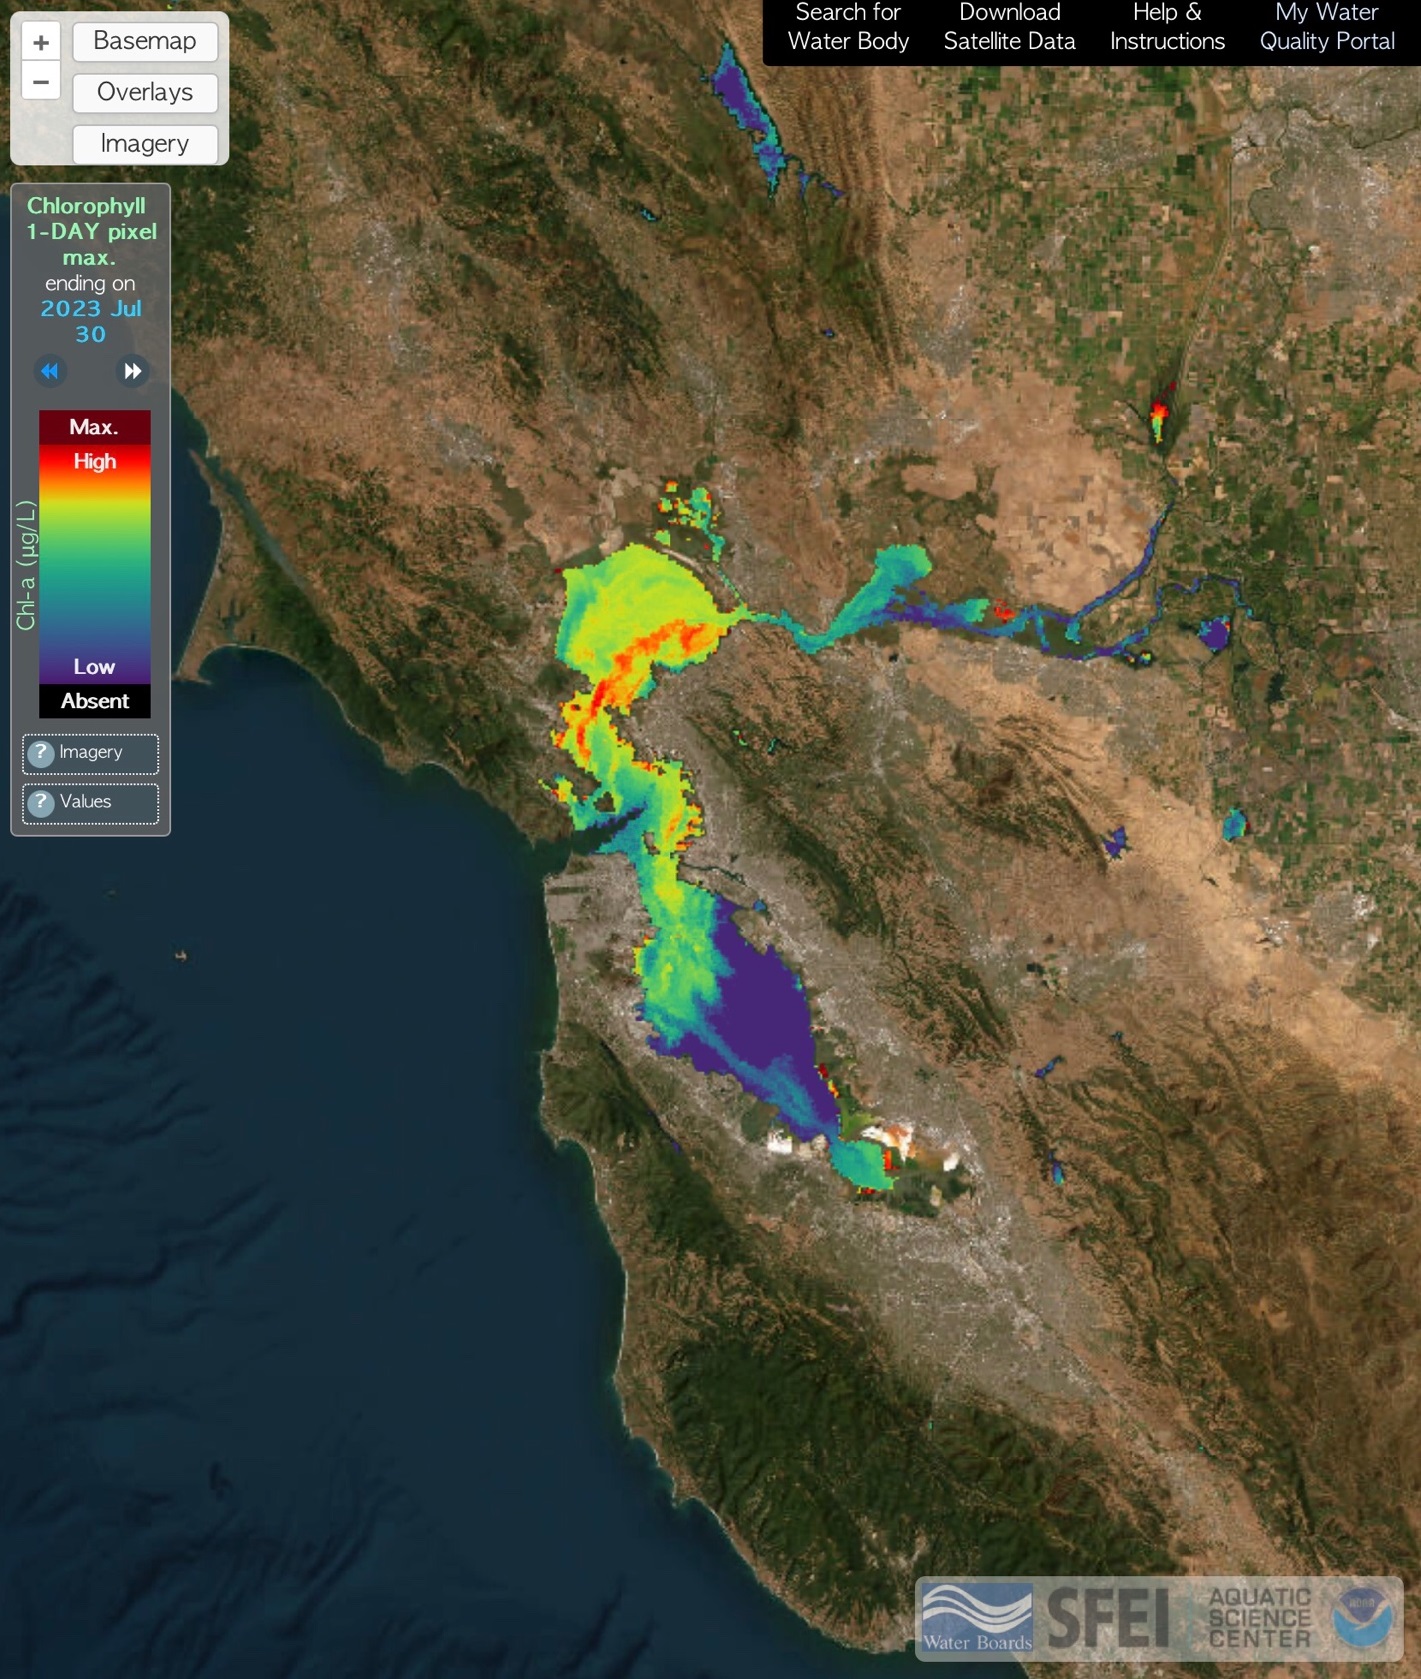
The influx of warm water reached a peak at the maximum ebb tide on July 24. This can be seen in Figure 7 at the Carquinez Bridge gage, and Figure 8 in Suisun Bay. Evidence of the Bay bloom can be seen in Figure 9, as the North Bay water returned to the East Bay with its algae (chlorophyll) concentrations and low dissolved oxygen at the end of July, coinciding with the return of the spring tide. Further evidence of the bloom is indicated in Figure 10 in the low nitrogen concentrations at the end of July in Suisun Bay.
In summary, the recent reappearance of a die-off of white sturgeon in the Bay appears to have been triggered by the strong tides of the summer Sturgeon Moon draining warm water from the Delta into the Bay. The warm water, in turn, was the result of excessive water diversions upstream of the Delta and near-maximum water exports from the Delta, combined with tidal dynamics.
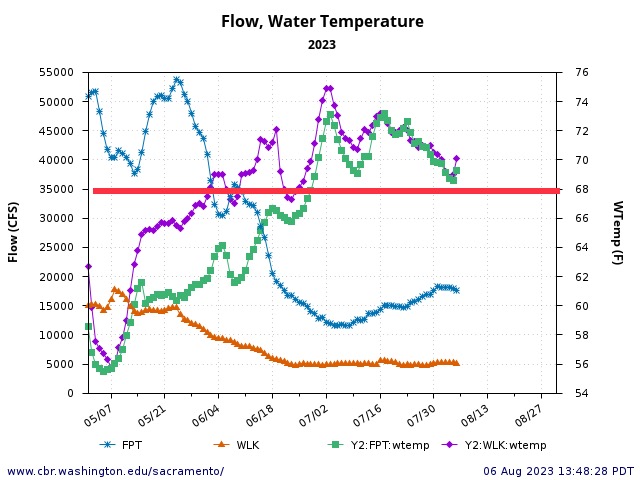
Figure 1. Flow and water temperature in the lower Sacramento River upstream of the Delta at Wilkins Slough (WLK) and at the entrance to the tidal Delta at Freeport (FPT). Red line is water quality standard for lower Sacramento River.
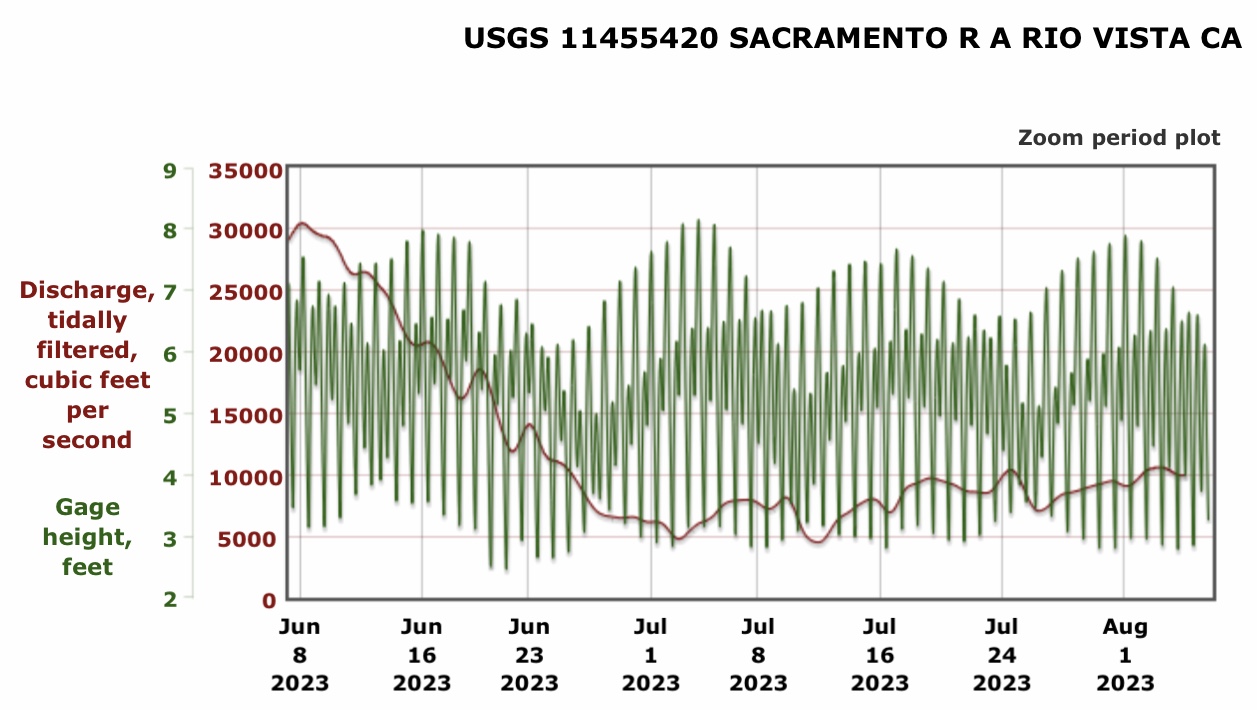
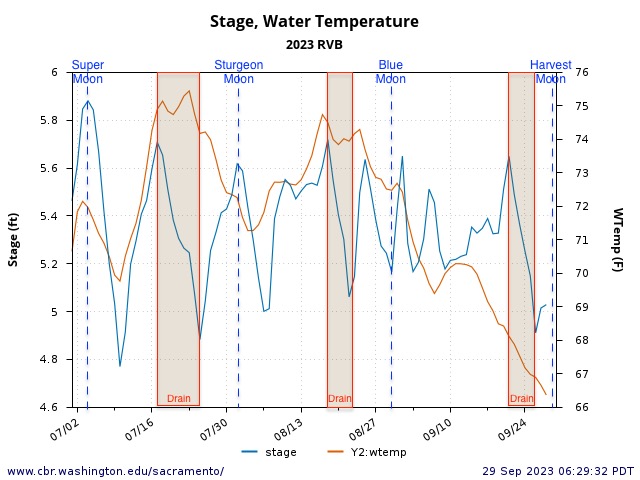
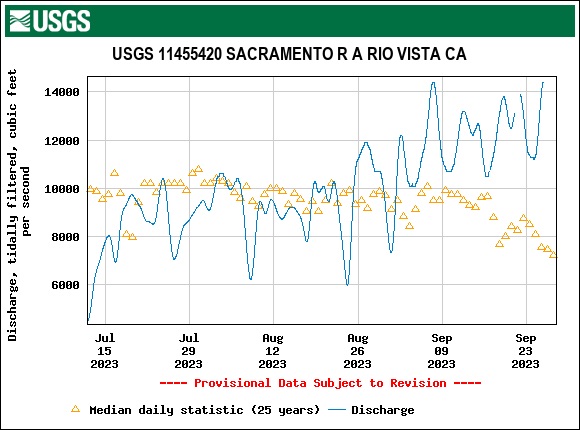
Figure 2. Average daily flow and hourly stage at Rio Vista in North Delta near exit to the Bay. Note the sharp flow increase and the drop in stage on 7/24 (Delta draining under the neap tide of the initial quarter of the Sturgeon Moon.)
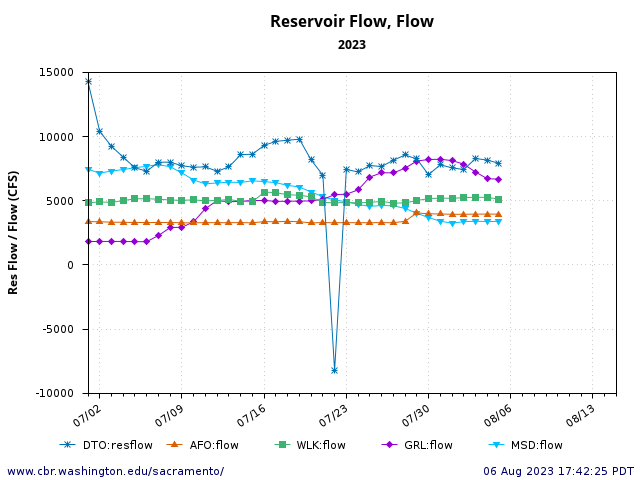
Figure 3. Stable Delta conditions in July 2023. Inflows = (American River AFO + Lower Sacramento River at Wilkins Slough WLK + lower Feather River at Gridley GRL + lower San Joaquin river at Mossdale MSD. Outflow (DWR-DTO) = Inflow – exports. Note relatively stable conditions. Note DWR outflow is calculated (not measured) from daily flows.
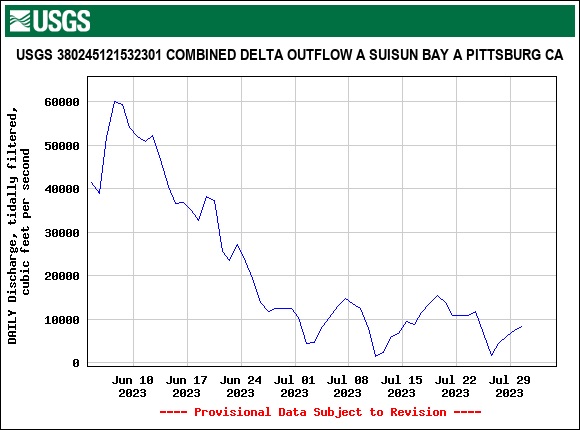
Figure 4. Delta outflow as estimated by USGS from flow gages. Note drop in Delta outflow (at the peaks in spring tides) beginning on 7/24 as shown in Figure 2, but not in Figure 3. Also note the peak outflows were higher in USGS outflows.
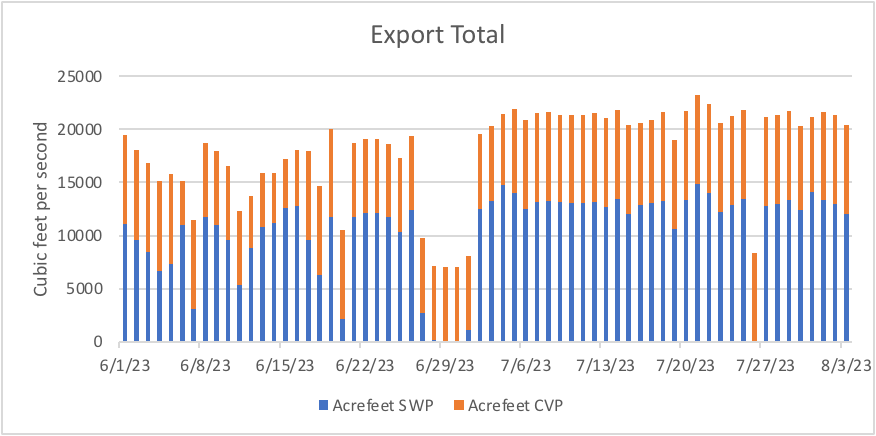
Figure 5. South Delta SWP and CVP exports June-July 2023. Note 20,000 acre-ft per day is approximately hourly average of 10,000 cfs. Maximum export rate is 11,400 cfs (approximately 23,000 acre-ft per day).
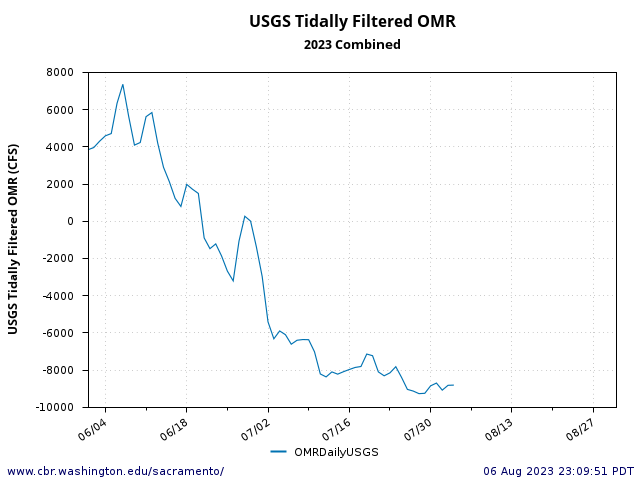
Figure 6. Old and Middle River flows toward export pumps in south Delta.
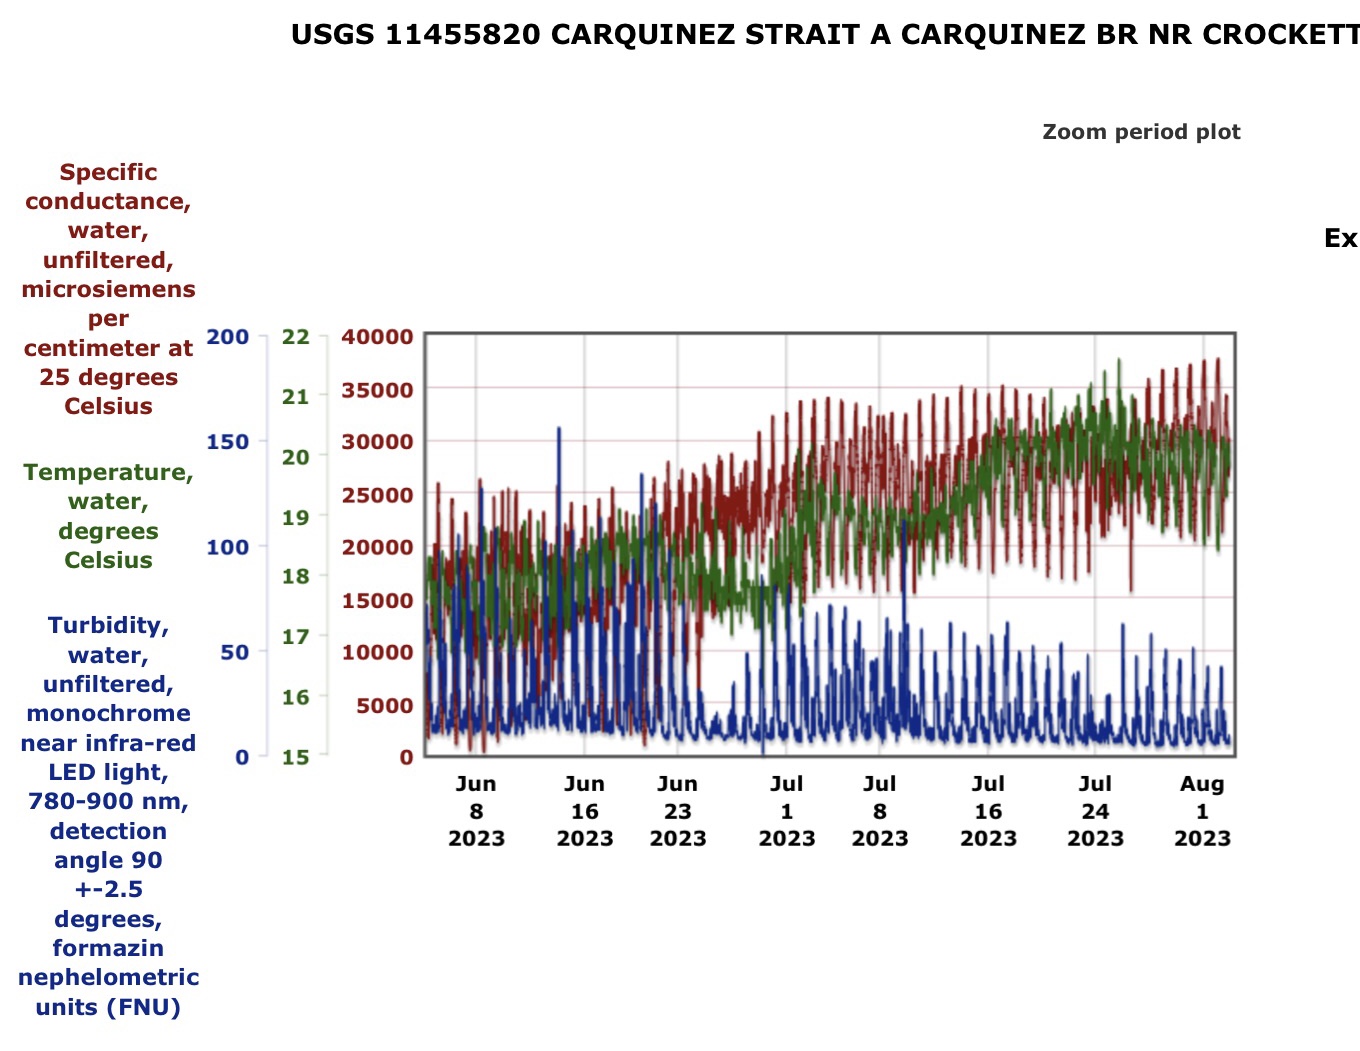
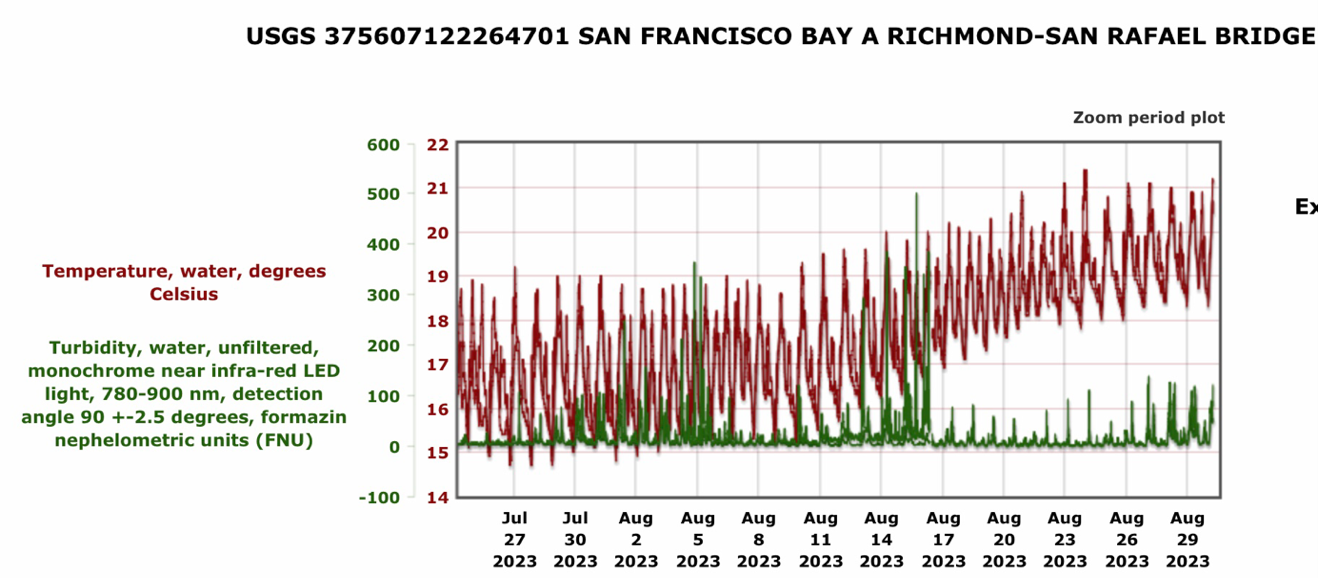
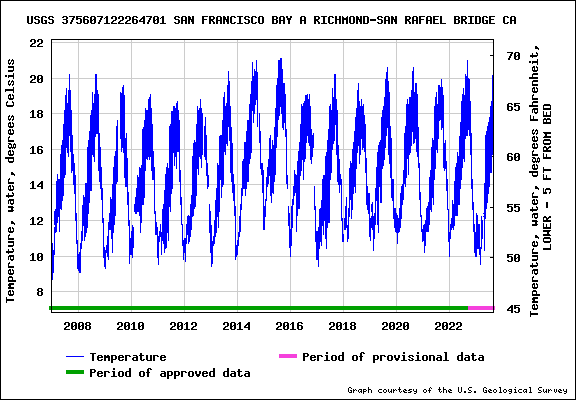
Figure 7. Salinity (EC), water temperature (C), and turbidity at Crockett in north Bay in June-July 2023. Note neap tide and lower salinity, warm, clear water on 7/24-25.
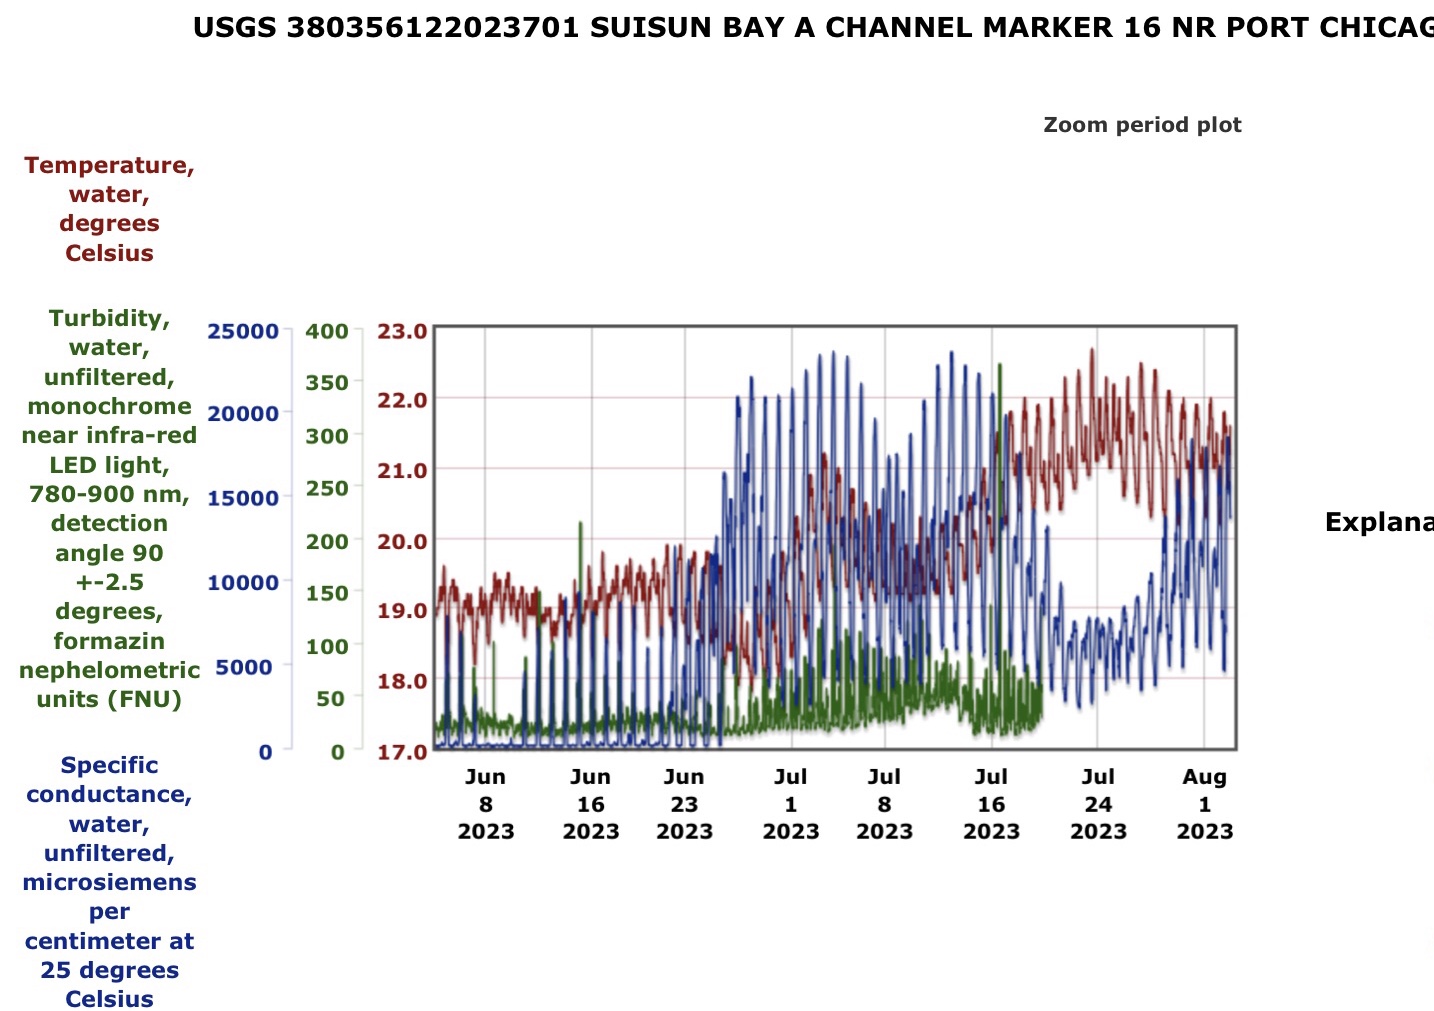
Figure 8. Salinity (EC), water temperature (C), and turbidity at Port Chicago in east Bay in June-July 2023. Note neap tide and lower salinity and warmer water on 7/22-25.
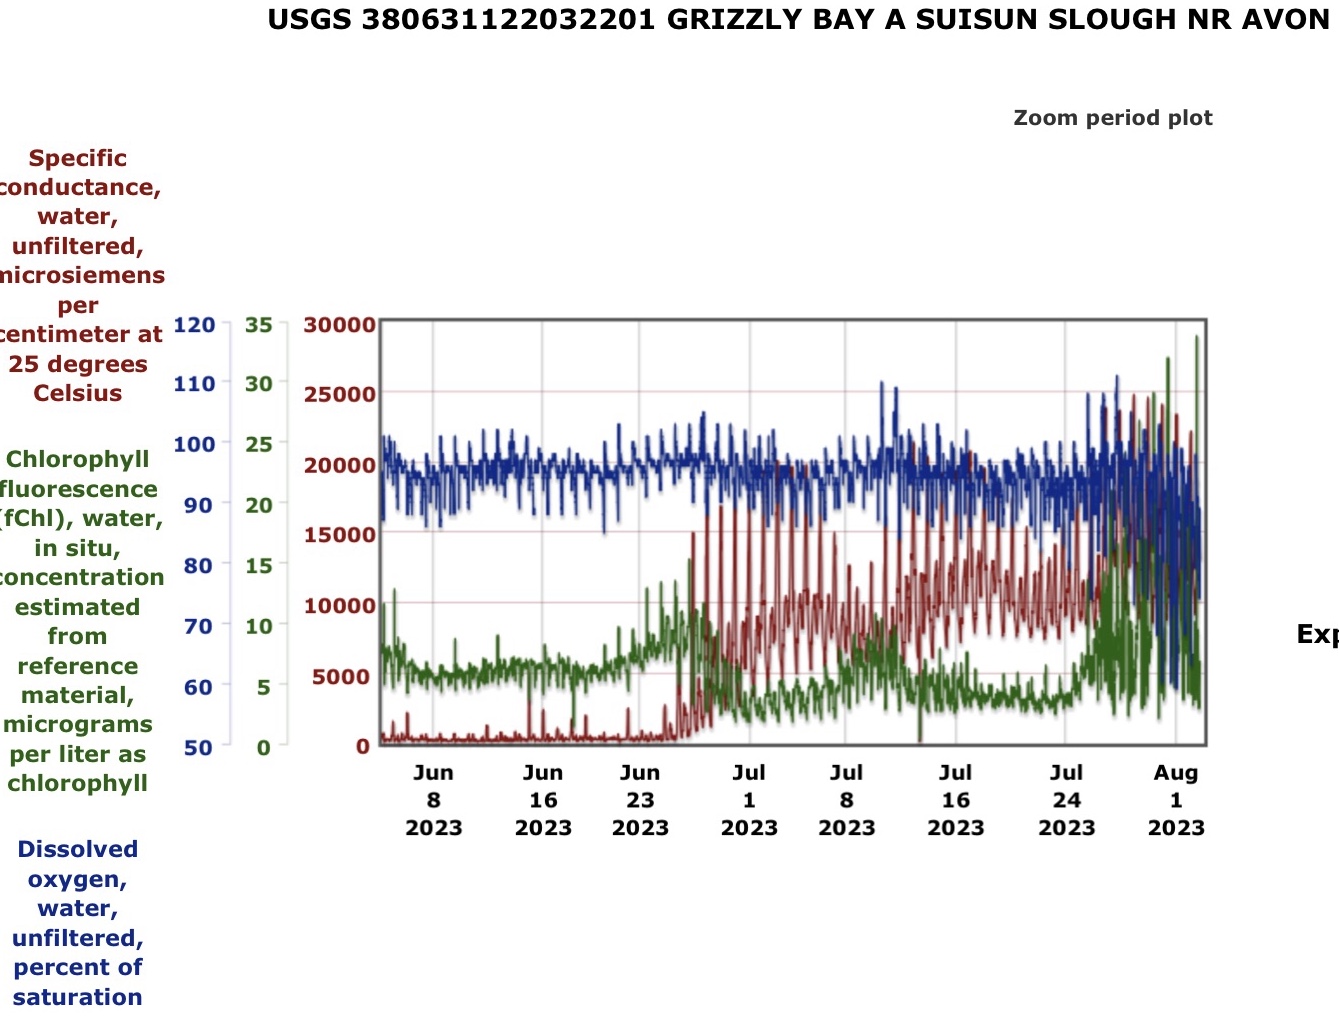
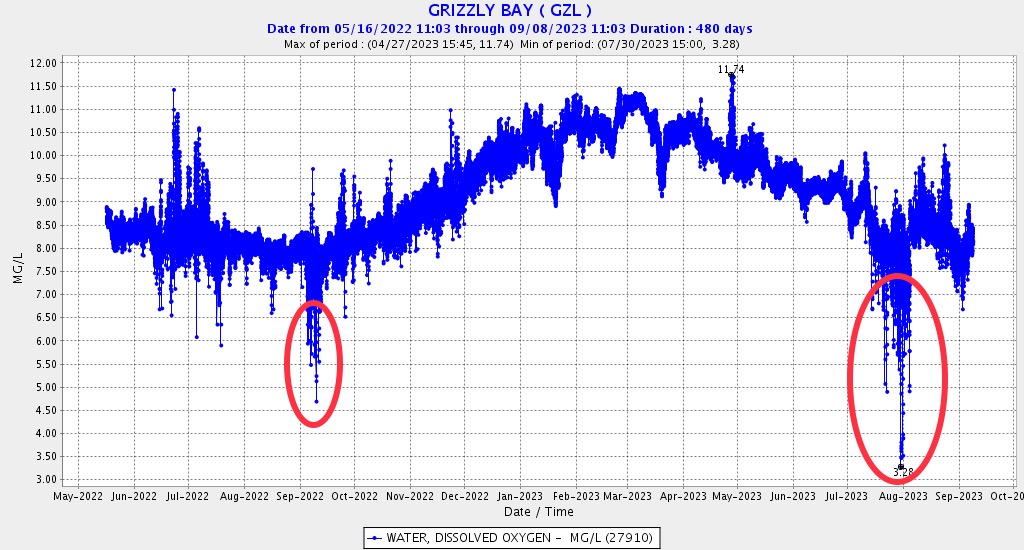
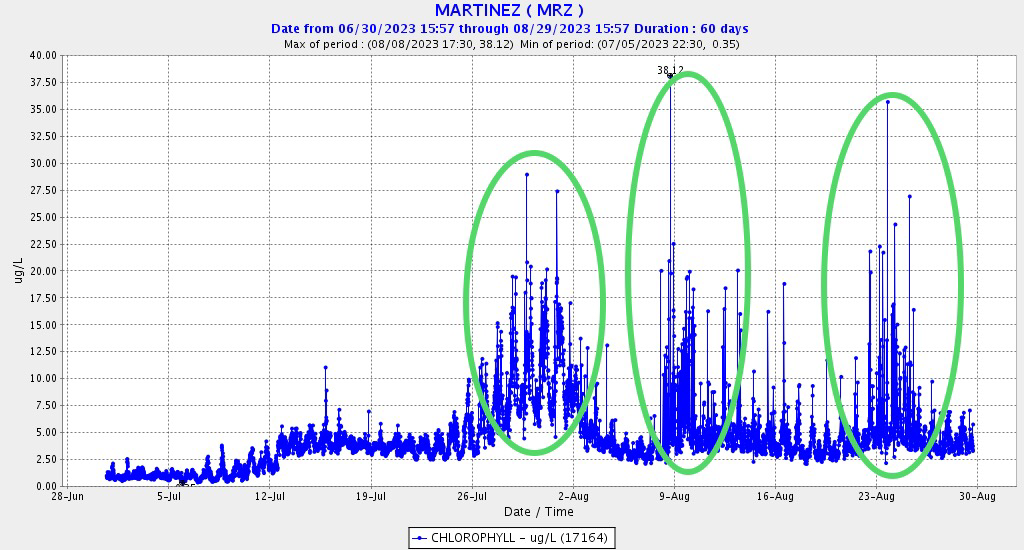
Figure 9. Salinity (EC), dissolved oxygen, and chlorophyll concentration in east Bay in June-July 2023. Note bloom, higher salinity, low dissolved oxygen beginning on 7/25.
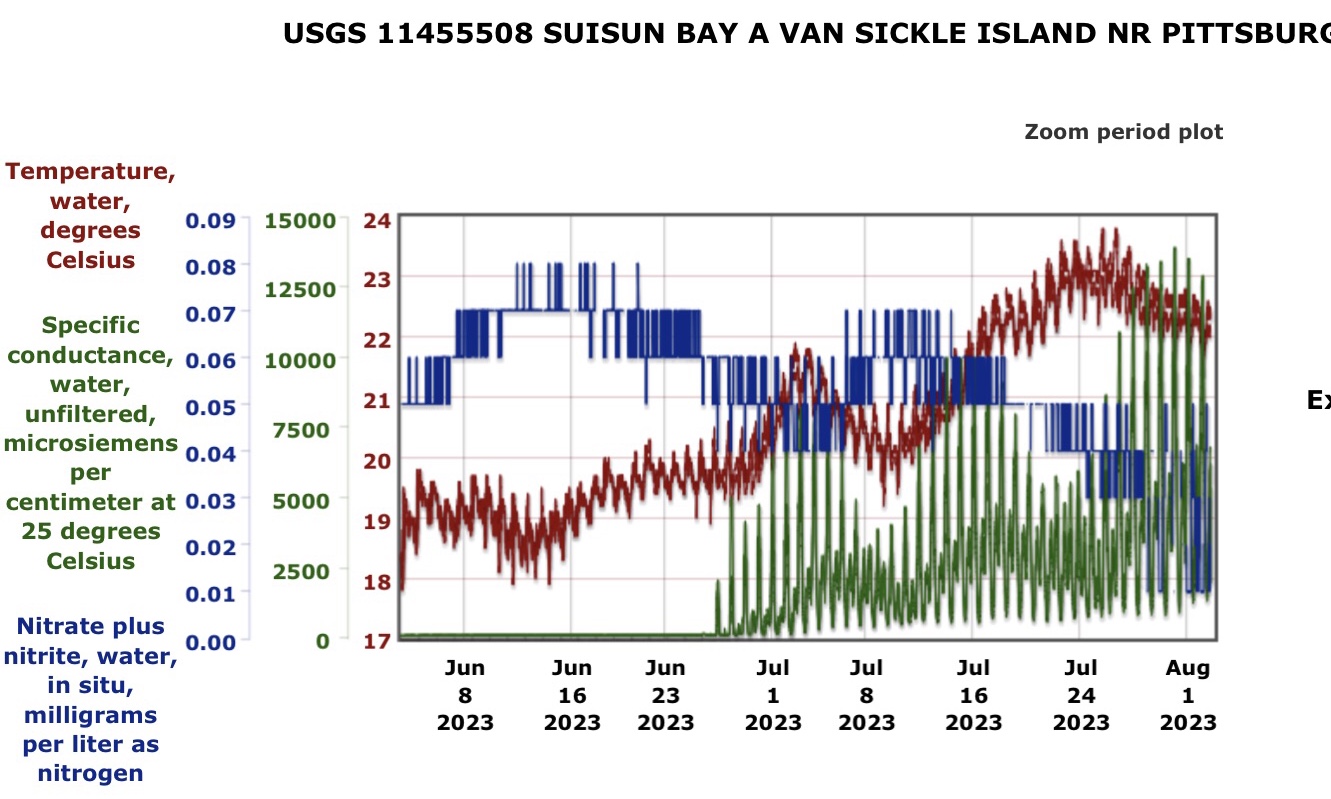
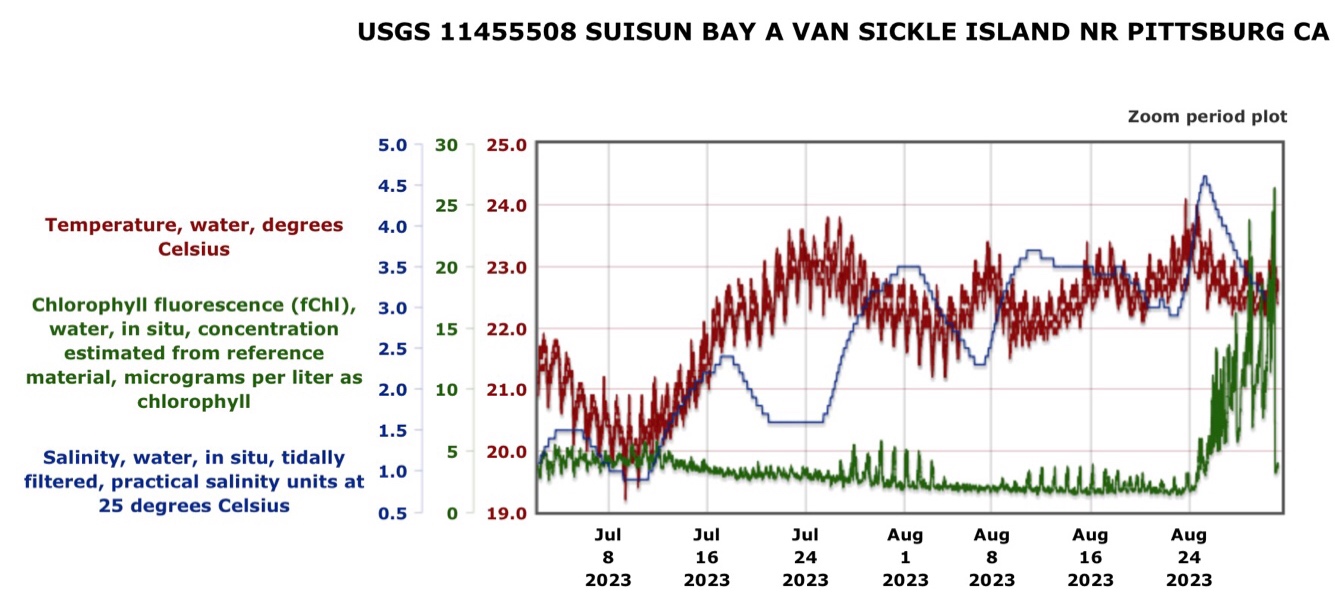
Figure 10. Salinity (EC), water temperature (C), and total nitrogen at Pittsburg in east Bay in June-July 2023. Note higher salinity and water temperature, and reduced nitrogen (from algae uptake) beginning on 7/24-25.

![Graph showing Striped bass Fall Midwater Trawl Survey Index (log10[index+1]) versus prior Summer Townet Index (log10). Select years labeled, with color of number showing year type: blue=wet, green=normal, and red=critically dry.](https://calsport.org/fisheriesblog/wp-content/uploads/2023/08/image1.jpeg)