Another Drought Year, Another Temporary Urgency Change Petition to Weaken Delta Water Quality Standards

The Bureau of Reclamation and California Department of Water Resources (DWR) have proposed another temporary urgency change petition (TUCP) for Delta operations in 2022 (Figure 1, below).  The purported purpose is:

operating the Projects to provide for minimum health and safety supplies…; preserve upstream storage for release later in the summer to control saltwater intrusion into the Sacramento-San Joaquin Delta (Delta); preserve cold water in Shasta Lake and other reservoirs to maintain cool river temperatures for various runs of Chinook salmon; maintain protections for State and federally endangered and threatened species and other fish and wildlife resources; and meet other critical water supply needs.  (TUCP, p. 1).

Under the previous TUCPs in 2014, 2015, and 2021, Reclamation and DWR did not preserve reservoir storage, control salt water intrusion, maintain cold-water in Central Valley reservoirs, or protect listed fish species, but they sure did sustain Central Valley farmers.  In the spirit of being consistent, the latest TUCP makes no mention of the tradeoffs or specific priority criteria.  That’s because, once again, everything in this TUCP is for water contractors.  There is no fresh water to the Bay, its crabs, herring, or anchovies, let alone its salmon, smelt, striped bass, or other fisheries.

The TUCP claims: “The TUCP will support Reclamation and DWR in balancing the competing demands on water supply and is critical to provide some protection of all beneficial uses of the Delta including for fish and wildlife, salinity control, and critical water supply needs.”  (TUCP, Environmental Information, p. 1).  No, it’s simply for contractor water, nothing else.

The TUCP explains: “The continuation of extremely dry conditions in the Delta watershed has resulted in inadequate water supply to meet water right permit obligations for instream flows and water quality under D-1641.”  (TUCP, p. 1).  Apparently, Reclamation and DWR must have forgotten that during extremely dry conditions last year and the year before, Reclamation and DWR gave too much water to their contractors.  They depleted storage to historic lows.  In 2020 and 2021, they knew the snowpack was low.  They knew reservoirs would empty.  They delivered the water anyway.

Well, things are looking really bad: “[T]he conditions of 2021 have left the Projects in a precarious state, with little water to manage even under slight drought conditions next year.”  (TUCP, p. 2).  They knew this was going to happen.  They also knew they could employ their TUCP tricks again.

But fear not.  “[T]he proposed changes in operations will not injure other lawful users of water; will not unreasonably affect public trust resources such as fish and wildlife or other instream beneficial uses; and are in the public interest.”  (TUCP, p. 2).  This is an outright lie, and they think we are suckers enough to believe it.
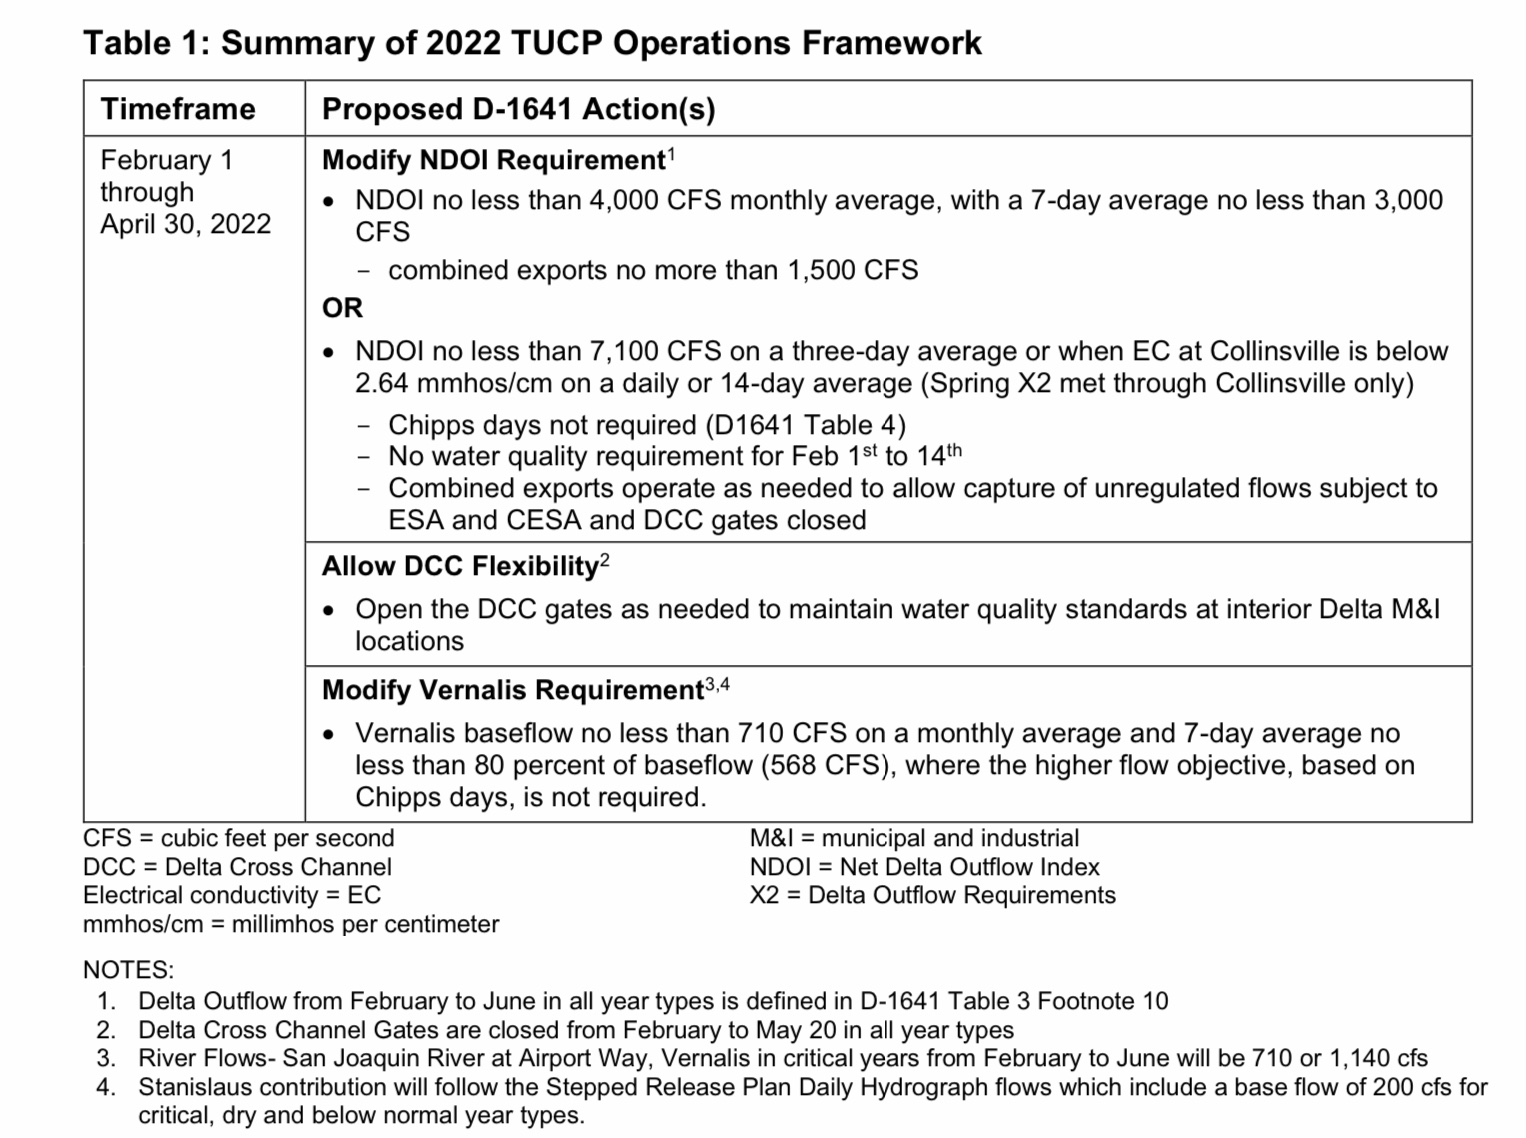
Figure 1. TUCP Framework, Table from TUCP, p. 2.

Translation of Figure 1: Let no water flow to the Bay.  Open the Delta Cross Channel gates to capture all the out-migrating salmon, steelhead, sturgeon, and steelhead and divert them straight to the Central Delta and water project pumps, along with the fresh water from the Sacramento River.  Let the San Joaquin River die.  Make minimal exports from the Delta because upstream contractors will take all the reservoir and river inputs to the Delta.  Well, not entirely, because upstream contractors will sell much of their water to Southern California users.  The State Water Board will allow transfers through the Delta without the minimal safeguards required for non-transfer exports.  In sum, Reclamation and DWR will deliver to Sacramento Valley contractors about 20 times the water allegedly “saved” by weakening Delta standards, once again disproving the elementary school arithmetic that says to preserve storage, you can’t let more water out of a reservoir than you take in.

Is this a great system or what?

For more on the subject, read https://www.nrdc.org/experts/kate-poole/california-drought.
A Ridiculous Premise

A recent post from the Center for California Water Resources Policy and Management (Center) discusses the extinction of the Delta smelt.  The post starts by saying, “To be sure, the delta smelt’s numbers are in decline.”  That is a real understatement, but it contains some acknowledgement of the facts.

The author goes on to say, “It might fairly be argued that prime contributors to the delta smelt’s distressed status are California’s resource agencies.”  The ostensible rationale for this attribution is, first, that the resource agencies don’t look for smelt in the right places in the right way.  Second, because the agencies can’t find the smelt, “they have resisted managing the species ‘adaptively’” based on the monitoring that they don’t do.

This ridiculous premise suggests the decline has not been caused by excessive exports of water from the Bay-Delta watershed over the past five decades, but by the resource agencies who don’t know where to find and thus protect the smelt.

The author argues: “The agencies persist in mobilizing trawler-based open-water fish surveys, originally intended to census juvenile striped bass, as their primary means of monitoring delta smelt and the Delta’s other protected fish species.”  This statement is simply untrue.  To provide better coverage of “open-water” pelagic smelt, the Interagency Ecological Program (IEP) in recent decades added the Larval Survey, the 20-mm Survey, the Kodiak Trawl Survey, and most recently the Enhanced Delta Smelt Monitoring Program (EDSM).   All of these surveys, plus the historic Fall Midwater Trawl and Summer Townet Surveys (and 50 years of Delta Export Fish Salvage Surveys), show the smelt’s catastrophic decline and march toward extinction.

But the author insists that the smelt are out there somewhere.  “The surveys sample neither the relevant habitat strata used by those fishes nor the extent of their ‘closed’ populations, which would allow for estimates of the sizes of their populations.”  If the smelt are out there in “closed populations” whose numbers would change the conclusions about the smelt’s catastrophic downward trend, then surely the author and the water purveyors who have a vested interest in finding those populations can muster some evidence and show the agencies and the rest of the world where to look.

Basic review and analyses of the available information show the decline of Delta smelt is highly associated with increasing exports and associated factors (see my many posts on this subject).  The partial truth in the notion that the resource agencies have been complicit in the decline of Delta smelt stems from agency inaction to cut back those exports consistent with biological sustainability.  Agency managers don’t lack information and scientific method.  They lack the political courage to deploy them.

Lake Shasta – Late Fall 2021

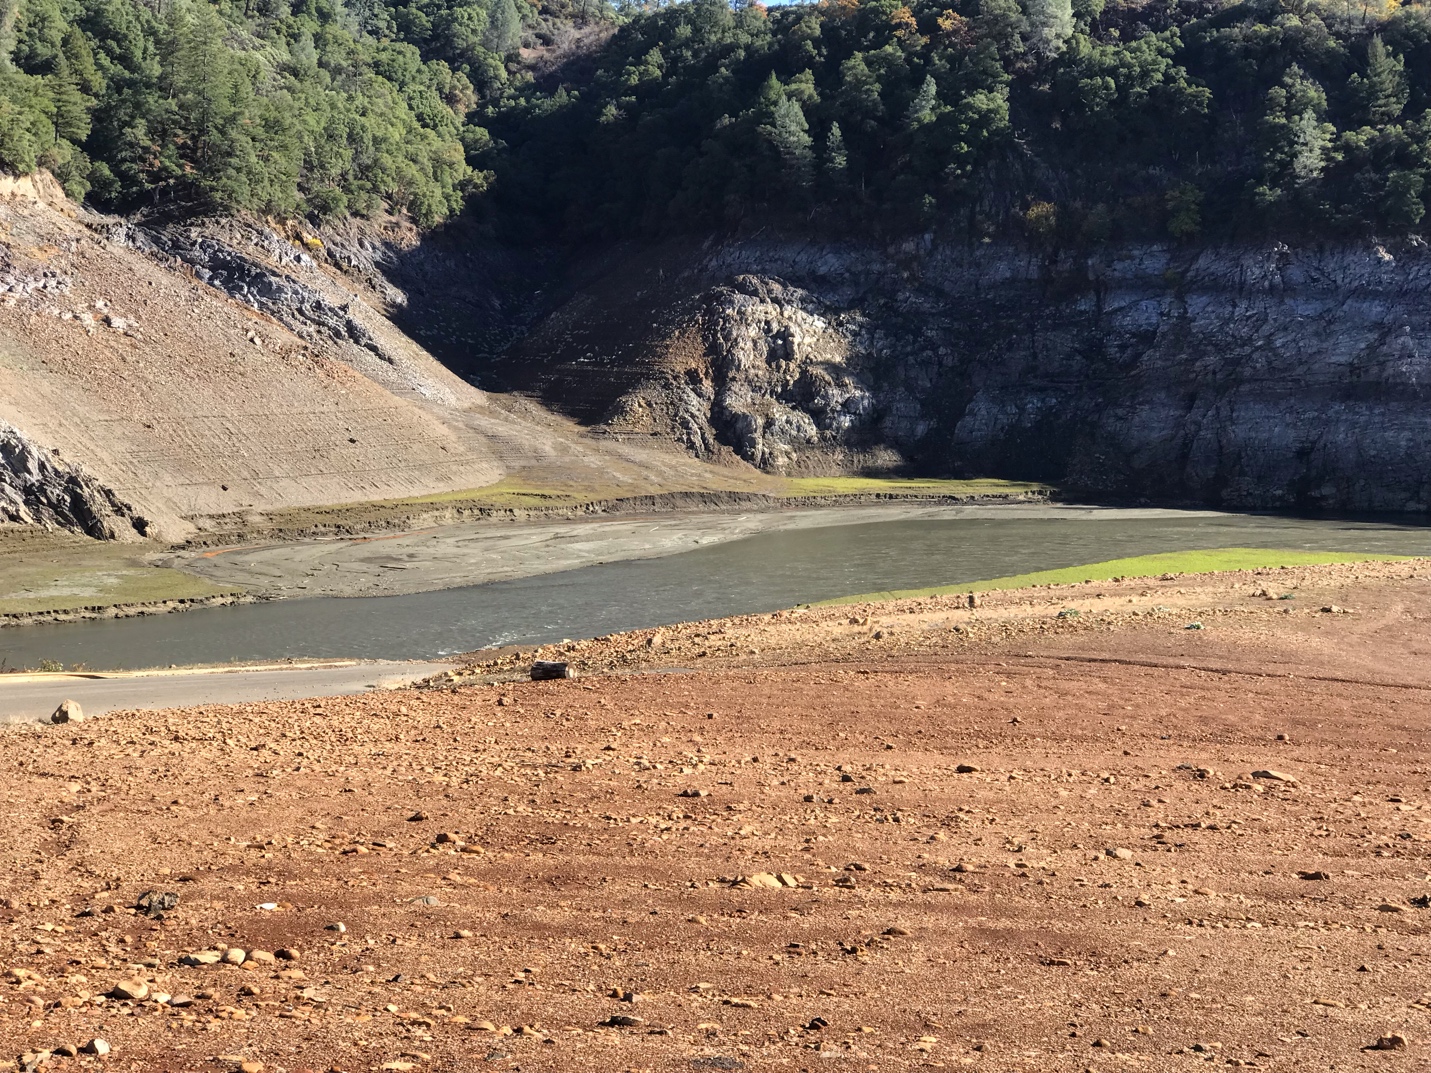
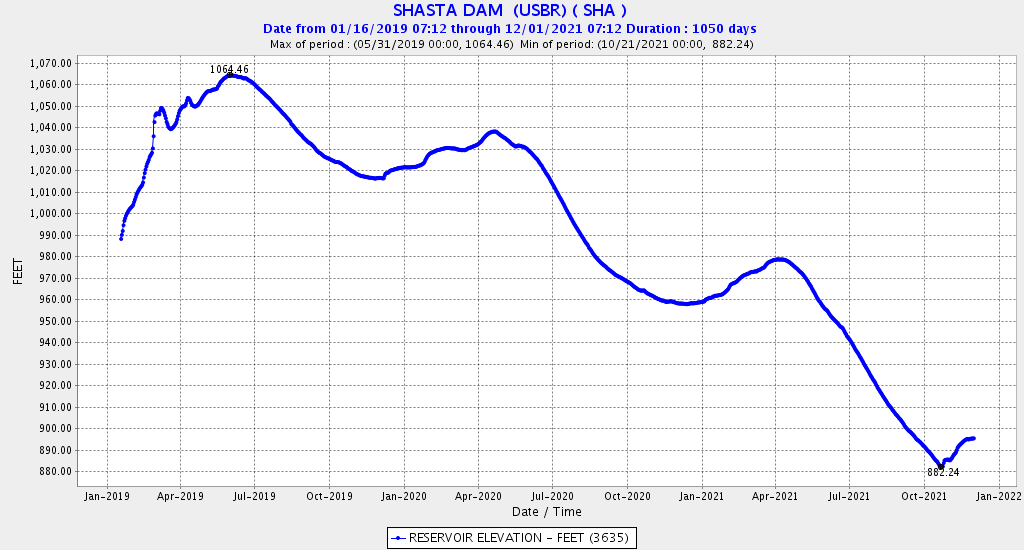
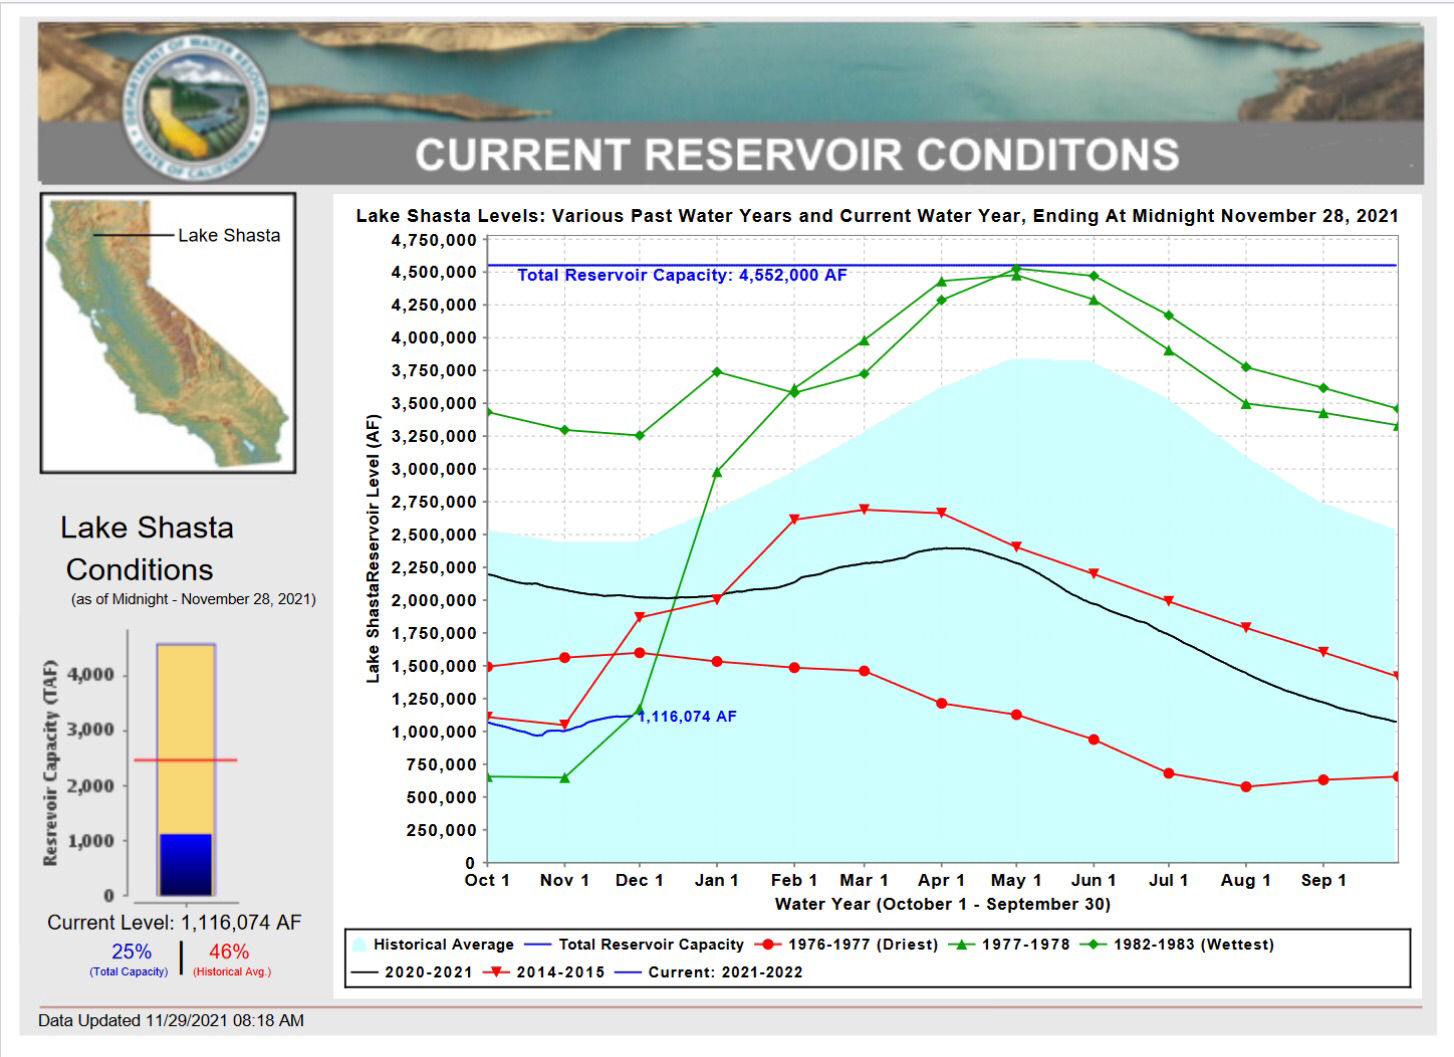
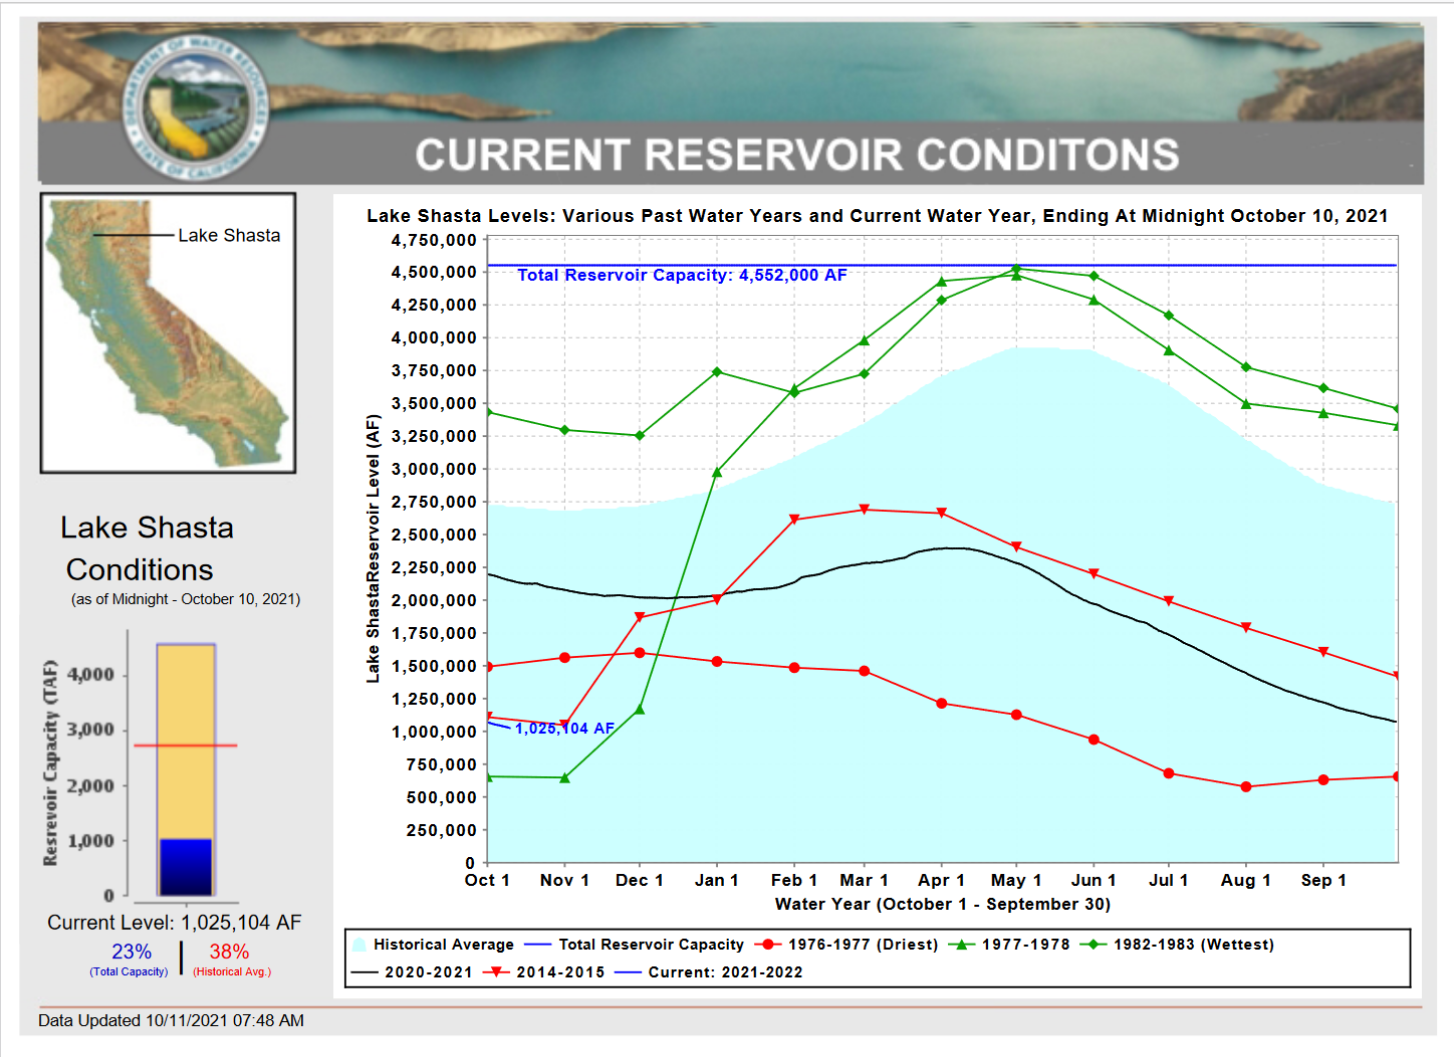
When I first moved to California in fall 1977, I camped at Lakehead on Lake Shasta. I was surprised to only find the Sacramento River. I got the same view on a recent visit (Figures 1 and 2). No black bass or channel catfish, and few trout. The lake is down nearly 200 feet from when it last filled in spring 2019 (Figure 3). Storage is at 25% capacity (Figure 4). Flows were high from recent storms. The “river” was cutting into decades of deposited sediment, making what remained of the lake very turbid. Not the greatest conditions for my favorite fall fishery for spotted bass and trout.

Figure 1. Mid-November 2021 photo of Sacramento River arm of Lake Shasta. Note river cutting through historic lake sediments.

Figure 2. Mid-November 2021 photo of Sacramento River arm of Lake Shasta. Note “cuts” in lake sediment and turbid water.

Figure 3. Water surface elevation in Lake Shasta 2019-2021.

Figure 4. Current and historical water-year conditions for Lake Shasta storage.

Scott and Shasta River Update – October 2021 Saved by the Bell

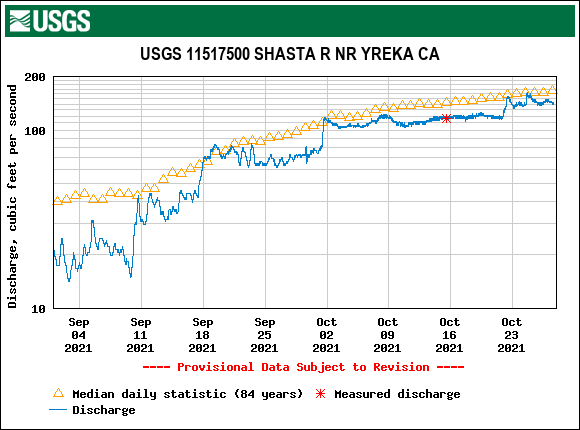
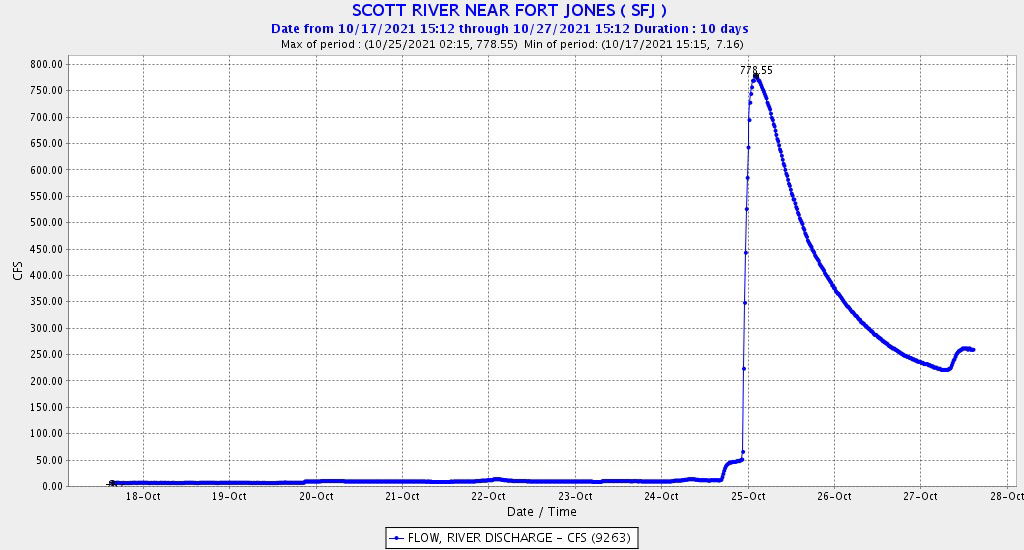
The Scott and Shasta rivers, California tributaries to the Klamath River, received irrigation curtailment orders from the State Water Resources Control Board  September 10 of this drought year.  The Shasta River responded well to the curtailment orders, and flows subsequently improved even more when  the irrigation season ended on 10/1 (Figure 1).  In contrast, the Scott River showed little response to curtailment (Figure 2).  The Shasta River salmon counts reported by the California Department of Fish and Wildlife as of October 18th were 6,659, whereas the Scott River count was only 23.

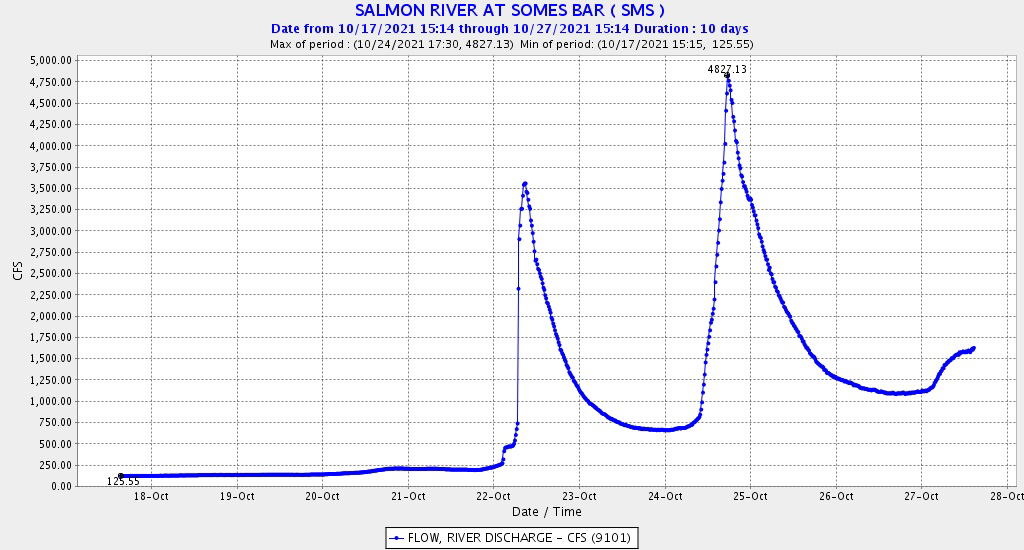
Heavy rains in late October improved river flows, reduced the need to irrigate pastures and hayfields, and have allowed Chinook and Coho salmon to freely ascend both rivers to spawn. The Salmon River, a third large tributary that enters the Klamath downstream of the Scott, responded similarly to the storms (Figure 3).

Figure 1. Streamflow in the Shasta River Sep-Oct, 2021.

Figure 2. Streamflow in the Scott River Sep-Oct, 2021.

Figure 3. Streamflow in the Salmon River Sep-Oct, 2021.


Winter Run Chinook Salmon 2021 – Update 10/15/2021

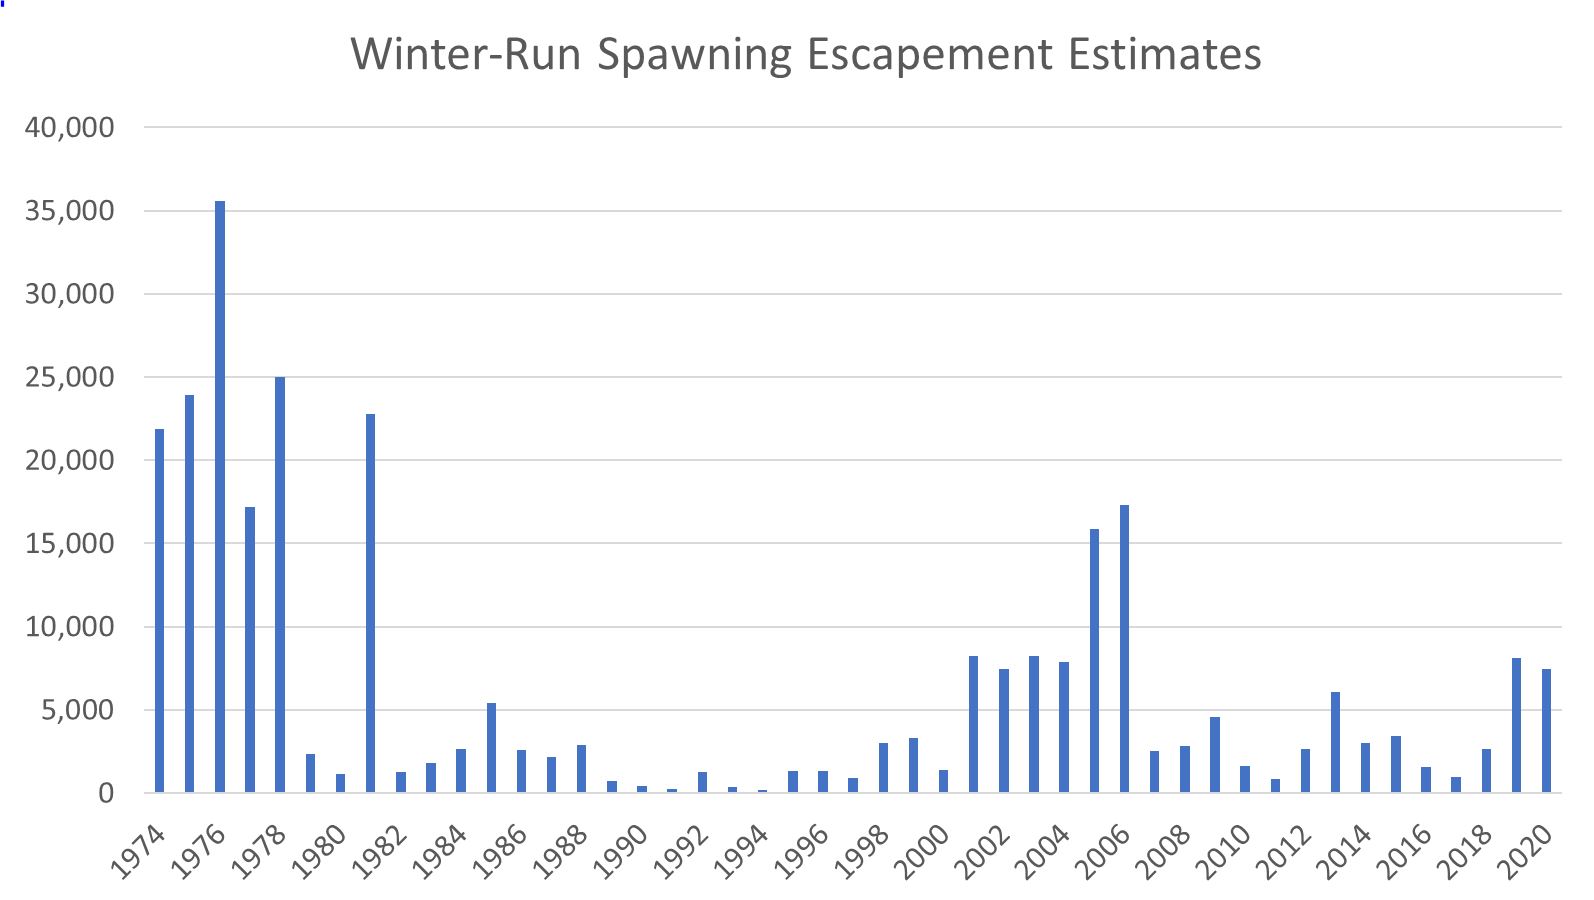
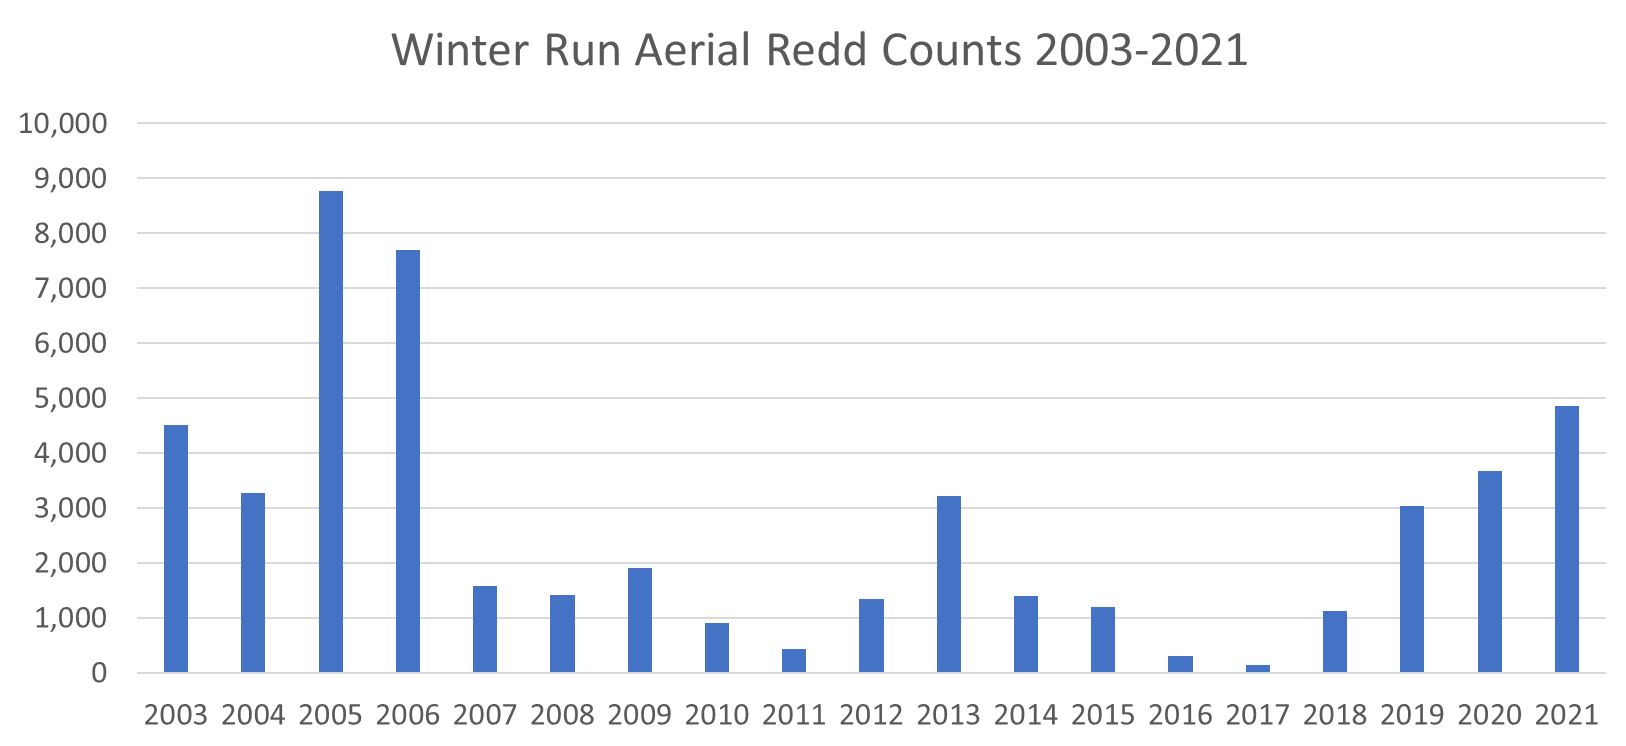
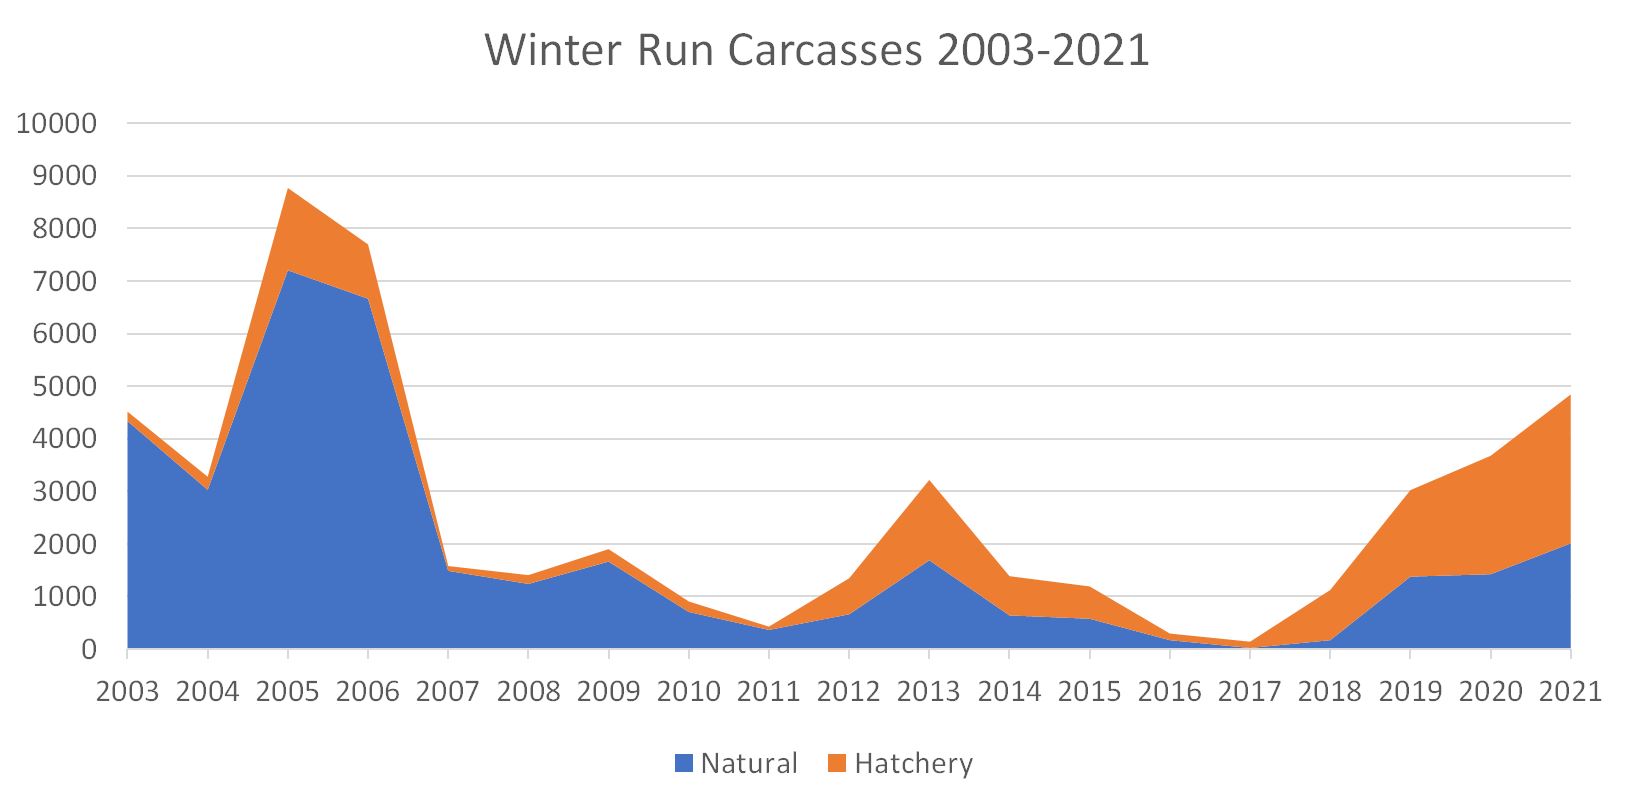
When I last updated the status of the winter-run salmon population of the upper Sacramento River in an April 2020 post, trends in spawning escapement indicated the population was recovering in 2018 and 2019 after the poor runs in 2016 and 2017. That trend continued in 2020 and 2021 (Figures 1-3). These recent runs benefited from wet years in 2017 and 2019, and near-normal 2018 that contributed to better natural egg and fry survival as well as hatchery smolt survival. The only negative trend in the adult escapement is the higher proportion of hatchery-produced adults in the recent year returns that reflects the enhanced hatchery efforts1 during and after the 2013-2015 drought. The prognosis for the 2022 run remains good, as 2019 was a wet year and 2020 was near normal. Both years had flow and water temperature much better than during the 2013-2015 drought.

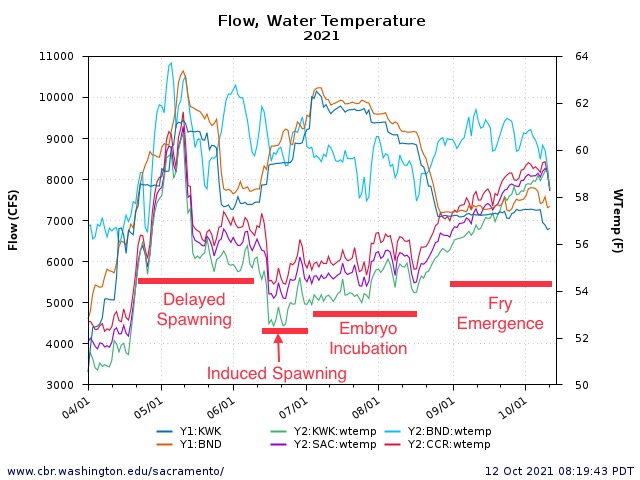
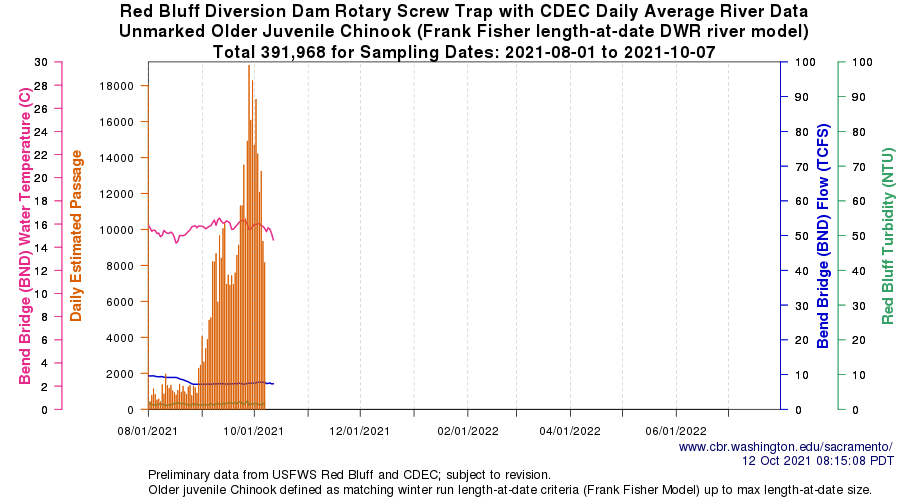
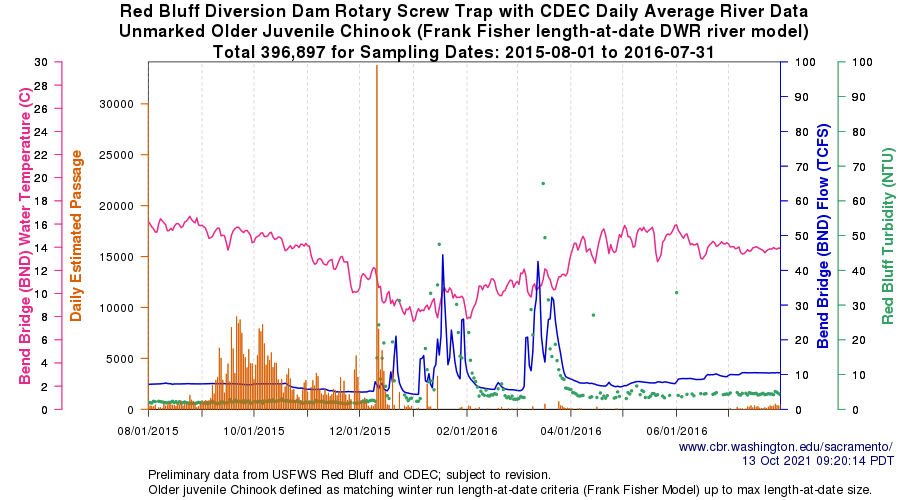
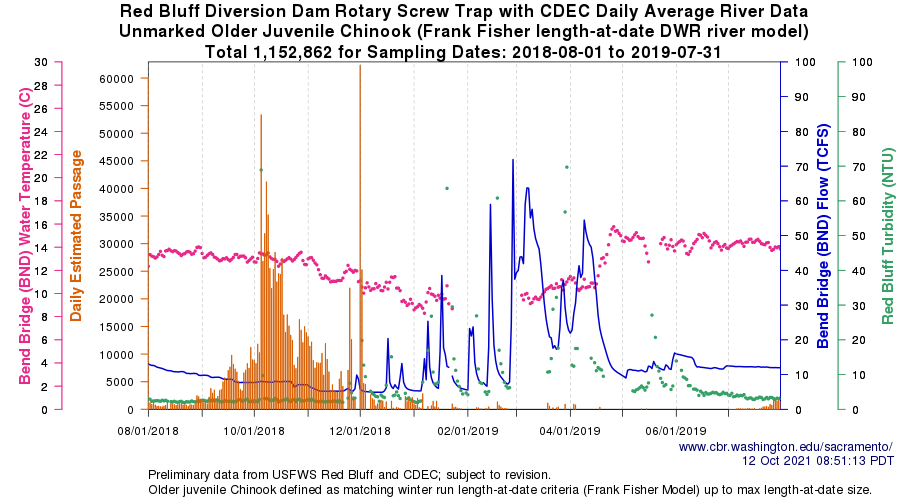
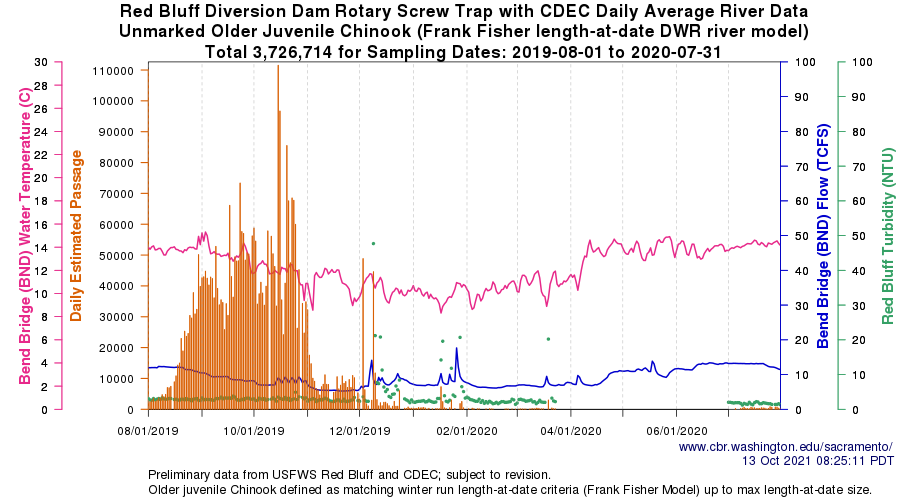
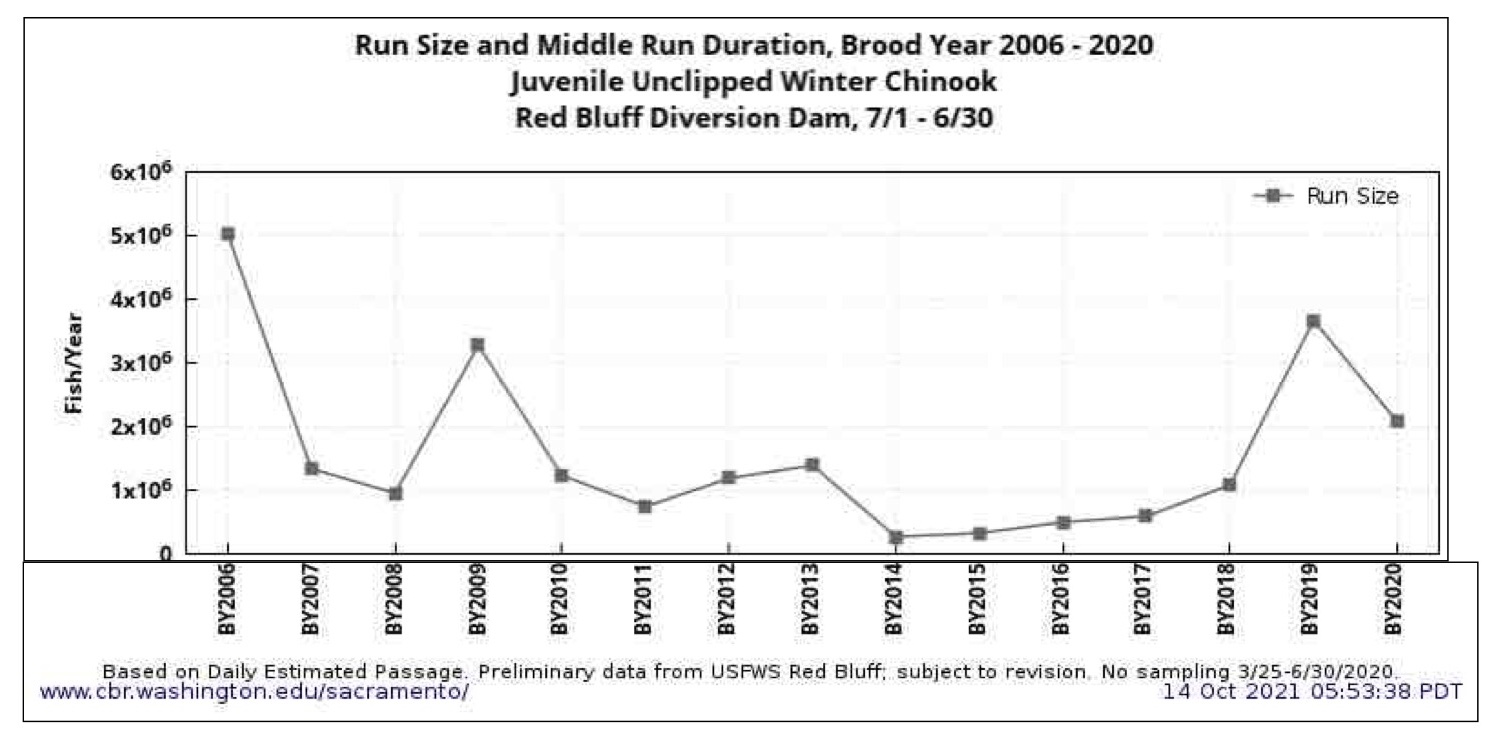
The prognosis for the 2023 and 2024 runs does not look as good, given the extreme drought conditions in 2021 that have likely limited survival of the 2021 brood year.2 Reclamation undertook unusual operations in 2021 in an attempt to maintain a modicum of winter-run egg and fry survival given the drought conditions (Figure 4). The first indicator of potential success is from screw trap collections at Red Bluff that indicate survival in 2021 has been better than 2015 but poorer than 2018 and 2019 (Figures 5-8). The screw trap collections also produce an end-of-season estimate of total passage (Figure 9), which is another way of summarizing these same data. These indices also show a post-drought recovery from 2018-2020, where 2021 brood-year production would likely fall back to a level below brood year 2018.

In a recent post, the Northern California Water Association (NCWA) expressed a more upbeat prognosis, although tempered by poor drought year 2021 conditions.

“To be sure, the dry and hot conditions in 2021 are not ideal for salmon nor any other part of the ecosystem that depends upon water and they are having challenging years. Yet, despite these dry and hot conditions, salmon are amazingly resilient and they: 1) have returned to the Sacramento Valley in record numbers; 2) will continue to spawn, and 3) are now beginning their journey down the river in large numbers. Importantly, there continues to be a concerted effort throughout the region to improve conditions for every freshwater life-cycle stage of all four runs of Chinook salmon.”

I generally agree on item 3, noting that “large numbers” are relative, as discussed above and shown by comparing the figures below. I do not agree with the other assertions. Much of the “record number” are hatchery fish, as also discussed above. And spawning conditions in the Sacramento River for the rest of the fall will be poor.

NCWA is one of the major users of Sacramento River water. High drought-year allocations of Shasta storage to NCWA users led to high spring demands on storage by NCWA water users (see Figure 4) and in part to the current near-record-low storage in Shasta Reservoir (Figure 10). Unless it rains and snows a considerable amount this winter, salmon and water users will be in dire straits next year.

Figure 1. Winter-run Chinook salmon escapement (run size) to the Sacramento River 1974-2020. (Source: CDFW)

Figure 2. Winter-run Chinook salmon annual aerial redd counts in the upper Sacramento River 2003-2021. (Source: CDFW)

Figure 3. Winter-run Chinook salmon annual carcass counts in the upper Sacramento River 2003-2021. (Source: CDFW)

Figure 4. Winter-run Chinook salmon spawning season conditions in the Sacramento River in 2021. River flows at Keswick Dam (KWK, rm 300) and Bend (BND, rm 250). Water temperatures KWK, BND, and Redding (SAC, rm 290; CCR, rm 280).

Figure 5. Juvenile winter-run salmon counts in Red Bluff screw traps 8/1-10/7, 2021.

Figure 6. Juvenile winter-run salmon counts in Red Bluff screw traps 8/1/15-8/1/16.

Figure 7. Juvenile winter-run salmon counts in Red Bluff screw traps 8/1/18-8/1/19.

Figure 8. Juvenile winter-run salmon counts in Red Bluff screw traps 8/1/19-8/1/20.

Figure 9. Estimated total passage past Red Bluff of unclipped (naturally produced) juvenile winter-run salmon for brood years 2006-2020.

Figure 10. Lake Shasta water level conditions in water year 2021-2022 and other water years, plus historical averages. Source: DWR-CDEC.