The Scott River Coho salmon population is one of the last remaining self-sustaining wild Coho salmon runs in California and in the Southern Oregon Northern California Coho (SONCC) Evolutionarily Significant Unit (ESU). The SONCC ESU is listed as “threatened” under the federal and California endangered species acts. The ESU includes the Rogue River in Oregon and the Klamath River in California.
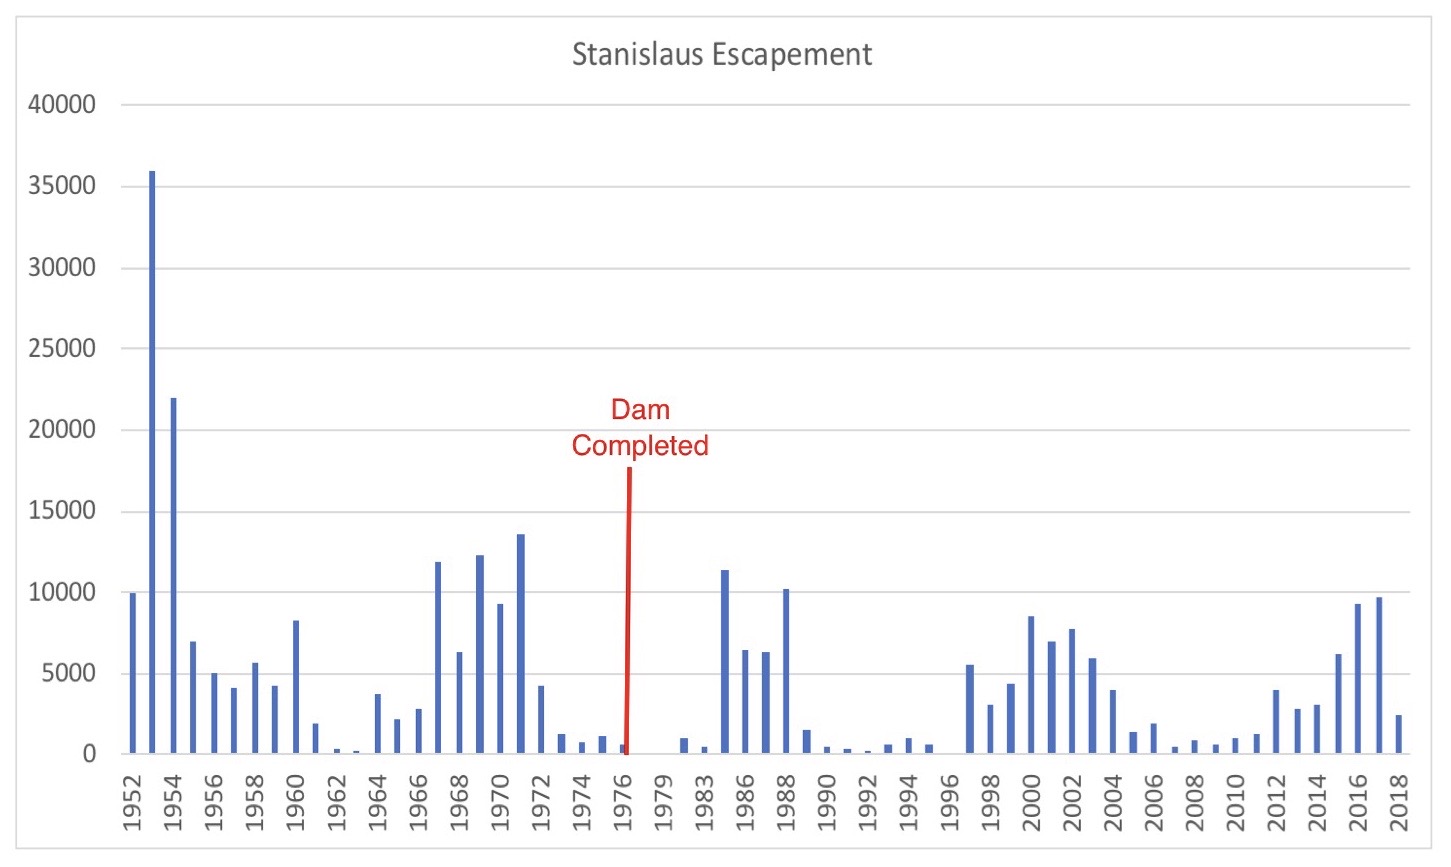
The Scott Coho run is the major wild Coho population in the Klamath River system. Scott Coho spawn and rear in Scott Valley, once called “Beaver Valley,” located near Fort Jones. The run has numbered over 1,000 adult Coho spawners as recently as 2013, but numbered less than 100 as recently as the 2008-09 drought years (Figure 1).
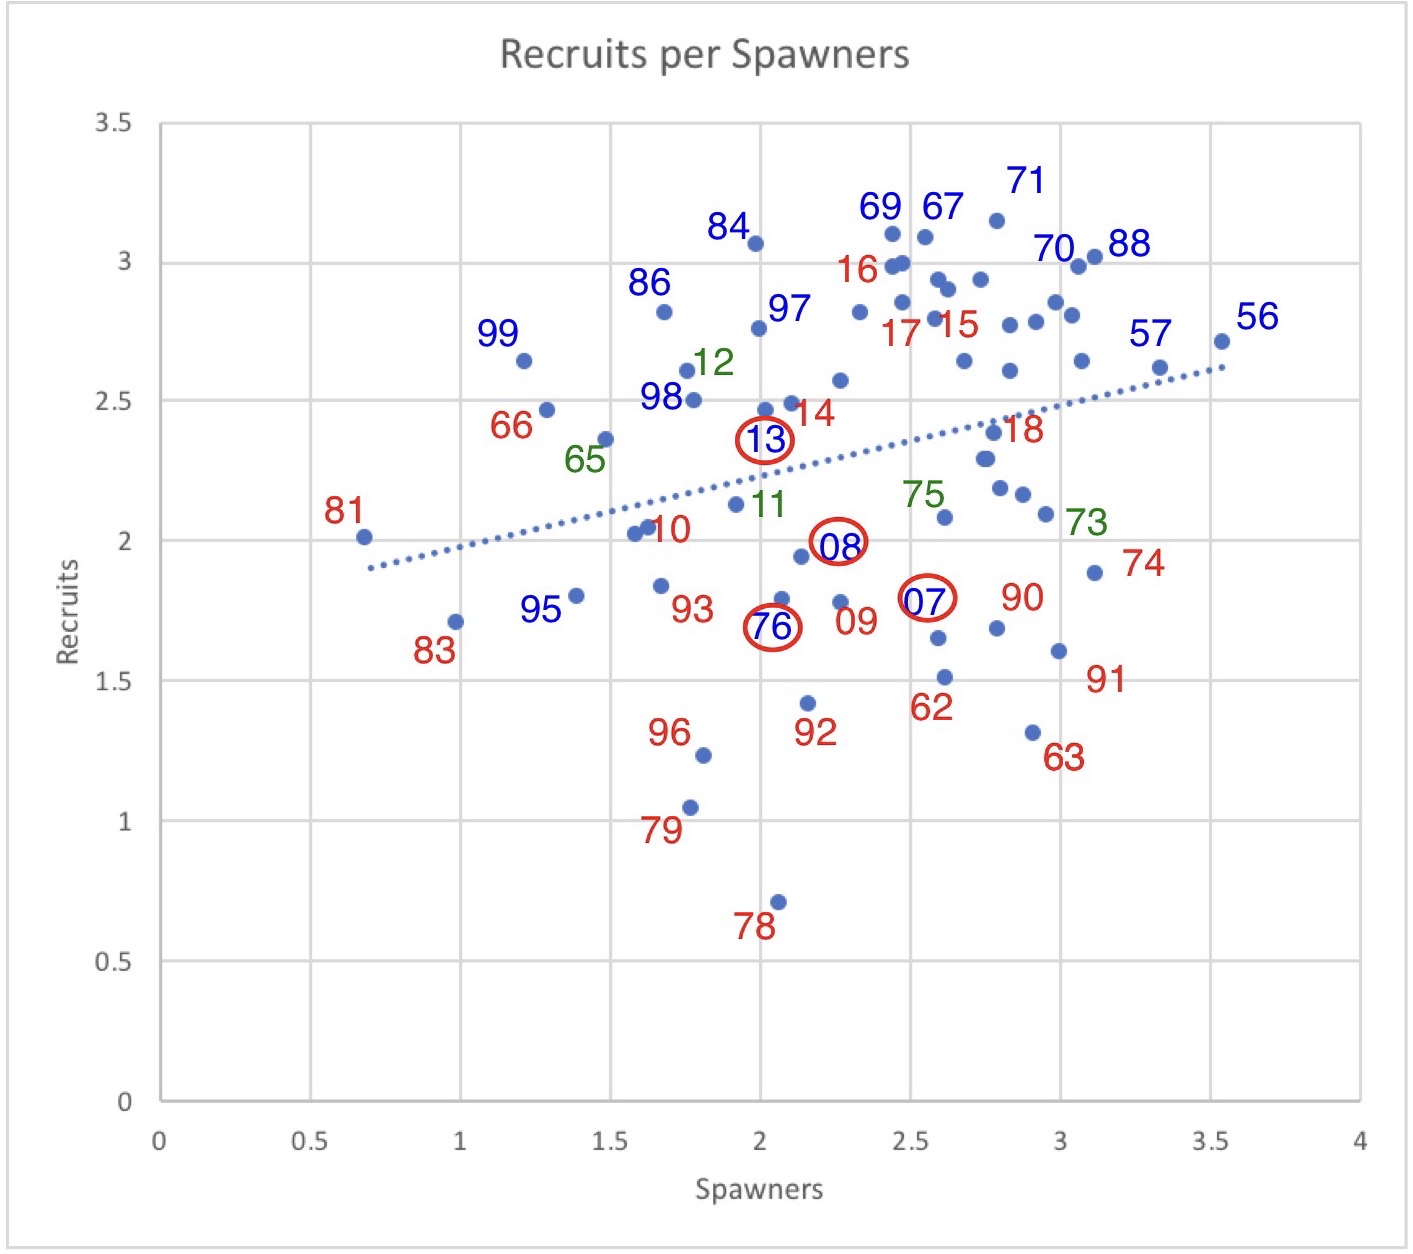
Scott Coho include three distinct sub-populations that have developed because the vast majority of spawners are three years old. One subgroup, the 2007-2010-2013 sub-group, dominated the population in the recent past, but declined sharply in 2016. The other two sub-groups have increased slightly since 2008 and 2009 lows.
The spawner-recruit relationship (Figure 2) shows a generally positive relationship between the number of spawners and recruits three years later for each sub-group and the overall population with one distinct outlier (the sharply lower 2016 run). So why was the 2013 run so high and the brood-year 2013 run in 2016 so poor?
1. 2013’s Good Run
The 2013 run (brood year 2010) got off to a great start in wet water year 2011. Flows for the fall 2010 spawning run were good from November through January [Figure 3), which ensured spawner access and good spawning conditions throughout Scott Valley. Flows were also good through the spring and fall of 2011 (Figure 4), ensuring good smolt production and a subsequent strong run in 2013.
2. 2016’s Poor Run
The strong run in 2013 spawned in brood year 2013, which got off to a rocky start in dry water year 2013-14. Flows in fall-winter 2013-14 encountered by the strong 2013 run were very low through the early winter spawning season (Figure 5), leading to an unusually protracted run of adult spawners (Figure 6) and poor accessibility to good spawning areas. Spawning habitat quality and quantity likely also suffered from low flows. Flows were then very low from spring through fall of 2014 (Figure 7), likely resulting in poor over-summer survival and low smolt production for brood year 2013.
In conclusion, the Scott Coho salmon population continues to suffer from low seasonal streamflow, especially in drought years like water year 2013-14. The population would benefit from improved summer-through-fall streamflows. It will also benefit from the watershed habitat restoration actions being implemented by landowners, CalTrout, the Scott River Watershed Council, Siskiyou RCD, Scott River Water Trust, California Department of Fish and Wildlife, Quartz Valley Indian Reservation, and other stakeholders.
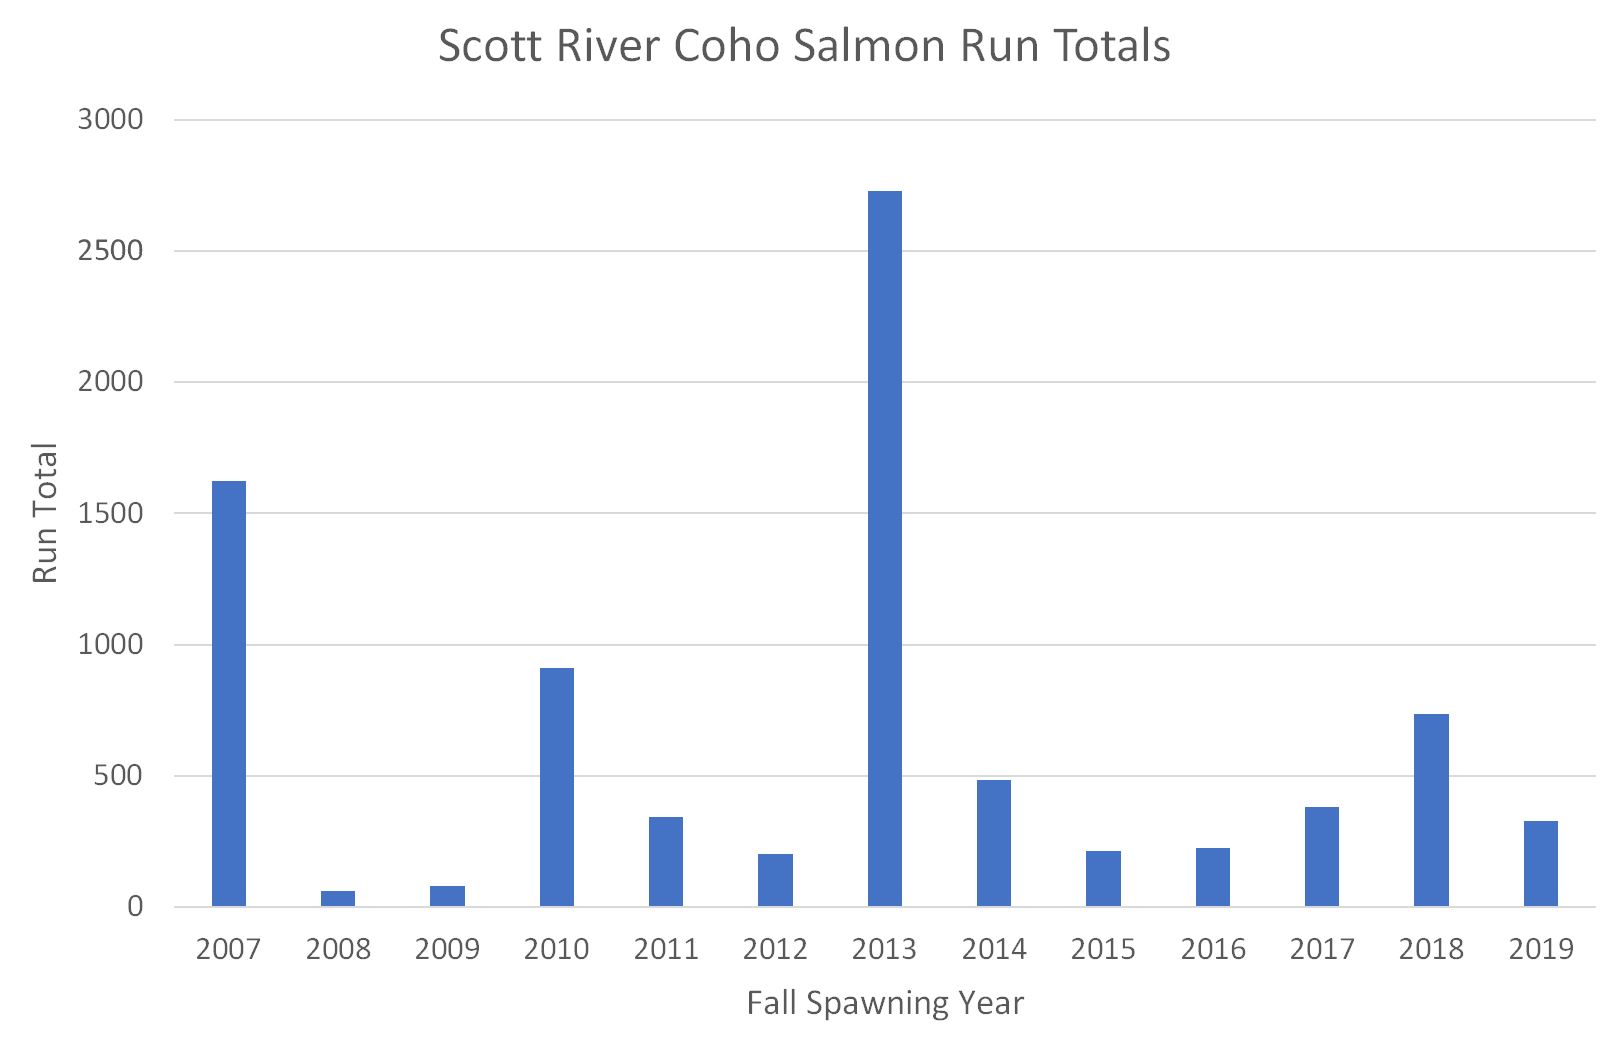
Figure 1. Escapement of adult Coho salmon to the Scott River from 2007 to 2019. Data source: CDFW, Yreka, CA.
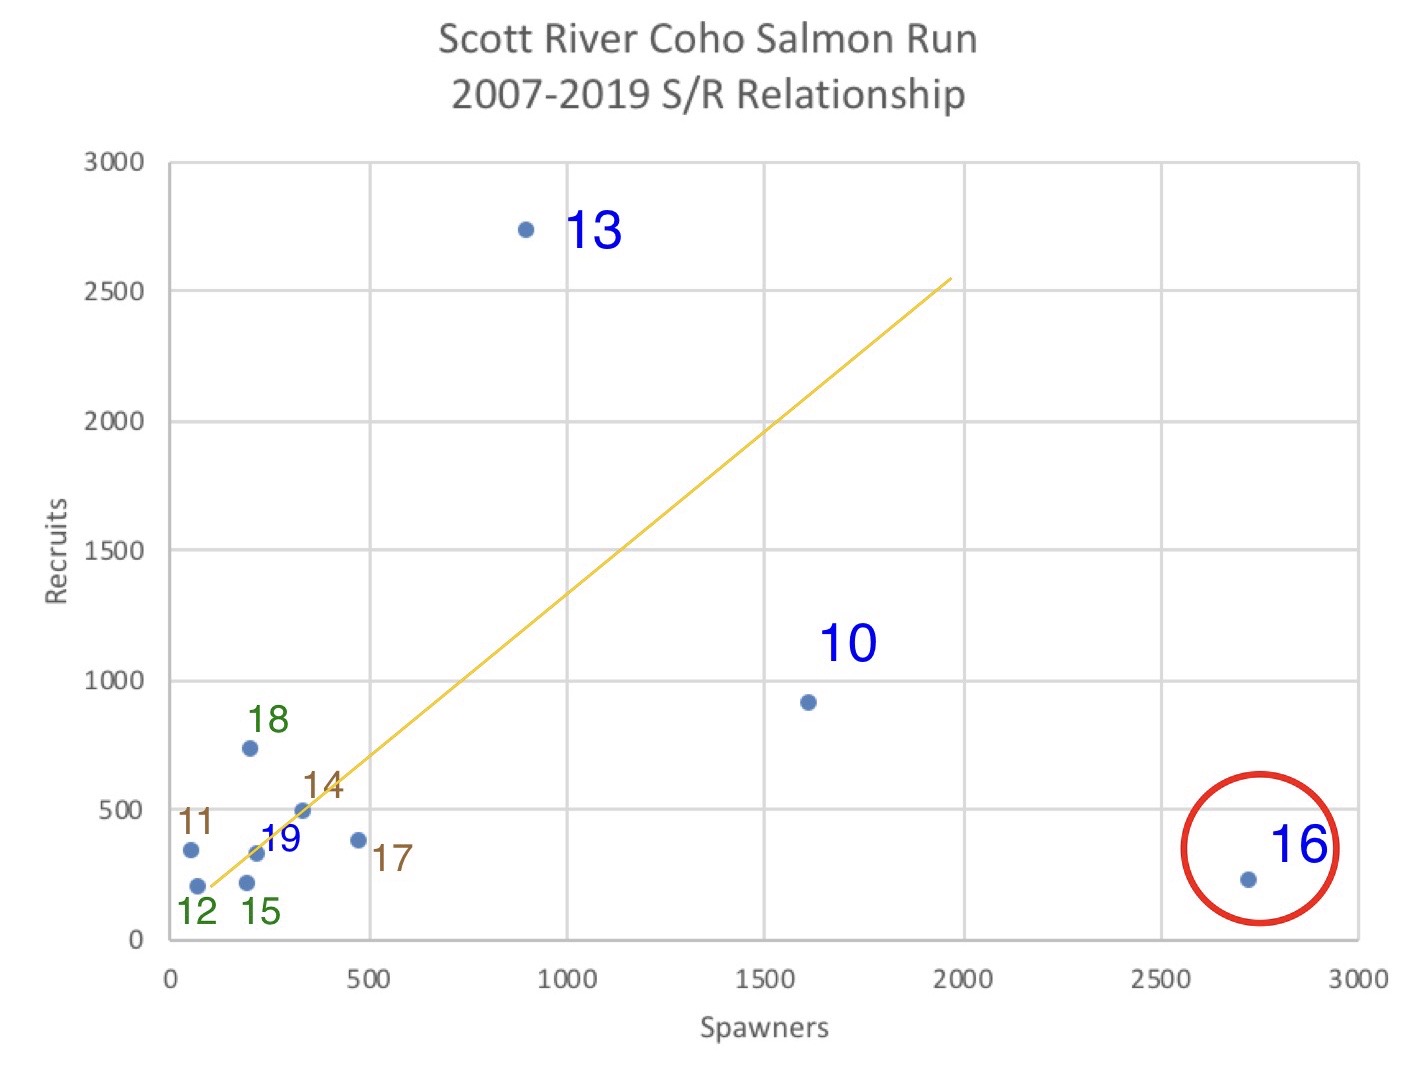
Figure 2. Spawner-recruit relationship for Scott River Coho salmon. The number represents recruits (spawner counts) for that year versus spawners counts from three years earlier. For example: “13” represents spawner counts (recruits) in fall 2013 versus spawner numbers three years earlier in 2010. Number color represents different spawner subgroups (blue=subgroup 10-13-16-19). The Red circle highlights significant outlier in 2016. The Yellow line is trend-line for years other than 2016.
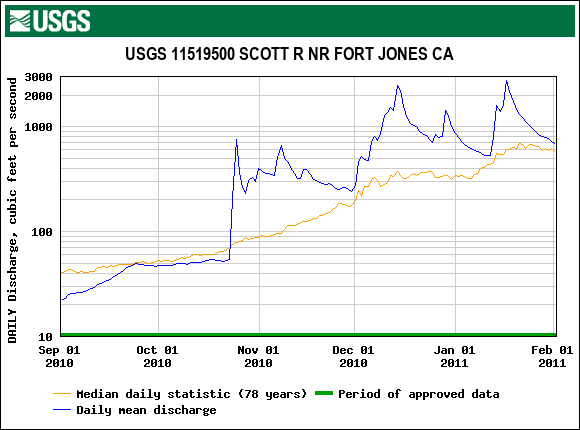
Figure 3. USGS gaged daily average flow (log scale) in lower Scott River, Klamath River tributary, 9/1/2010-2/1/2011, with 78 year average daily median flow for that date.
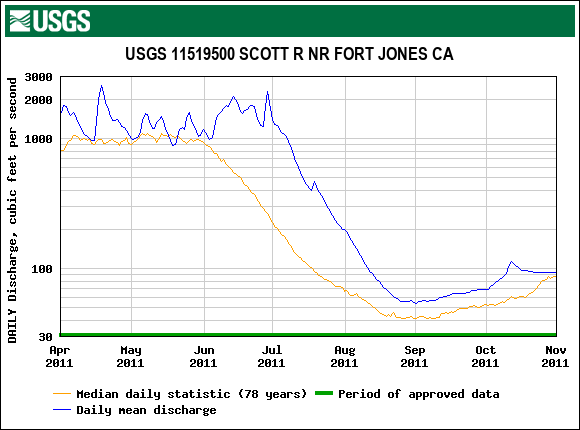
Figure 4. USGS gaged daily average flow (log scale) in lower Scott River, Klamath River tributary, 4/1/2011-11/1/2011, with 78 year average daily median flow for that date.
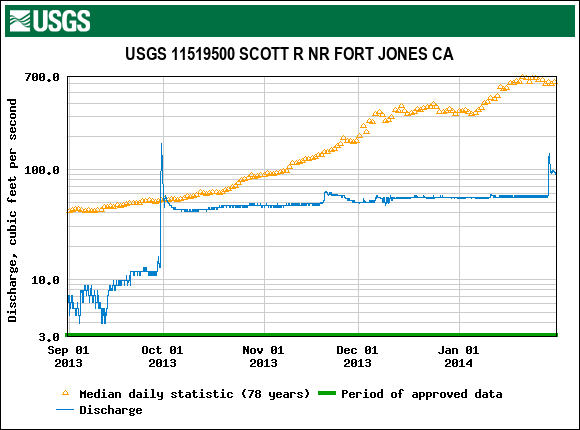
Figure 5. USGS gaged daily average flow (log scale) in lower Scott River, Klamath River tributary, 9/1/2013-2/1/2014, with 78 year average daily median flow for that date.
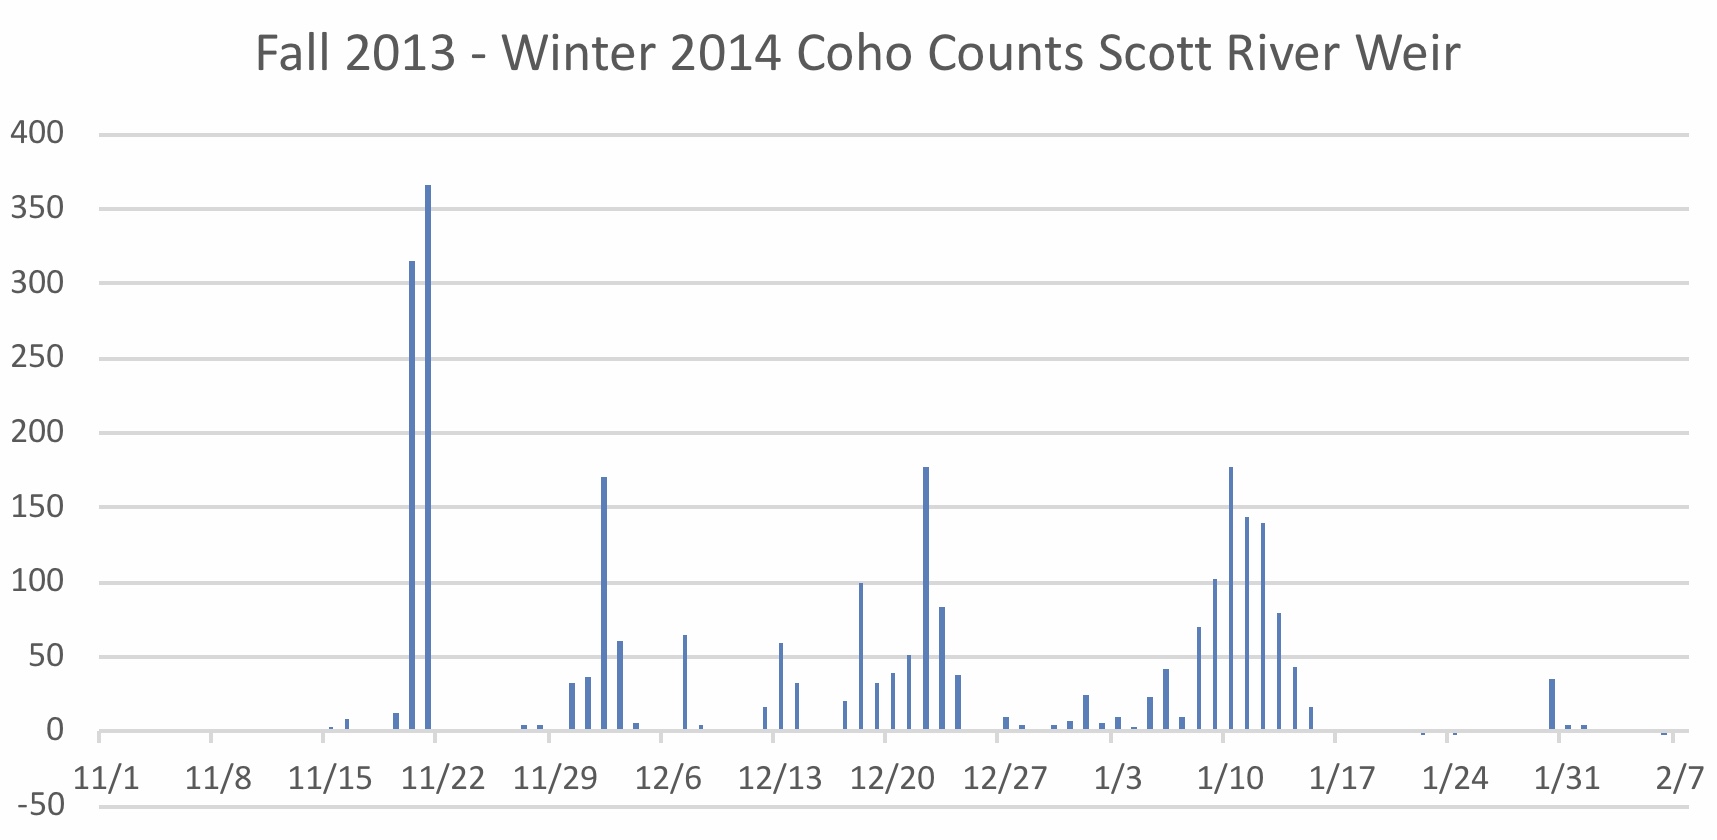
Figure 6. Scott River adult salmon collection weir counts of Coho salmon for fall-winter 2013-14. Data source: CDFW Yreka, CA.

Figure 7. USGS gaged daily average flow (log scale) in lower Scott River, Klamath River tributary, 4/1/2014-10/31/2014, with 78 year average daily median flow for that date.