The Delta Plan – where is the water habitat?

The Delta Stewardship Council’s Jessica Davenport, Program Manager, Ecosystem Restoration and Land Use, released an issue paper in August of last year entitled “Restoring Habitat with Science and Society in Mind”. 1

“The Delta Plan shall include measures that promote all of the following characteristics of a healthy Delta ecosystem:

  1. Viable populations of native resident and migratory species.
  2. Functional corridors for migratory species.
  3. Diverse and biologically appropriate habitats and ecosystem processes.
  4. Reduced threats and stresses on the Delta ecosystem.
  5. Conditions conducive to meeting or exceeding the goals in existing species recovery plans and state and federal goals with respect to doubling salmon populations.”

The Delta Plan,2 much like the Governor’s Bay Delta Conservation Plan (BDCP),3 has no measures that would promote a healthy Bay-Delta ecosystem. The plans virtually ignore water habitat: the characteristics of the water in the hundreds of miles and tens of thousands of acres of open water in the Bay-Delta. The plans fail to even define the components of a healthy ecosystem or how they relate to water habitat:

  • “viable populations” – what constitutes viable?
  • “functional corridors” – what is functional?
  • “appropriate habitats and ecosystem processes” – what is appropriate?
  • “threats and stresses” – what threats and stresses?
  • “conditions conducive to doubling salmon populations” – what conditions?

The plans simply focus on “restoration” of thousands of acres of edge habitat on marginal lands in Suisun Marsh and the Delta, virtually ignoring the “real problem” and its fixes. The “restoration” that is promoted will take decades to implement and will do little to promote a healthy ecosystem, at least in the short term.

The “real problem” is water management in the Central Valley and Bay-Delta. The “real problem” is our insatiable demand for water while virtually ignoring the beneficial uses and public trust requirements of the Central Valley and Bay-Delta ecosystems. There are water quality standards and endangered species biological opinions that provide minimal protections for resident and migratory native fish species. Yet the first thing that regulators do in droughts is relax these protections to provide more water for agriculture. As a consequence, the fish populations and their habitats suffer irreversibly in drier years, and especially in extended periods of drought. The result is fish populations on the verge of extinction, poor Bay-Delta water quality, salt in Delta water diversions, salmon smolts having to be trucked hundreds of miles from hatcheries to the Bay, and no freshwater inflow to the San Francisco Bay estuary.

Water is the ecosystem process ignored in the BDCP and Delta Plan. The characteristics of the water habitat in time and space are the missing element in the plans. The fish habitat that is most important is the water in Delta channels and bays, not the acreage of tidal marsh. Adding tidal marsh habitat will not fix the water habitat or provide a healthy ecosystem

The BDCP justified taking more water via the “tunnels” by offering thousands of habitat acres in return. The Delta Plan promotes these same land acreage solutions.

How can we really restore the Delta as habitat for smelt, salmon, steelhead, sturgeon, and other native fishes? We have to focus on Delta inflows, outflows, tides, and exports: hydrology, salinity, water temperature, and primary productivity patterns in the water habitat. The real habitat of the Delta is the three-dimensional characteristics of water in time and space. What should the water habitat be for Delta smelt when they hatch in the spring to insure good survival? How do we sustain the smelt in summer? Can they actually survive if all the Delta inflow is exported in August under relaxed standards? What happens to all the wild salmon smolts coming out of Central Valley rivers? What kind of water habitat do they need to pass through the Delta? They do not get a truck ride to and around the Delta. What is a “functional migration corridor” for them?

So instead of focusing on acreage, we should focus on the real habitat, water and all of its characteristics in time and space in the Delta, rivers, and the Bay. That way, we can promote the real ecosystem process that provides for a healthy Bay-Delta ecosystem.

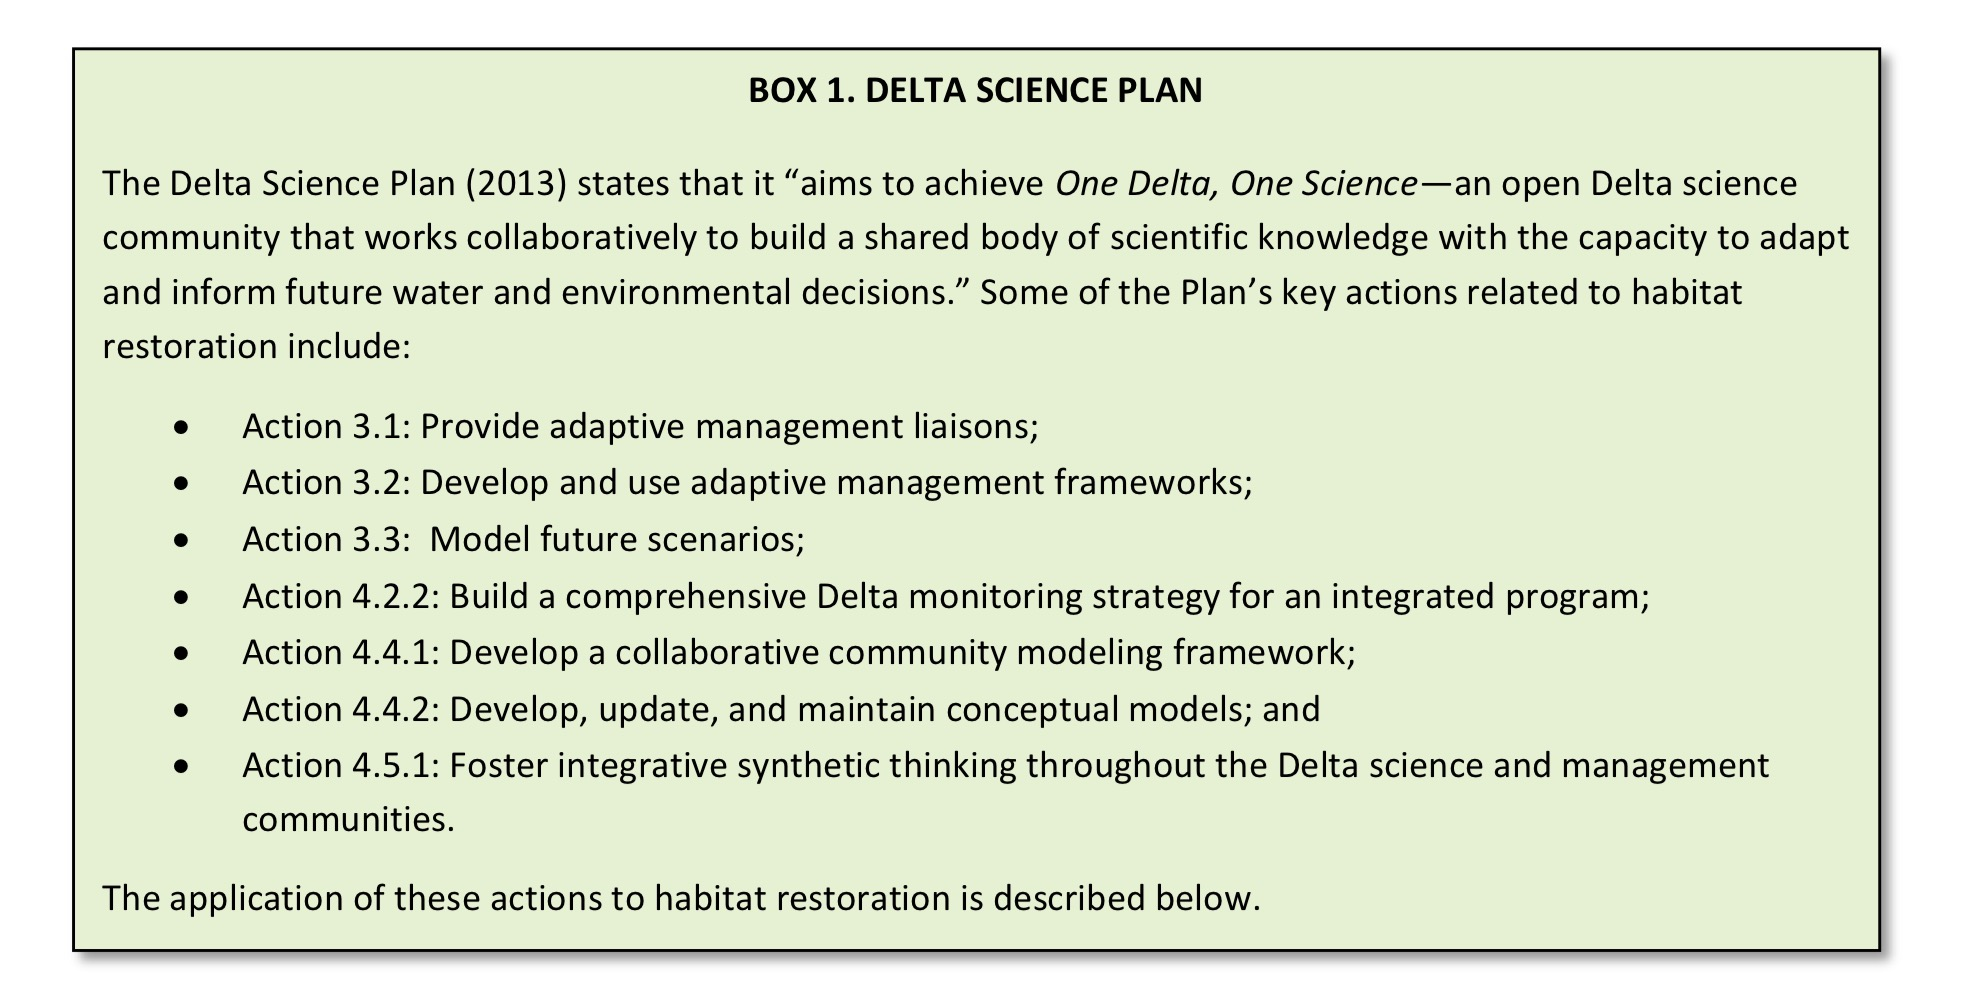
The Delta Science Plan4 is just more talk and smoke and mirrors. What the Delta needs is more water and better water habitat. We do not need a new vision.

http://calsport.org/fisheriesblog/wp-content/uploads/2015/04/Box-1.-Delta-Science-Plan.png

What is wrong with NDOI?

Delta outflow is the amount of fresh water that exits the Delta for San Francisco Bay. Freshwater outflow is the most important ecological function other than perhaps the tides for the Bay-Delta Estuary. The Net Delta Outflow Index (NDOI) is the parameter that is used as a measure of Delta outflow to manage the ecology, water supply, and water quality of the San Francisco Bay-Delta Estuary. NDOI is a number estimated from a crude set of variables, some measured and some guessed. It is a relic of the past and deserves a quiet burial, the sooner the better. Continuing its use is meaningless, unreasonable, harmful, injurious, and unnecessary.

The NDOI or QOUT is calculated as follows:

QOUT = QTOT + QPREC – QGCD – QEXPORTS – QMISDV1

Where:

  • QOUT Net Delta outflow at Chipps Island
  • QTOT Total Delta inflow
  • QPREC Delta precipitation runoff estimate
  • QGCD Delta-wide gross channel depletion estimate (consumptive use)
  • QEXPORTS Total Delta exports and diversions/transfers
  • QMISDV flooded island and island Storage diversion

All of these parameters are estimates themselves subject to gross errors, which compound to make NDOI useful only as a gross indicator of freshwater outflow to San Francisco Bay.

The main use of NDOI is in Bay-Delta water quality standards and drought emergency change orders:

“ The Delta outflow objectives included in the Bay-Delta Plan and D-1641 for the February through June time frame are identified in footnote 10 of Table 3 and Table 4 of footnote 10. Pursuant to footnote 10, the minimum daily NDOI during February through June is 7,100 cfs calculated as a 3-day running average. This requirement may also be met by achieving either a daily average or 14-day running average EC at the confluence of the Sacramento and San Joaquin Rivers of less than or equal to 2.64 millimhos per centimeter (mmhos/cm) (Collinsville station C2)… The minimum Delta outflow levels specified in Table 3 are modified as follows: the minimum Net Delta outflow Index (NDOI) described in Figure 3 of Decision 1641 during the months of February and March shall be no less than 4,000 cubic-feet per second (cfs) on a monthly average. The 7-day running average shall not be less than 1,000 cfs below the monthly average.”2

Reliance on NDOI is one thing, but using 3-day, 7-day, and monthly average limits borders on insidious. Government agencies have long recognized this and a decade ago commissioned the US Geological Survey to measure Delta outflow with UVM meters that measure water column velocities in real time.
.
The new measurement is defined as Net Delta Outflow or NDO3.

Net Delta Outflow

We compared the two parameters for the month of March, 2015. The differences in the parameters as seen in the chart below are significant and appear to be related to the fact that NDOI does not incorporate tidal effects. NDO indicates that outflow is much reduced by high “spring” tides that effectively block freshwater outflow to the Bay. The effect is real and roughly amounts to over 100,000 AF of freshwater flow that did not make it to the Bay in March, which resulted in greater saltwater intrusion and degradation of the Bay-Delta Estuary, as well as degradation of Low Salinity Zone habitat quality and quantity.

March 2015 NDO vs NDOI

The effect also leads to saltwater intrusion into the central Delta via False River. Delta exports pull some of their water from the west Delta to the south Delta pumping plants via False River. The chart below shows higher salinity water entering False River during high tides with peaks in salinity during spring tides and low NDOs. The salt from these intrusions degrades Delta water quality and the quality of water exported from the Delta to Southern California. The salt is also a signature of the Low Salinity Zone, which is the primary nursery area for Delta Smelt, Longfin Smelt, and many other Delta fish. Pulling LSZ water into the central Delta kills many Longfin and Delta smelt.

False River

It is no longer reasonable to manage Delta outflow and exports with rules that include the NDOI. A vast array of flow, salinity, temperature, turbidity, chlorophyll, dissolved oxygen, and radio-tagged fish detection meters allow instantaneous management of the Delta. Changes are hung up on antiquated Delta standards that are frequently relaxed by the State Water Resources Control Board to satisfy the insatiable water demands of the state and federal water projects and their contractors. The NDOI needs a quick burial. If the Board can issue temporary drought emergency change orders involving the NDOI, why can’t it rely on better measurement to better protect, if only temporarily, the beneficial uses of the state’s water supply?

  1. Source:  http://www.water.ca.gov/dayflow/ndoVsNdoi/
  2.  Source: SWRCB March 5 Temporary Urgency Change Order for Central Valley Project and State Water Project
  3.  http://www.water.ca.gov/dayflow/ndoVsNdoi/

Are Longfin Smelt Going Extinct?

long fin smelt

Longfin Smelt are a native Bay-Delta fish and are listed under the California Endangered Species Act as “threatened”. Like the Delta Smelt, Longfin have undergone dramatic declines over the past several decades starting with the 1987-92 drought, then the 2001-2005 dry period, the 2007-09 drought, and the most recent 2012-15 drought (Figure 1). A strong recovery occurred in the wet years of 1995-2000. Modest recoveries occurred in 2006 and 2011 (wet years).

The Winter Kodiak Trawl Survey of adult Longfin Smelt provides the first clue as to how the population is faring in the 2015 drought after the second lowest fall index on record. The number of adult Longfin captured in the three winter surveys (Jan-Mar) are low but not unlike other low abundance years in the past decade (Figure 2).

Another indicator is results of the Smelt Larval Survey. The abundance and distribution of larvae in the Bay-Delta is representative of spawning success and potential of this year’s production to contribute to the population. So far in March 2015, survey capture densities have been generally below 100 per 1000 cubic meter sampled (Figures 3 and 4). These densities were slightly lower than for the same surveys in 2014 (Figures 5 and 6). Much higher densities occurred in years 2009-2013 (not shown).

The Juvenile or 20-MM Smelt Survey is another indicator of how Longfin Smelt are faring. Its first survey was recently completed (Figure 7), and the densities are again down from 2014 (Figure 8). Densities in 2014 and 2015 are again significantly lower than in surveys over the previous decade (not shown).

Based on these trends, we can expect another poor recruitment year, perhaps even a record low Fall Index. The population was able to rebound after low Fall indices in 1992 and 2007. It remains to be seen whether the population can rebound after declining since 2006 and after record low numbers of larvae and juveniles in 2014 and 2015. As in 2014, water quality standards for Delta outflow and exports, as well as salinity, have been relaxed, which will further stress the population toward possible extinction. This “canary in the coal mine” for the San Francisco Bay-Delta Estuary, like the Delta Smelt, remains on “life support”.

We will keep you posted as to how the year progresses for Longfin Smelt. To keep up to date on upcoming surveys, check out CDFW’s web site. (https://www.dfg.ca.gov/delta/data/)

Longfin Smelt Fall Midwater Trawl Index – 1967-2013.

Figure 1. Longfin Smelt Fall Midwater Trawl Index – 1967-2013. The 2014 Index was 16. (CDFW data)

Figure 2.  Catch of adult Longfin Smelt in Winter Kodiak Trawl Survey, Jan-Mar 2015.

Figure 2. Catch of adult Longfin Smelt in Winter Kodiak Trawl Survey, Jan-Mar 2015.

Figure 3.  Longfin Smelt catch distribution in Smelt Larval Survey #5,  early March 2015.  (CDFW data summary)

Figure 3. Longfin Smelt catch distribution in Smelt Larval Survey #5, early March 2015. (CDFW data summary)

Figure 4.  Longfin Smelt catch distribution in Smelt Larval Survey #6,  late March 2015. (CDFW data summary)

Figure 4. Longfin Smelt catch distribution in Smelt Larval Survey #6, late March 2015. (CDFW data summary)

Figure 5.  Longfin Smelt catch distribution in Smelt Larval Survey #5,  early March 2014.  (CDFW data summary)

Figure 5. Longfin Smelt catch distribution in Smelt Larval Survey #5, early March 2014. (CDFW data summary)

Figure 6.  Longfin Smelt catch distribution in Smelt Larval Survey #6,  late March 2015.  (CDFW data summary)

Figure 6. Longfin Smelt catch distribution in Smelt Larval Survey #6,
late March 2015. (CDFW data summary)

Figure 7.  Longfin Smelt catch distribution in 20-mm Survey #1,  mid March 2015.  (CDFW data summary)

Figure 7. Longfin Smelt catch distribution in 20-mm Survey #1, mid March 2015. (CDFW data summary)

Figure 8.  Longfin Smelt catch distribution in 20-mm Survey #1,  mid March 2014.  (CDFW data summary)

Figure 8. Longfin Smelt catch distribution in 20-mm Survey #1, mid March 2014. (CDFW data summary)

Are Delta Smelt Going Extinct?

Recently Dr. Peter Moyle (UC Davis) suggested we “prepare for the extinction of delta smelt”1. Record low summer and fall abundance indices in 2014 following declines over the past decade in the key survey indices have led to major concerns about the future of this endangered species. The first three survey of this winter’s trawl survey brought record lows for January and March (Figure 1). Dr. Moyle and many others are particularly concerned with the March catch of only six adult smelt.

Winter Kodiak Trawl Survey, Delta Smelt Adults

Figure 1. Catch statistics from Winter Kodiak Trawl Survey Jan-Mar 2002-2015. (CDFW data)

Will the record low numbers of Delta Smelt adults be sufficient to bring some recovery when the rains come again as in 2010 and 2011, the last two years with abundant rain and snow before the present drought? As Dr. Moyle pointed out, it is too early to tell. March larval smelt surveys in 2010 and 2011 captured few larvae, as have larval surveys so far this March. This year is different in that the present drought continues whereas the previous drought ended in 2010 and 2011.

Will another year of drought spell disaster for the smelt? That very well may be the case if the State Water Resources Control Board accepts the recent Temporary Urgency Change Petition submitted by the US Bureau of Reclamation and the California Department of Water Resources to change Delta water quality standards. The petition requests relaxation of Delta inflow, outflow and salinity standards, all of which are designed to protect water quality and Delta fish and their habitats, in order to sustain water deliveries to water contractors during the present drought. The changes will undoubtedly lead to higher losses of smelt and further degradation of their freshwater and low-salinity habitat, which could lead to even sharper declines than those apparent during the present and previous droughts. Stay tuned, as we will be keeping close track of events and the Delta Smelt, as well as preparations for their possible extinction.