Welcome to the California Fisheries Blog

The California Sportfishing Protection Alliance is pleased to host the California Fisheries Blog. The focus will be on pelagic and anadromous fisheries. We will also cover environmental topics related to fisheries such as water supply, water quality, hatcheries, harvest, and habitats. Geographical coverage will be from the ocean to headwaters, including watersheds, streams, rivers, lakes, bays, ocean, and estuaries. Please note that posts on the blog represent the work and opinions of their authors, and do not necessarily reflect CSPA positions or policy.

More on Sacramento River Salmon Declines Reclamation did what it had to do in water years 2010 to 2012, but not in 2016-2018.

With poor salmon runs from 2009 to 2011, Reclamation provided good conditions in the lower Sacramento River below Shasta Reservoir in spring-summers of 2010 to 2012 for fall-run and winter-run salmon. That effort contributed to recovery of fall-run salmon from the 2007-2009 drought in 2012-2014 (Figure 1). The sequence of below-normal, wet, and below-normal water years (2010-2012) provided sufficient water for good smolt survival, overcoming a significant deficit of adult spawners (eggs spawned). Poor conditions in the subsequent drought of 2013-2015 led to the latest fall-run collapse in 2016-2017.1

So did Reclamation provide good spring-summer conditions in the lower Sacramento River in below-normal, wet, below-normal water year sequence 2016-2018 to help recovery from the latest drought? No. As a result, we can now expect poor runs in 2019 and 2020 instead of a recovery.

2010-2012

Reclamation made a concerted effort in 2010-2012 to meet water temperature objectives in the upper river near Red Bluff (Bend, Balls Ferry, and Red Bluff) and the lower river near Sacramento (Wilkins Slough, Verona). The 56°F and 68°F water temperature objectives for the upper and lower river, respectively, were regularly met (Figures 2-4) in spring and summer.

2016-2018

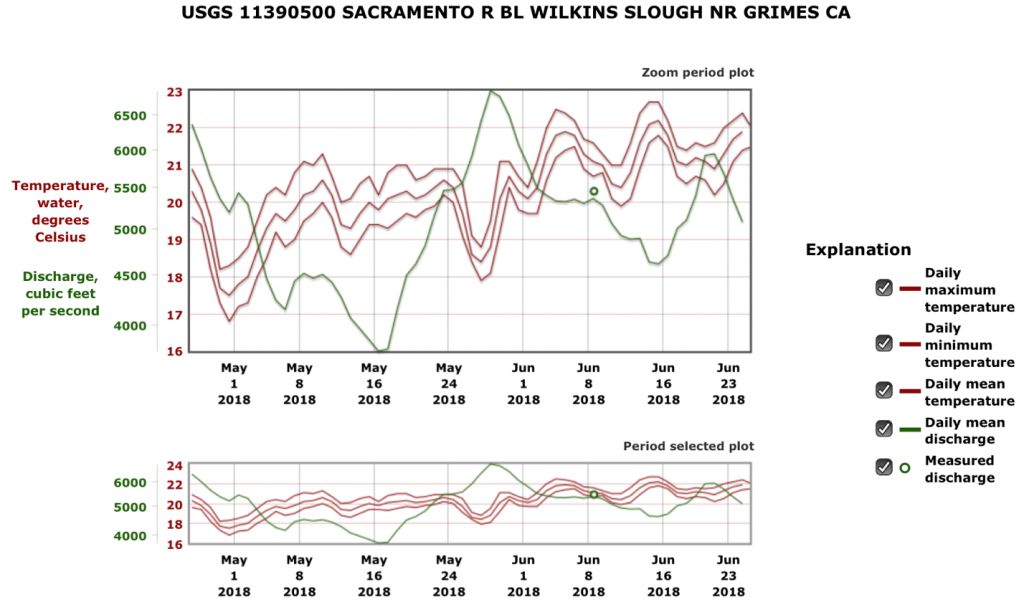
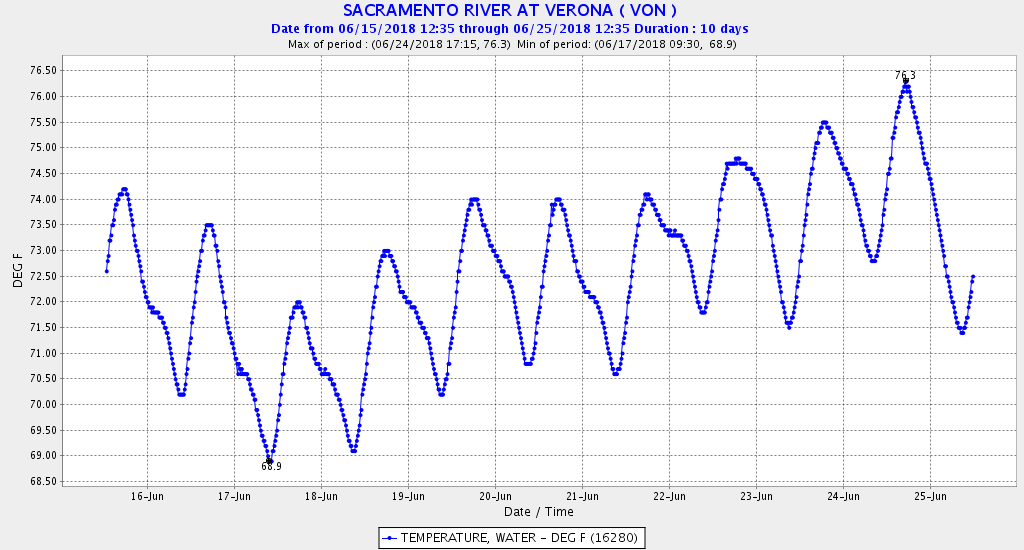
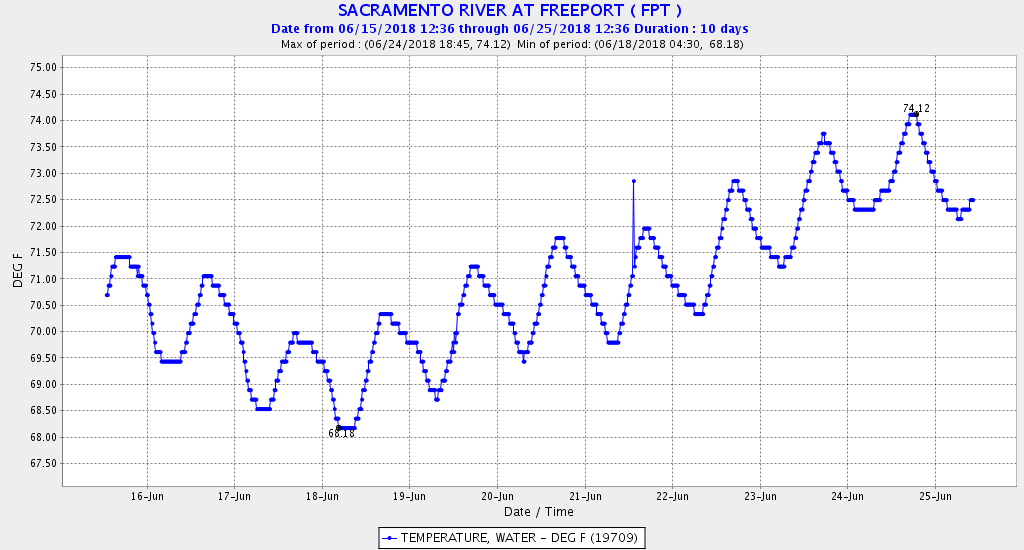
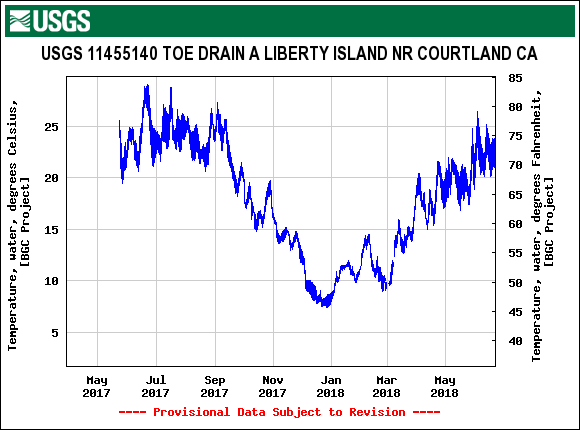
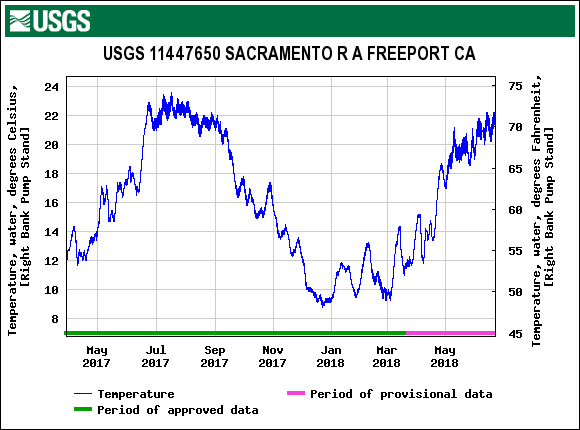
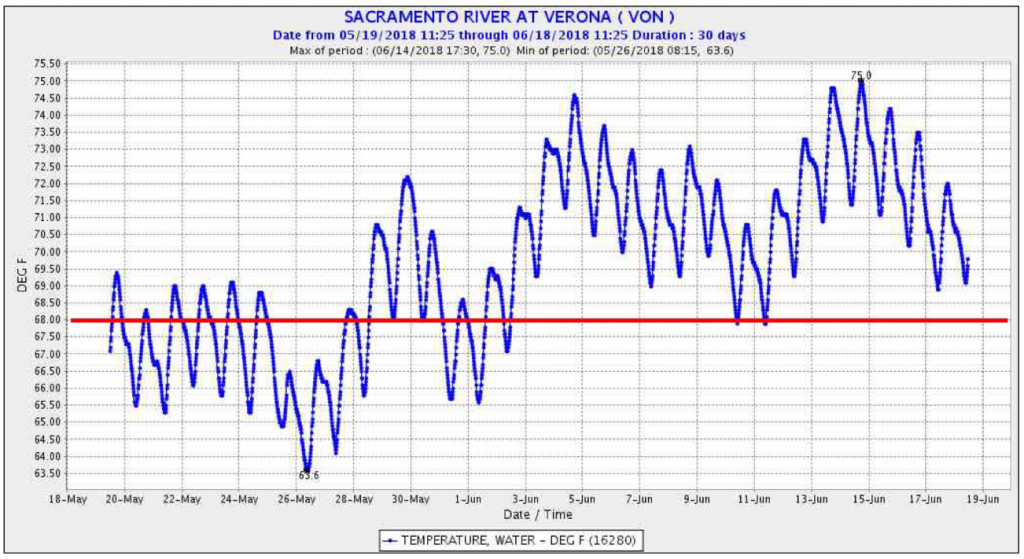
In a less than concerted effort in 2016-2018, Reclamation has failed to meet the water temperature objectives more often and with greater discrepancies (Figures 5-7). More detail on the failure is provided in a recent post.

Problem and Solution

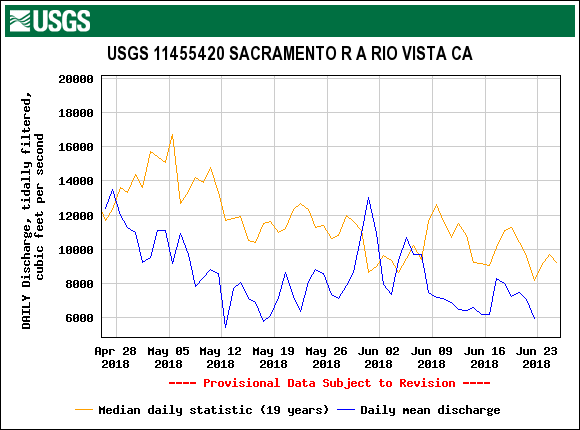
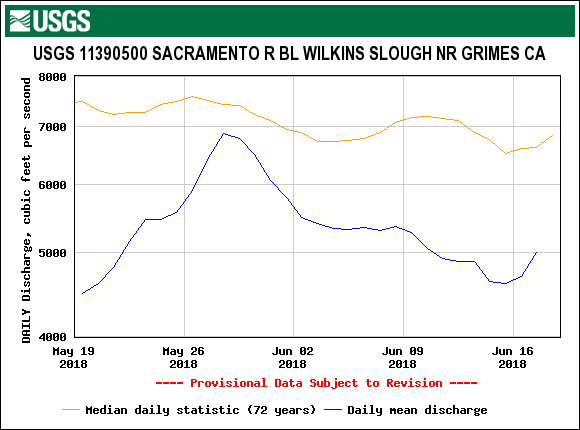
The causal factor is simply lower flows in spring and summer 2016-2018 than 2010-2012 (Figure 8). Lower flows, higher water temperatures, and lower turbidities lead to poor salmon smolt survival (and low adult migrant survival and subsequent egg viability). A concerted effort to recover salmon would mean maintaining water temperature objectives with spring-summer flows in the lower river at Wilkins Slough in the 7000-8000 cfs range instead of the 5000-6000 cfs range (Figure 8). This may require a supplemental release from Shasta Reservoir as in 2012 (Figure 9), which amounted to nearly 200,000 acre-ft of storage release, so that storage ended at 2,600,000 acre-ft at the end of September. The target end-of-September storage in below-normal water year 2018 is 2,300,000 acre-ft. With water deliveries near 2 million acre-ft from the Sacramento River in 2012 and 2018, a “concerted effort” involving 200 thousand acre-ft to maintain water temperature objectives prescribed in the water right permits seems reasonable. Whether it comes from Shasta storage or water contractor deliveries is a management/permitting agency decision.

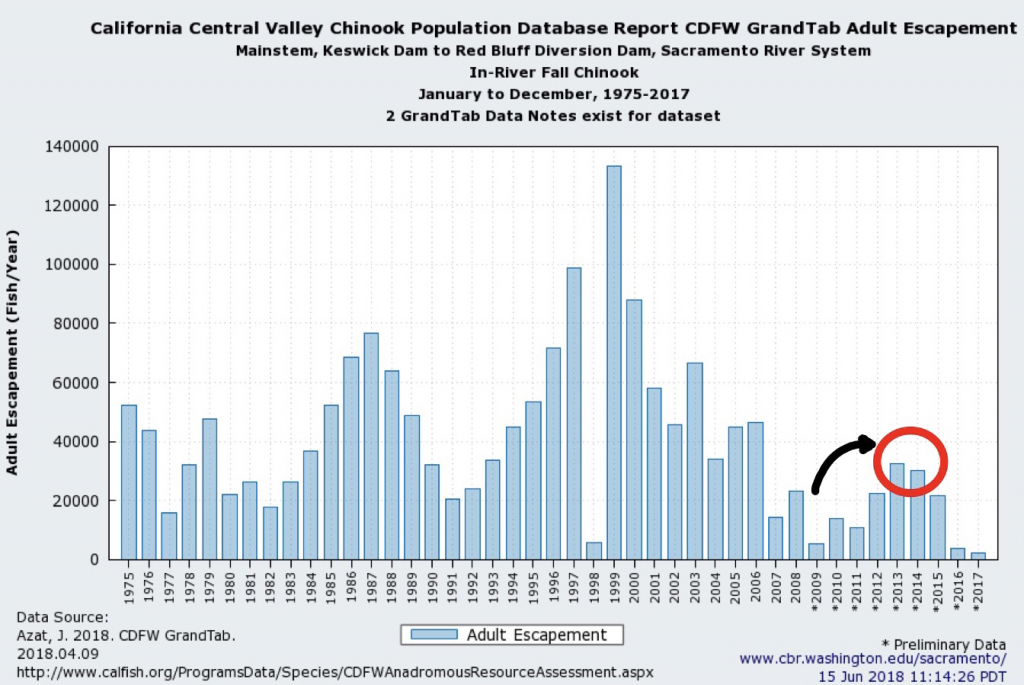
Figure 1. Long-term trend in upper Sacramento River fall-run salmon escapement. Red circle denotes recovery from low escapement from 2007-2009 drought.

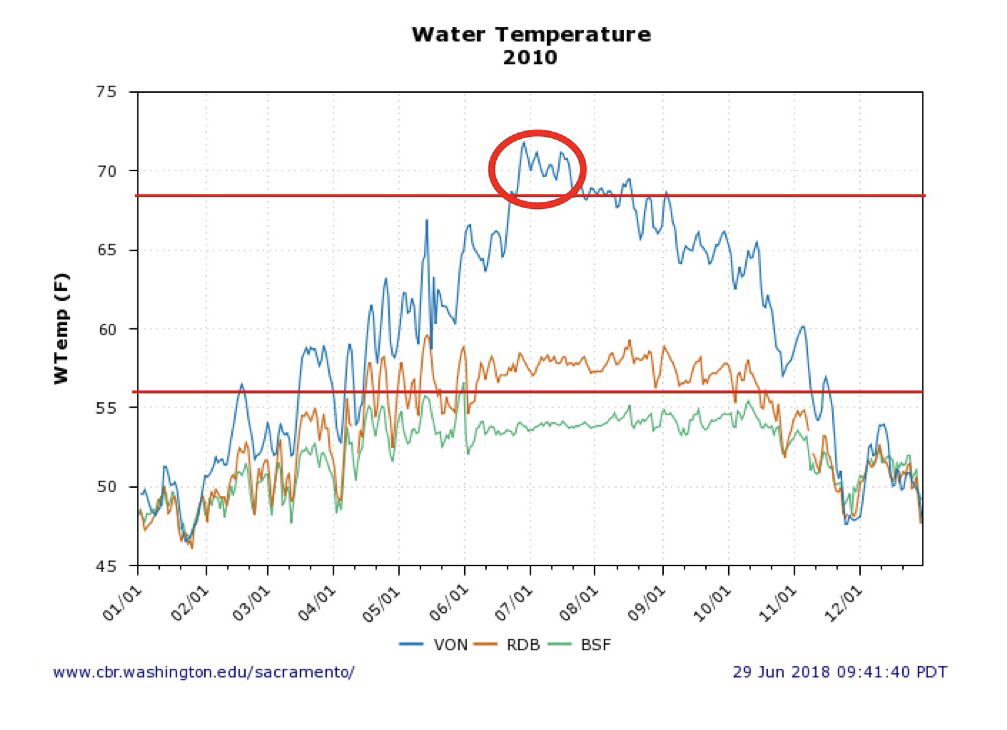
Figure 2. Water temperature in the upper (Red Bluff, Balls Ferry) and lower Sacramento River (Verona) in 2010. Top red line denotes objective for lower river (68°F); bottom line denotes objective for upper river (56°F). Red circle denotes excessive temperatures. In 2010, a below-normal water year following three years of drought had water temperatures near objectives.

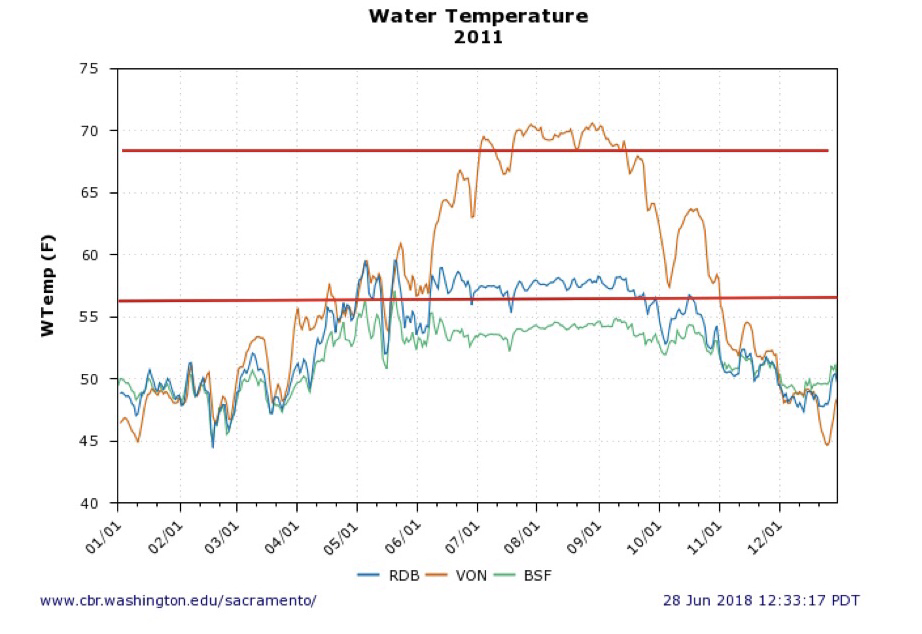
Figure 3. Water temperature in the upper (Red Bluff, Balls Ferry) and lower Sacramento River (Verona) in 2011. Top red line denotes objective for lower river (68°F); bottom line denotes objective for upper river (56°F). In 2011, a wet water year had water temperatures near objectives.

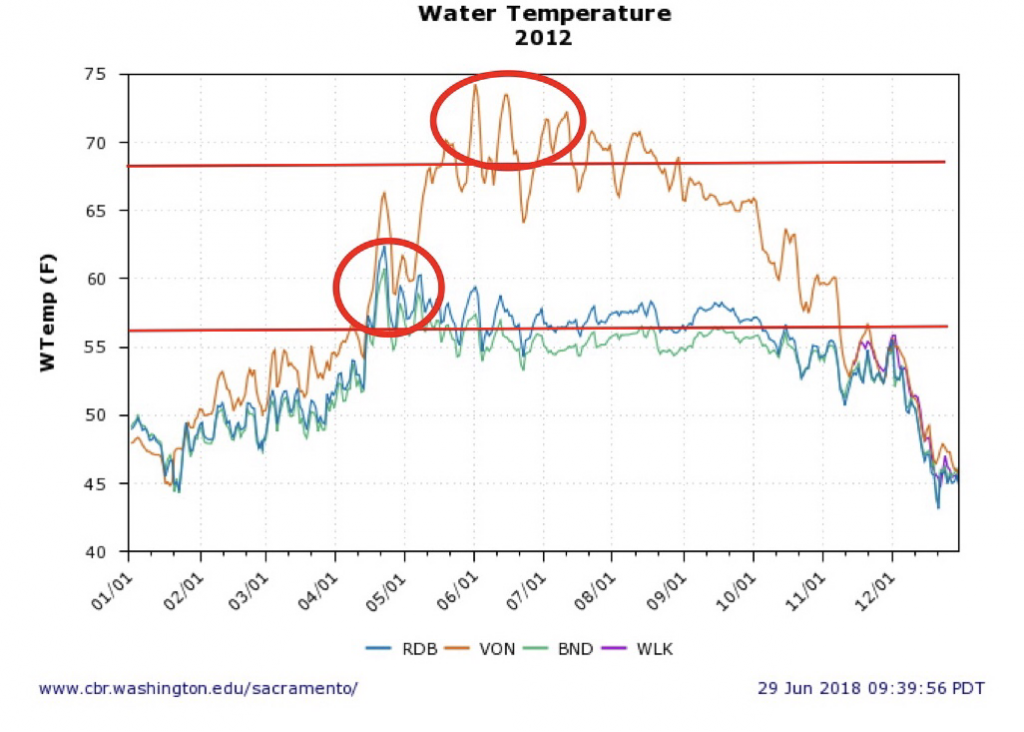
Figure 4. Water temperature in the upper (Red Bluff, Balls Ferry) and lower Sacramento River (Verona) in 2012. Top red line denotes objective for lower river (68°F); bottom line denotes objective for upper river (56°F). Red circles denote excessive temperatures. In 2012, a below-normal water year following a wet year had water temperatures near objectives.

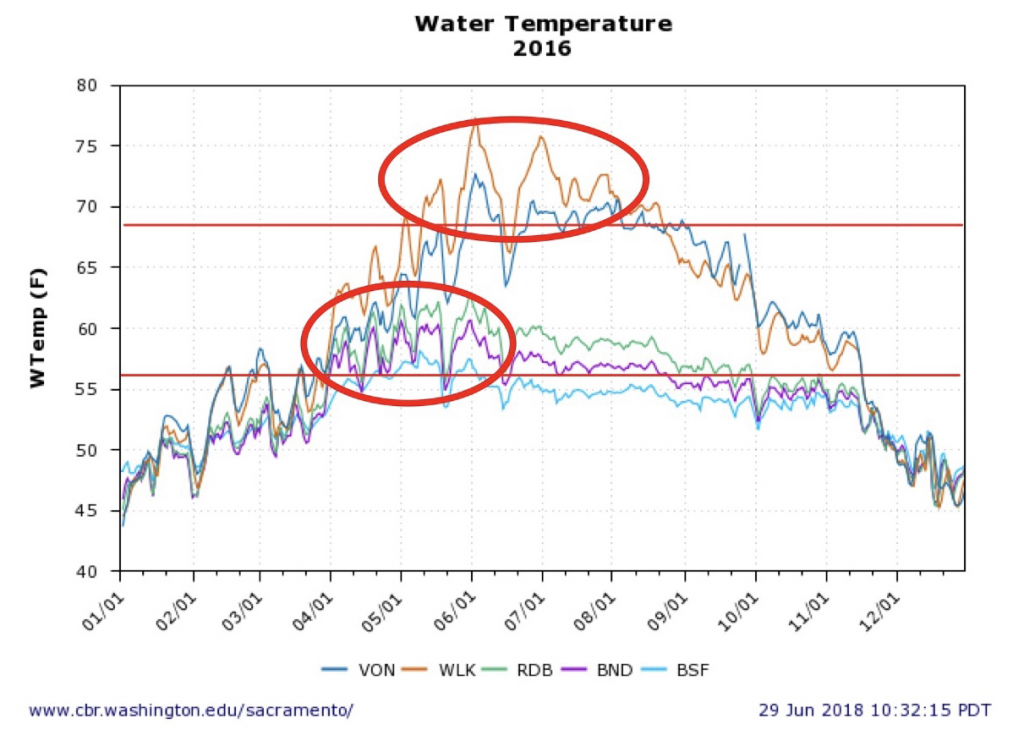
Figure 5. Water temperature in the upper (Red Bluff, Bend, Balls Ferry) and lower Sacramento River (Wilkins Slough, Verona) in 2016. Top red line denotes objective for lower river (68°F); bottom line denotes objective for upper river (56°F). Red circles denote excessive temperatures. In 2016, a below-normal water year following three drought years had water temperatures exceeding objectives April through July.

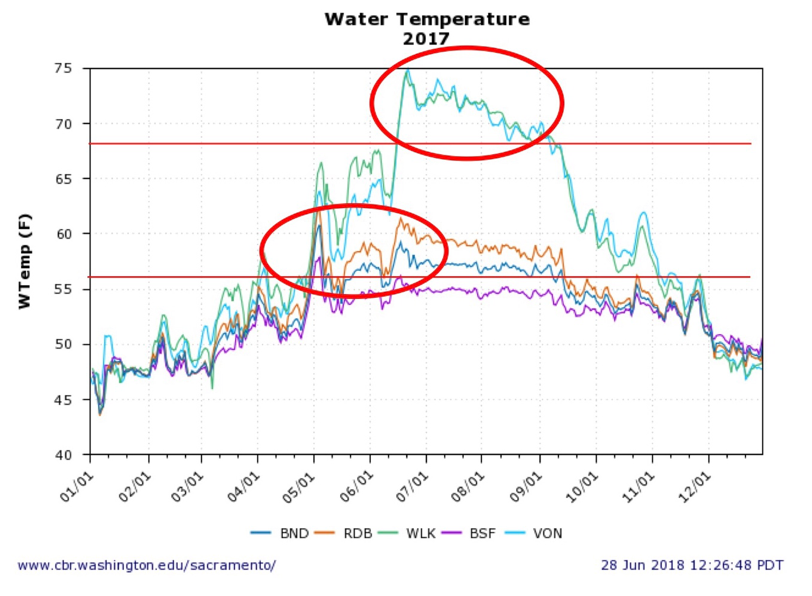
Figure 6. Water temperature in the upper (Red Bluff, Bend, Balls Ferry) and lower Sacramento River (Wilkins Slough, Verona) in 2017. Top red line denotes objective for lower river (68°F); bottom line denotes objective for upper river (56°F). Red circles denote excessive temperatures. In 2017, a wet water year had water temperatures exceeding objectives May through August.

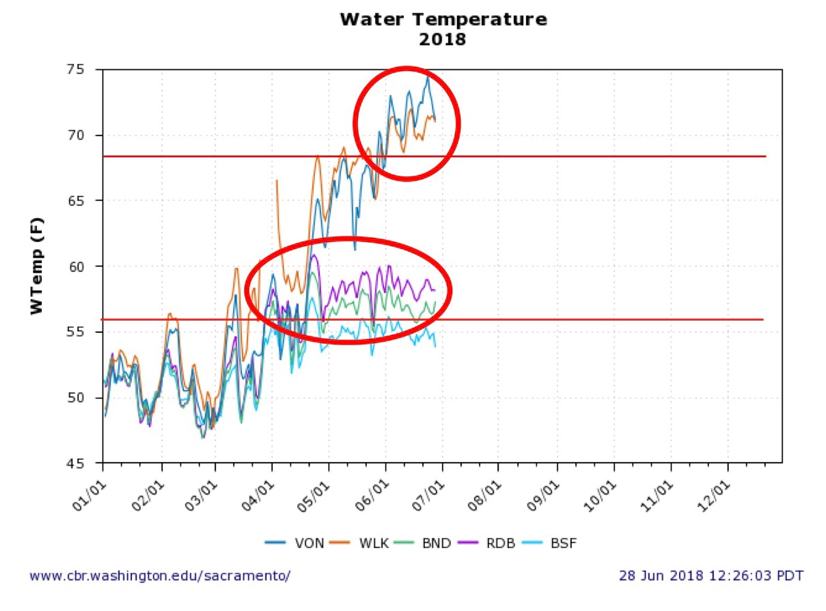
Figure 7. Water temperature in the upper (Red Bluff, Bend, Balls Ferry) and lower Sacramento River (Wilkins Slough, Verona) in 2018. Top red line denotes objective for lower river (68°F); bottom line denotes objective for upper river (56°F). Red circles denote excessive temperatures. In 2018, a below-normal water year following three drought years had water temperatures exceeding objectives April through June.

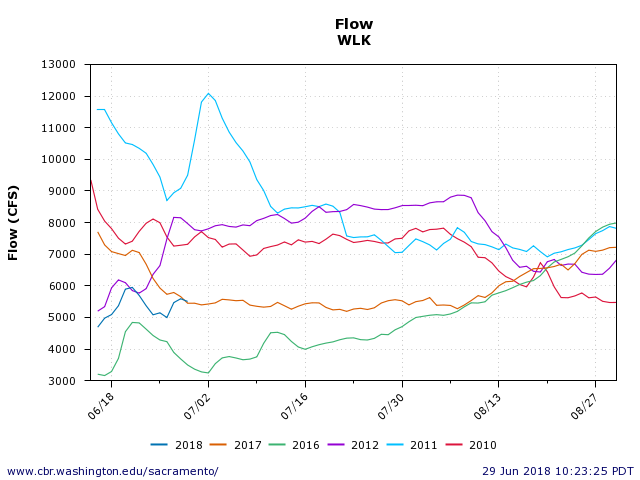
Figure 8. Summer flow in the lower Sacramento River (Wilkins Slough) in 2010-2012 and 2016-2018.

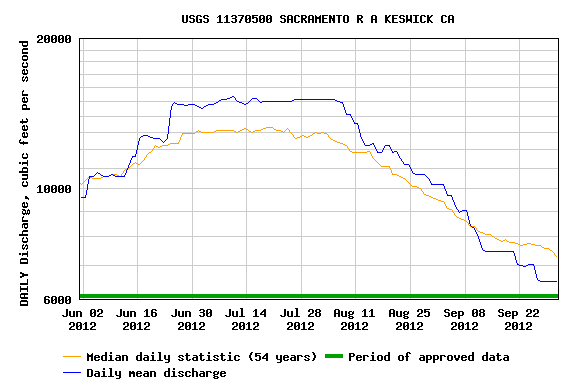
Figure 9. Releases of water from Keswick Reservoir to the lower Sacramento River in 2012 compared to 54 year average.

Sacramento River Low Flows and High Water Temperatures Violate State Standards for lower Sac River and Delta - Lethal for Salmon and Smelt

Low flows in the lower Sacramento River above the Feather River and warm flows from the Feather River are compromising the summer habitat of smelt and salmon in the lower Sacramento River and the Delta, violating state and federal water quality standards.

Lower Sacramento River at Wilkins Slough

The Sacramento River at Wilkins Slough at river mile 118, 63 miles upstream of the Sacramento Delta, has low flows and high water temperatures (Figure 1).  The high water temperatures are a violation of the 68oF (average daily) water quality standard and are stressful to migrating salmon.

Lower Sacramento River at Verona below mouth of Feather River

The lower Sacramento River 50 miles downstream of Wilkins Slough at Verona, just downstream of the mouth of the Feather River, has near lethal water temperatures, far above the water quality standard (Figure 2).  The high temperatures are likely due in part to recent increased releases from Oroville Reservoir to lower water levels for the spillway repair project.

Lower Sacramento River in Delta

The lower Sacramento River at Freeport in the north Delta, 25 miles downstream of Verona, has near lethal water temperatures for Delta smelt (Figure 3).   The high temperatures are likely due in part to recent increased releases from Oroville Reservoir to lower water levels for the spillway repair project.  The north Delta water temperatures are also high in part due to lower than normal net river flow (as measured at Rio Vista 20 miles downstream of Freeport – Figure 4).  The low flows have also led to encroaching salinity at Emmaton several miles downstream of Rio Vista (Figure 5), also in violation of water quality standards.

Figure 1. Sacramento River at Wilkins Slough flow and water temperature in May-June 2018. The water temperature standard for the lower Sacramento River is 20°C (68°F).

Figure 2. Sacramento River at Verona water temperature 6/15-6/26, 2018. The water temperature standard for the lower Sacramento River is 20°C (68°F).

Figure 3. Sacramento River at Freeport water temperature 6/15-6/26, 2018. The water temperatures above 72°F are stressful to Delta smelt.

Figure 4. Rio Vista daily average historical and 2018 flow May-June.

Figure 5. Salinity (EC) at Emmaton near Rio Vista. The standard of 450 EC (uS/cm) was exceeded from 6/15 to 6/18, 2018. The standard is necessary to keep the low salinity zone, critical habitat for Delta smelt. west of the Delta.

Coho Salmon Fishery Options in California

The two sub-adult hatchery coho pictured above were recently caught in Puget Sound near Seattle, in a mark-selective fishery (note adipose fins missing on all hatchery coho as in California) where all wild fish (intact adipose fin) must be released. This Washington state sport fishery is hugely popular.1 These hatchery fish reside in the Puget Sound year-round, unlike their wild counterparts.

Coho are native to the California coast and are listed under the state and federal endangered species acts, as they are in Oregon and Washington states. Coastal coho are supplemented by four hatcheries in California. No coho may be kept in California fisheries. Coho were once planted in California reservoirs and supported popular fisheries.

Coho recovery efforts over the past several decades have had mixed results. Information on coho in California can be found at: https://www.wildlife.ca.gov/Conservation/Fishes/Coho-Salmon . The goal of the 2004 Coho Recovery Strategy to allow fishing has not been met:

Recovery Strategy GOAL VI: Reach and maintain coho salmon population levels to allow for the resumption of Tribal, recreational, and commercial fisheries for coho salmon in California.

So why not establish mark-selective fisheries for coho in coastal bays in California (e.g., Monterey, San Francisco, Tomales, and Humboldt bays)? The same issues and conflicts in California occur in the Puget Sound fishery. Why not help the underfunded California Coho Recovery Program with revenue generated from such a hatchery coho fishery?

For more information on coho recovery, see: http://www.westcoast.fisheries.noaa.gov/.

Enhancing Pelagic Habitat Productivity in the North Delta Is it too late to save the Delta smelt?

The Bureau of Reclamation recently released an Environmental Assessment for the Sacramento Deep Water Ship Channel Nutrient Enrichment Project. The proposed project would directly release nitrogen nutrients into the Ship Channel, which runs from West Sacramento to Cache Slough, north of Rio Vista.  The project is designed to stimulate plankton blooms in the North Delta as part of the Delta Smelt Resilience Strategy, which describes the goal as follows:

The purpose is to determine if the addition of nitrogen can stimulate plankton (fish food organisms) production in a section of the ship channel, which is isolated from the Delta in terms of water flow.

Adding nitrogen to the ship channel will indeed stimulate plankton productivity.  Only a few miles away, regional governments have spent decades in removing nitrogen (most recently, ammonia) from the effluent of the Sacramento Regional Wastewater Treatment Plant to reduce production of blue-green algae in the Delta.  The City of West Sacramento already seasonally releases high nutrients, metals, and salts into the Ship Channel.  Adding more nitrogen could easily increase toxic blue-green algae problems in the Delta, similar to the bloom that recently led to the recreational closure of southern California’s Diamond Valley Reservoir, which receives Delta water.

There is higher plankton productivity in the Ship Channel than in nearby Delta channels because the Ship Channel has longer residence time, higher nutrients,  and higher water temperatures.  The broken gate on the Ship Channel’s northern entrance contributes to these conditions.  However, lack of circulation also leads to nitrogen depletion and declining plankton production, and there is limited seasonal replenishment of nitrogen.

The Delta Smelt Resilience Strategy is considering increasing flows into the north Delta from the Colusa Basin Drain, Fremont Weir, and the Ship Channel to stimulate Delta plankton blooms.  The biggest problem with these sources is high spring-through-fall water temperatures (Figures 1-3).  Water temperature is certainly the greatest limiting factor in the north Delta for Delta smelt; adding nitrogen will not fix this problem.

Fixing the gate at the north end and allowing cooler Sacramento River water (strong American River influence) into the channel (Figure 4) would reduce water temperatures in the Ship Channel.  Just a few degrees can be life or death for Delta smelt.  Increased entry into the Ship Channel of Sacramento River water would also introduce more nitrogen, potentially reducing the need to fertilize the Ship Channel with crop dusters.

Figure 1. Water temperature in the Yolo Bypass downstream of the entrance of the Colusa Basin Drain.

Figure 2. Water temperature in the Sacramento River Deep Water Ship Channel.

Figure 3. Water temperature in the lower Yolo Bypass toe drain canal near Liberty Island.

Figure 4. Water temperature in the Sacramento River near Freeport downstream of the entrance to the Sacramento River Deep Water Shipp Channel.

Gross Violation of Water Quality Standards for Water Temperature in Lower Sacramento River Further Degradation of Salmon Habitat

Water temperatures in the lower Sacramento River over the past month have often exceeded water quality standards that protect salmon and other beneficial uses (Figures 1 and 2).  Water temperatures at or above the standard of 68oF adversely affect adult and juvenile salmon.  Water temperatures can meet the standard if the Bureau of Reclamation maintains flow in the Sacramento at Wilkins Slough at 6000-8000 cfs, depending on air temperature.  The Bureau of Reclamation has maintained such flows in the past to meet water quality standards and terms in its water rights permits (Figure 3).  Shasta Reservoir water storage is 102% of normal as of June 18, 2018.  Water diversions from the Sacramento River upstream of Wilkins Slough are approximately 6,000 cfs, with 100% allocation to CVP contractors under water right permits.  For more on the effects on salmon, see past posts.

Figure 1. Sacramento River flow and water temperature at Wilkins Slough in lower Sacramento River: mid-May to mid-June 2018. Red line denotes water quality standard. Source: CDEC.

Figure 2. Sacramento River water temperature at Verona in lower Sacramento River: mid-May to mid-June 2018. Red line denotes water quality standard. Source: CDEC.

Figure 3. Historical and recent flow at Wilkins Slough. Source: USGS.