Are Shasta Dam Release Patterns Contributing to Low Sacramento River Fall-Run Salmon Runs and Escapement? Yes.
The 2007-2009 Sacramento River salmon crash (Figure 1) is well documented (Lindley 2009). The poor returns of brood years 2004-2005 in 2007-2008 from high 2004-2005 adult runs are particularly troubling. Lindley et al. looked closely at both the wild and hatchery components of brood years 2004 and 2005 to determine the potential causes of the crash. They focused on identifying “where and when in the life cycle abundance became anomalously low, and where and when poor environmental conditions occurred due to natural or human-induced causes.” Their review led to a conclusion that ocean conditions for brood years 2004-2005 was the primary cause of the crash: “all of the evidence that we could find points to ocean conditions as being the proximate cause of the poor performance of the 2004 and 2005 broods of SRFC.” They also came to the following conclusions:
- We recognize, however, that the rapid and likely temporary deterioration in ocean conditions is acting on top of a long-term, steady degradation of the freshwater and estuarine environment.
- The evidence pointed to ocean conditions as the proximate cause because conditions in freshwater were not unusual, and a measure of abundance at the entrance to the estuary showed that, up until that point, these broods were at or near normal levels of abundance.
- A broad body of evidence suggests that anomalous conditions in the coastal ocean in 2005 and 2006 resulted in unusually poor survival of the 2004 and 2005 broods of SRFC. Both broods entered the ocean during periods of weak upwelling, warm sea surface temperatures, and low densities of prey items.
- The cessation of net-pen acclimatization in the estuary in 2006 may have contributed to the especially poor estuarine and marine survival of the 2005 brood.
I revisited the information on the “crash” with the added information from the time of that crash, subsequent years, and the reoccurrence in what appears to be a 2016-2017 crash. Lindley et al. only had limited information available for their 2009 report. A close look at Figure 1 provides several key clues:
- The crash involved both hatchery and wild fish production.
- The poor production of wild fish continued through 2011 and again in 2016.
- Brood year 2006 and 2013 wild fish had the poorest production, while brood year 2004 and 2005 production was actually higher than brood years 2006-2008.
Failure of Brood Years 2004 and 2005.
First a look at brood years 2004 and 2005. Both years’ 12 million hatchery-produced smolts were released at the hatchery from mid-April to early May. None were coded-wire tagged or trucked to Bay pens. Their success cannot be determined, other than being a contributor to poor hatchery adult runs from 2007-2009.
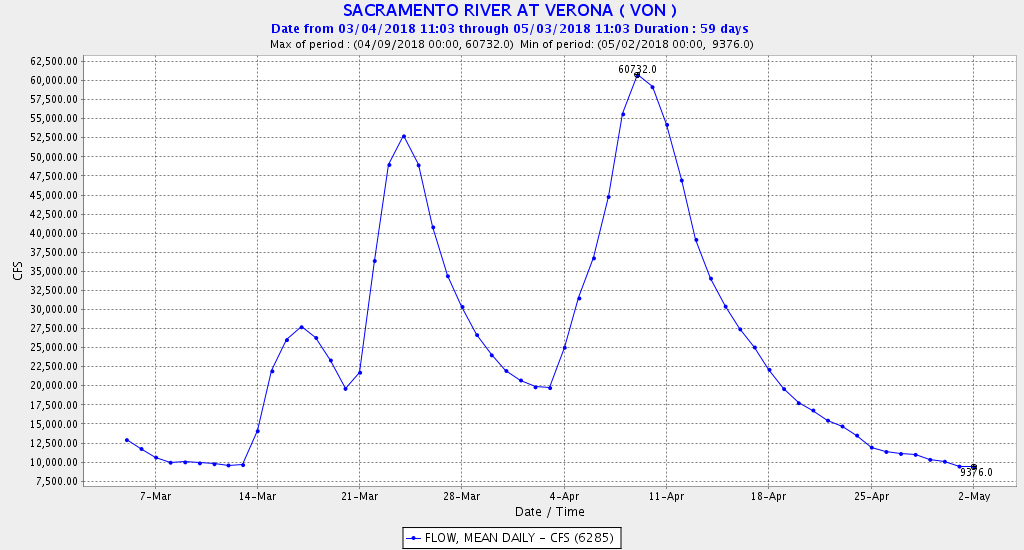
Brood year 2004 wild and hatchery smolts were subjected to low river flows (as low as 5000 cfs at Wilkins Slough in the lower Sacramento River) and high water temperatures (56-61oF) at Red Bluff and below in late April to mid-May. Such conditions are extremely poor and would have likely led to poor survival to the ocean. Keswick releases were very low in the winter-spring rearing and migrating period in 2005 (Figure 2), also likely contributing to low survival.
Brood year 2005 smolts had somewhat better conditions in wet year 2006, but still had to contend with high water temperatures (56-59oF) from Red Bluff and downstream in late April and early May. Brood year 2005 wild fish also were subjected to high late-December flood flows (Figure 2) that may have scoured redds in the spawning reach below Keswick Dam.
Both brood years had to contend with sharply falling flows during the fall spawning period (Figure 2) that likely led to redd stranding and poor embryo survival of the wild fish component. In addition, the Red Bluff Diversion Dam had closed gates after April 1, another low survival factor. Wild fish may have fared better overall because a majority of the juvenile salmon production for the year passed Red Bluff before the April 1 gate closure with generally better river conditions.
Failure of Brood Year 2006
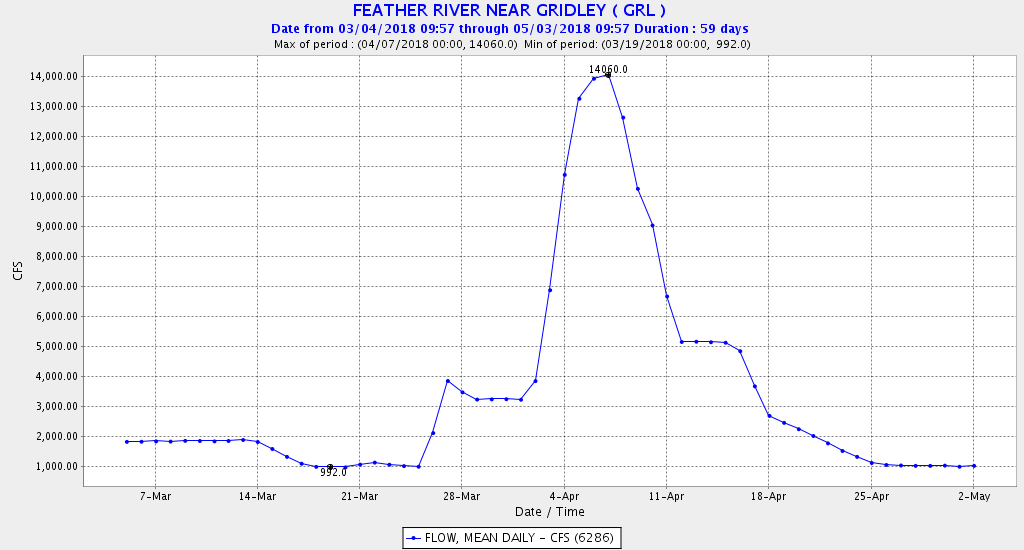
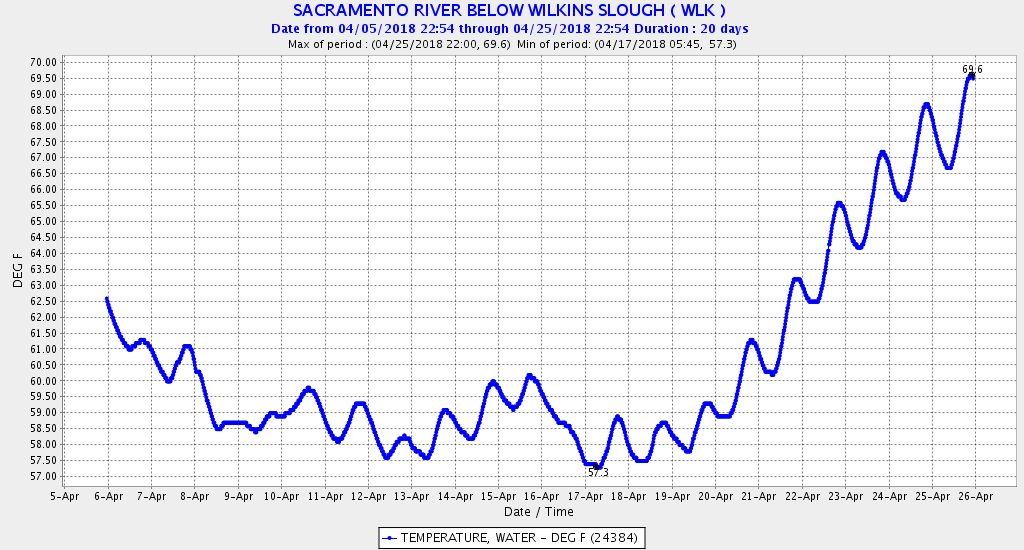
Brood year 2006 appears to have fared worse than brood years 2004 and 2005, in both the hatchery and wild components (2009 escapement in Figure 1). Unlike brood year 2004 and 2005 hatchery production, a quarter of the 12 million hatchery smolts (again all released at the hatchery in mid- to late April 2007) were coded-wire tagged. Of these, only 0.00 to 0.09 percent survived (1% or higher is good survival). In other words, less than 100,000 adults were produced with only about 20,000 escapement (Figure 1). Most of these 12 million smolts were released at the hatchery in the last week of April under generally low flow (5000 cfs) and high water temperature conditions (68-72oF after May 1) in the lower Sacramento River (Figure 3). The Red Bluff Diversion Dam was closed after April 1, as in 2005 and 2006. Such conditions likely led to very poor survival.
As a consequence, only about 5000 adult wild run fish contributed to the upper river mainstem escapement in 2009, compared to a range of 50,000 to 150,000 over the prior decade. The cause of the poor 2009 wild escapement (Figure 1) is best explained by a combination of factors: 1) poor numbers of spawners from brood year 2006; 2) poor egg/embryo survival from redd stranding in fall 2006 (Figure 2); 3) generally poor winter flows below Keswick Dam in drought year 2007 (Figure 2); and 4) generally poor ocean conditions outlined in Lindley et al. in years 2006-2008.
Brood Years 2007 and 2008
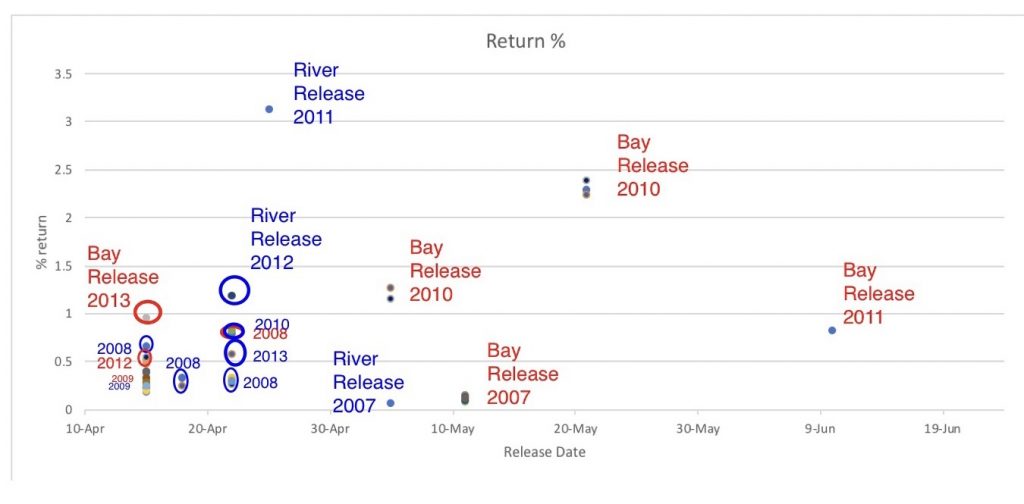
Brood years 2007 and 2008 had improved hatchery smolt survival and poor wild survival (years 2010 and 2011 escapement in Figure 1). Of the approximately 12 million hatchery brood year 2007 smolts released, approximately 1.5 million were trucked to the Delta or Bay pens with a subsequent survival of 0.10-0.14 %. The 10.5 million smolts released at the Coleman Hatchery had similar subsequent survival. Survival, though still poor, was about double that of brood year 2006, which led to double the hatchery fish escapement in the 2010 run over 2009 (Figure 1).
Brood year 2008 releases totaled approximately 15 million smolts, with about 10% trucked and released in San Pablo Bay pens. The Bay releases had a much improved survival of about 1%, as did the river releases (0.3-1.0%), leading to a doubling of the hatchery component in the 2011 run over 2010 (Figure 1). Installation of the Red Bluff Diversion Dam was delayed to late spring.
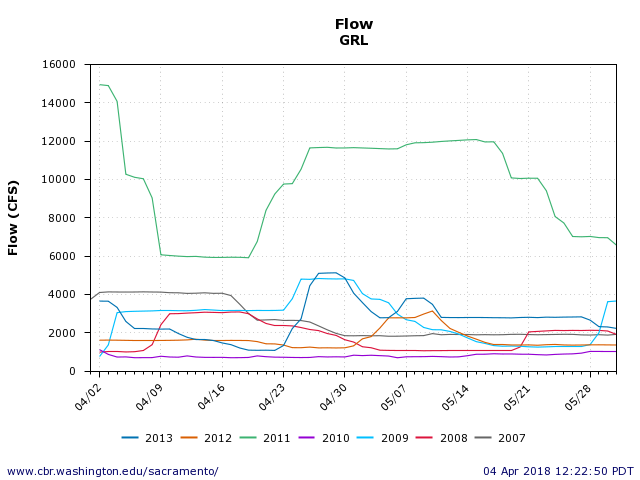
The wild fish contributions from brood years 2007 and 2008 remained poor (2010 and 2011 escapement in Figure 1). Poor runs (escapement) in 2007 and 2008 likely contributed to this; however, conditions were poor for eggs and fry in these brood years in the spawning reach in fall and winter (Figure 4). Hatchery river releases after April 1 had better conditions, with increased Keswick releases (Figure 4) and reduced operation of the Red Bluff Diversion Dam.
Brood Year 2009
Recovery from the 2007-2009 crash continued with the success of brood year 2009 (2012 escapement in Figure 1). The 12 million smolts, including 1.4 million released to Bay pens, had good survival rates of 1-4%. The Red Bluff Diversion Dam was decommissioned. In contrast, wild river escapement, though somewhat improved, remained poor. As for brood years 2007 and 2008, fall and winter conditions remained poor for wild fish (Figure 4). Redd stranding and low winter flows for rearing and emigration were significant problems.
Conclusions
- The Sacramento River fall-run salmon crash of 2007-2009 was caused by the combination of poor ocean conditions, fall redd stranding, poor winter Shasta/Keswick Reservoir releases, the December 2005 flood, upper river hatchery smolt releases in spring after Red Bluff Diversion Dam gates were closed, poor spring river flows and high water temperatures, and lack of Bay pen hatchery smolt releases.
- Recovery from 2010-2012 was mainly due to improved hatchery smolt survival from decommissioning of Red Bluff Diversion Dam, Bay pen releases, and improved ocean survival for brood years 2008 and 2009. Wild fish improvements were less marked because of poor spawner numbers and continuing poor river conditions (redd stranding and low winter flows), and poor Delta conditions (high exports and low inflow/outflow).
- Over the past decade or so, there has been a concerted strategy to limit releases from Shasta Reservoir during the non-irrigation season (Nov-Mar), which has compromised survival of wild and hatchery salmon populations in the Sacramento River. This strategy, combined with drought and poor ocean conditions, led directly to population crashes of fall-run salmon in 2007-2009 and 2016-2017.
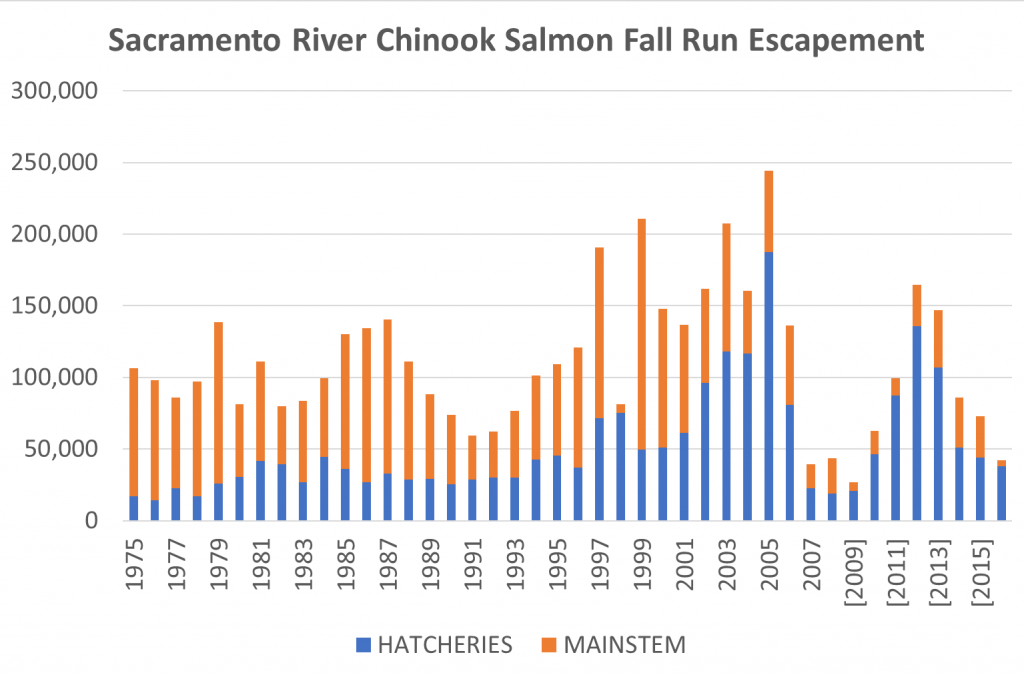
Figure 1. Sacramento River fall-run salmon run escapement 1975-2016.

Figure 2. Shasta/Keswick reservoir releases spring 2003 through spring 2007, with emphasis on fall spawning and spring rearing periods for salmon brood years 2004 and 2005. Note sharp fall flow declines in both years (magenta circles), low spring 2005 flows, and late December 2005 flood (red circle).
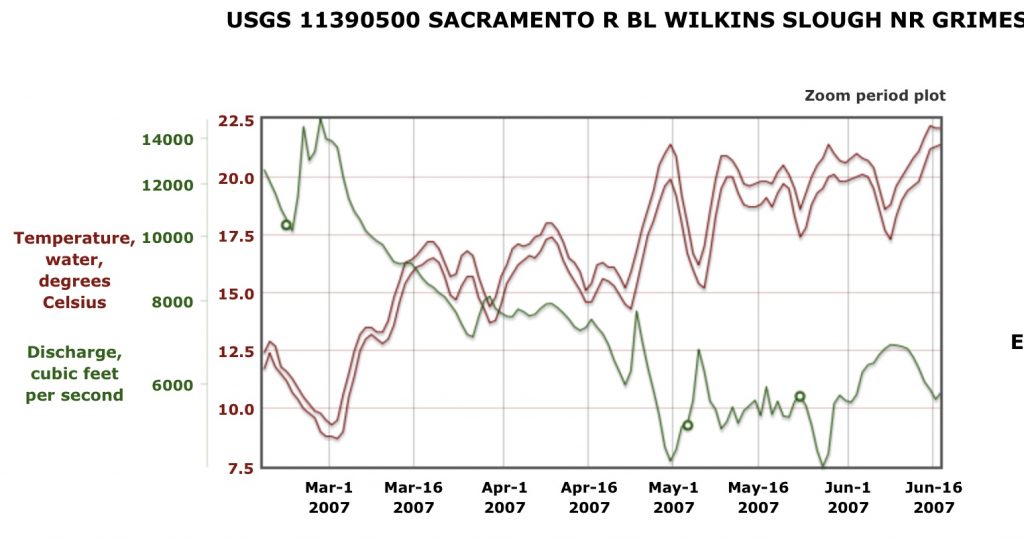
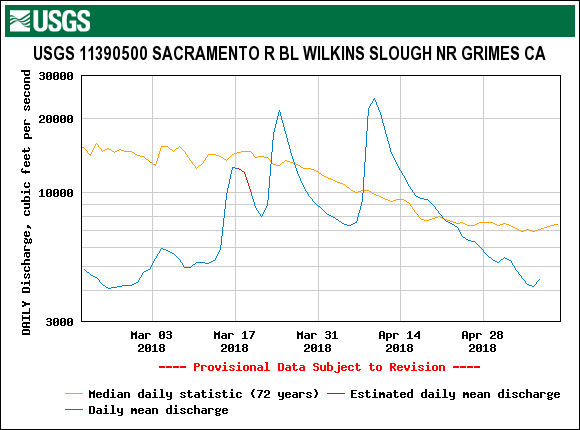
Figure 3. River flow and water temperatures (daily high and low) in lower Sacramento River at Wilkins Slough Mar-Jun 2007.
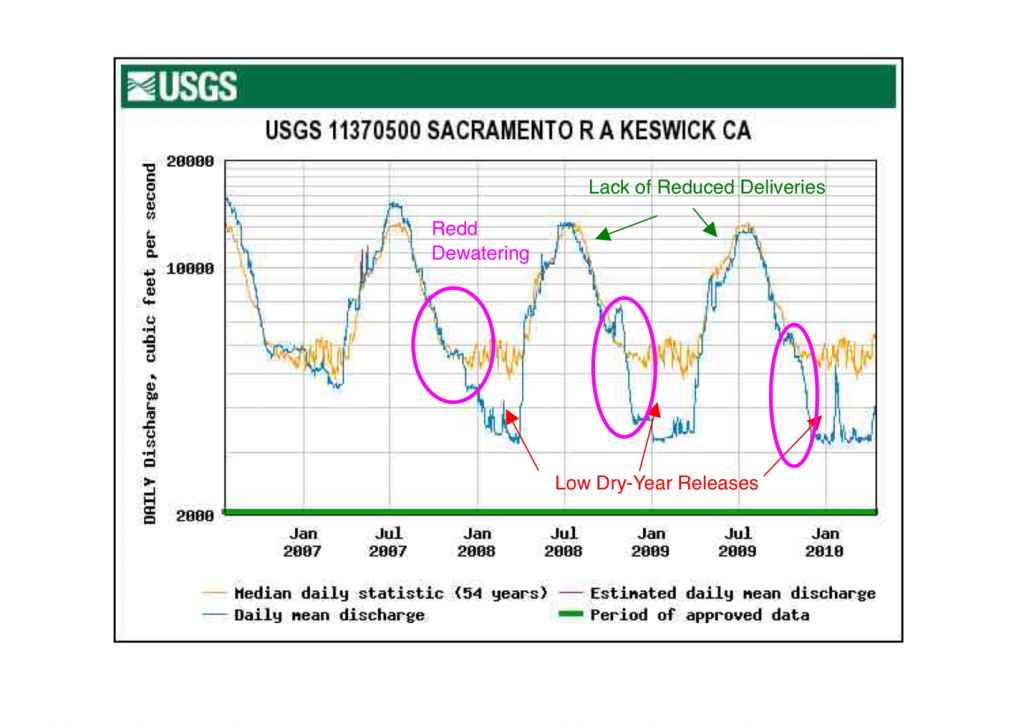
Figure 4. Shasta/Keswick reservoir releases fall 2007 through spring 2010, with emphasis on fall spawning and spring rearing periods for salmon brood years 2007-2009. Note sharp fall flow declines in the three years (magenta circles) and low winter flows (red arrows).