American River Chinook Salmon – Status and Future

The American River is one of the larger tributaries of the Sacramento River (Figure 1). Its watershed runs from the central Sierra Nevada range, from which it runs through the city of Sacramento to join the Sacramento River. The American River’s lower 20 miles are a tailwater of the Central Valley Project’s Folsom Dam. This tailwater supports a major run of fall-run Chinook salmon that produces 15-20% of the total Central Valley fall-run Chinook salmon population.

American river run size (adult escapement) has ranged from 6,000 in 2008 to 178,000 in 2003 (Figure 2). The CVPIA long-term average goal for the American River fall-run is a contribution of 160,000 adult fish to the overall goal of 750,000 for the Central Valley. Many of the American River spawners are from the American’s Nimbus hatchery, or are strays from other Valley hatcheries. However, a large part of the run spawns naturally in the upper ten miles of the lower American River below Nimbus dam within Sacramento County’s urban parkway. The hatched fry of natural spawners rear by the millions in the lower river and in the Delta. Each spring, about 5 million Nimbus hatchery smolts are trucked to the Delta or Bay and released.

The American River fall run is often considered a hatchery run, with the 20 miles of river described as a mere conduit to the hatchery. The hatchery smolts are nearly always trucked to the Bay or lower Delta because of the high potential risk from water diversions or predation in the river or the upper Delta. Trucked and Bay pen-acclimated hatchery smolts generally have a relatively high survival-contribution rate and low straying rate compared to other Central Valley hatchery tagged fish.1

Brown 2006 reviewed the status of the American River population during its peak 2000-2005 runs. He attributed the strong runs to a variety of improvements at the hatchery:

  1. Changes in fish ladder operations to bring fish into the hatchery later in the fall to minimize temperature problems.
  2. Change in egg incubation and size at release (to all smolts).
  3. Elimination or control of early disease problems with the help of DFG pathologists.
  4. Elimination of most bird depredation within the hatchery through deployment of exclusion nets over the raceways.
  5. Change in the DFG approach to hatchery operations since 1999 when the National Marine Fisheries Service (NOAA Fisheries) urged DFG to adopt standard operating procedures.
  6. Change in release location to San Pablo Bay and change in the method of release to net pens in place of direct releases from the transport trucks to the Bay.

Others offered additional reasons for the improvement in the fall Chinook runs in the Central Valley, including the following:

  • Gravel and rearing enhancement (enhancements to spawning and rearing habitat had occurred under the CVPIA Program).
  • Better hatchery practices (mentioned above)
  • Good ocean conditions
  • Reduced ocean fisheries
  • Better instream conditions (1995-2000 were wet years)
  • Some combination of the above

Subsequent to the good runs from 2000-2005, runs declined sharply to record lows during the 2007-2009 drought (see Figure 2). The general decline across the Central Valley was attributed mostly to poor ocean conditions.2 This seems reasonable since 2006 was a wet year with good river-Delta rearing conditions that should have produced a strong 2008 run rather than a record low run. The decline is also related to high late summer and early fall water temperatures in the lower American River that led to poor adult and egg survival (Figure 3). Such conditions occurred in the drier period of 2001-2005. I describe this specific problem in detail in a prior post.

I took a closer look at the spawner-recruit relationship of the American fall-run salmon (Figure 4). There was a significant underlying positive relationship between spawners and recruits three years later. That relationship was modified by water year conditions during the rearing year (most likely the winter-spring rearing conditions) and by the fall spawning conditions in both the spawning year (from poor egg-embryo viability) and the return year (pre-spawn mortality of adults). Poor recruits-per-spawners stand out in the two drought periods 1990-1992 and 2007-2009. Years 90, 92, and 09 especially stand out with (1) poor initial spawning conditions in the fall of 87, 89, and 06, (2) poor rearing conditions in drought years (red numbers), and (3) poor spawning conditions in drought years (red circles).

Year 2008 recruits stand out in Figure 4 as the lowest recruit year despite a wet rearing year in 2006. There are at least several possible contributing factors for this particular outlier:

  1. Winter 2006 (Dec 05 and Jan 06) saw a large-scale flood, second only to the 1997 winter flood in recent decades. After spawning in the American River occurred during a steady flow of 2000-2500 cfs during the fall, flow reached 35,000 cfs in late December and early January, likely washing out much of the spawn. Only winter 1997 and 2017 have had similar Dec-Jan floods since 1975. Such a flood could have washed out the eggs/embryos spawned in fall of 2005, thus contributing to the poor 2008 run.
  2. Egg viability during the fall 2005 spawn may have been poor because water temperature was high (at or greater than 60°F) during most of the spawning season from mid-September through mid-November.
  3. Poor ocean conditions may have reduced survival of smolts rearing in the ocean in summer-fall of 2006.
  4. During the 2008 spawning season, flows were low, near 1000 cfs, and water temperatures exceeded 65°F through mid–October, likely leading to high pre-spawn mortality and lower than expected escapement. Poor conditions in the river may have attracted fewer spawners to the American or delayed their migration, leading to greater pre-spawn mortality or increased straying to other spawning rivers.

Floods during the wet winters of 1982 and 1986 may have contributed to the lower than expected runs in 1984 and 1988, respectively. Though not as strong as the Dec-Jan floods of 1997 and 2006 water years, winter floods in 82 and 86 were still substantial.

The hatchery practice of trucking smolts to acclimation pens in the Bay likely contributed to the strong runs in years 2000-2004. Lack of pen acclimation from 2003 to 2005 likely contributed to reduced runs from 2005 to 2007.

In summary, recruitment to the fall-run salmon population in the American River is a complex process affected by multiple factors. However, there are several actions that serve to keep recruitment-escapement and the contribution of the American River to California fisheries high.

  1. Trucking hatchery smolts to acclimation pens to San Pablo Bay contributes substantially to good salmon recruitment from the American River. Releases to pens in the Delta may reduce costs, but this comes at the expense of substantially less recruitment. Releases to the Bay allow DFW to grow fish longer in the hatchery, which contributes to higher ocean survival.
  2. Improvements to flow and water temperatures from September through November will reduce adult pre-spawn mortality, improve egg viability in hatchery and wild spawners, and increase wild embryo survival in redds.
  3. Improved late-winter and early-spring flows will improve growth and survival of juveniles rearing in the river, and improve transport of wild juveniles to Delta rearing areas.
  4. Though the jury may still be out on the contribution of habitat improvements to the salmon population, spawning and rearing habitat restoration in recent decades in the American River have likely helped sustain higher recruitment in good and poor water years alike. Habitat improvements increase the recruit-per-spawner capacity of salmon in the American River, especially given the relatively fixed contribution of the hatchery program. The wild or non-hatchery component of the American River salmon population also depends on Delta habitat and migratory conditions, which may also change in coming years.
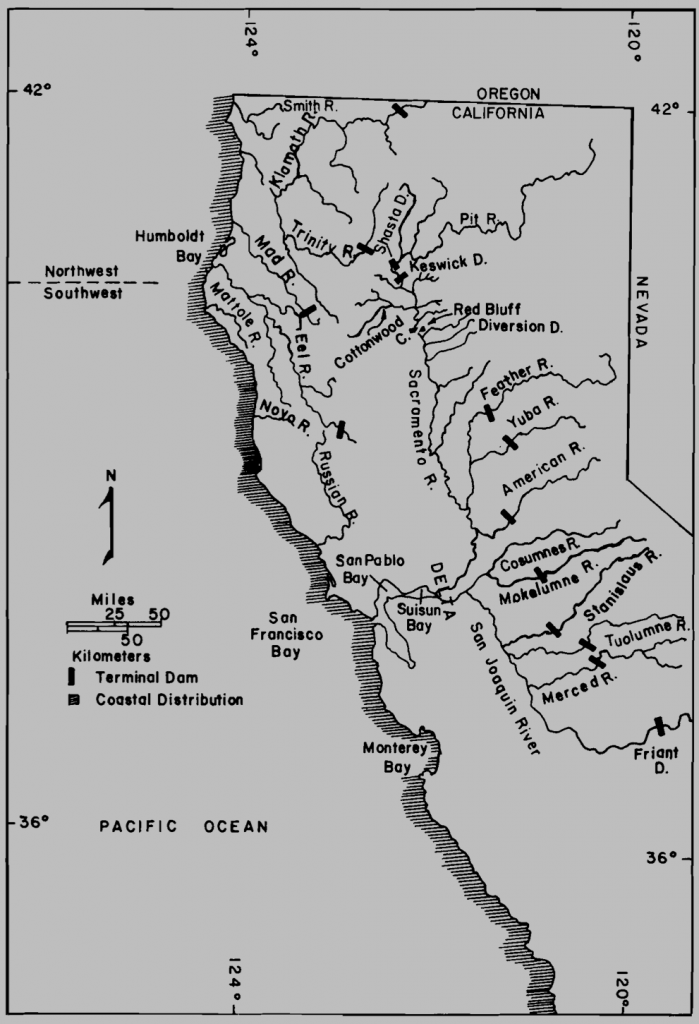
Figure 1. Chinook salmon rivers. Source: Chinook salmon – species profile (USDOI 1986).
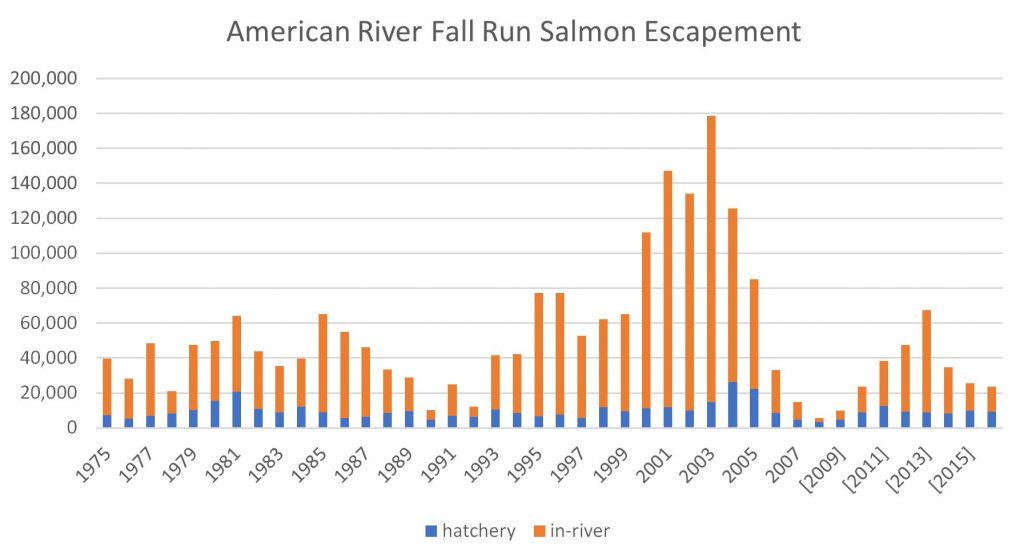
Figure 2. Fall run Chinook salmon escapement (river and hatchery counts) to the American River 1975-2016. Data Source: CDFW GrandTab.
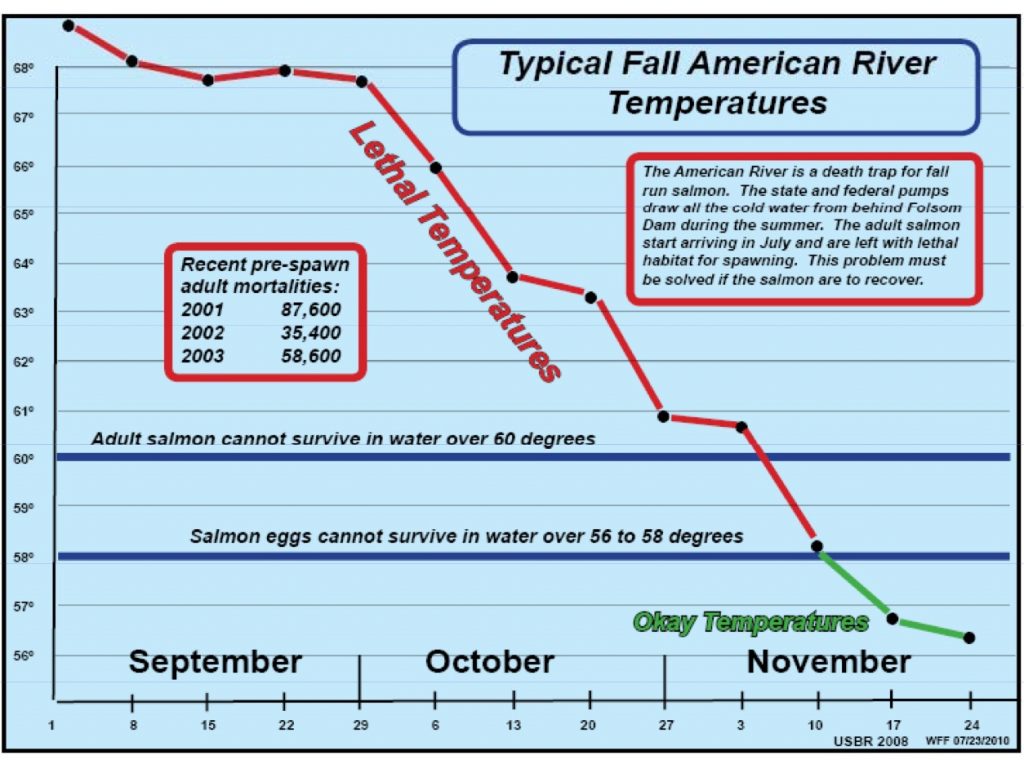
Figure 3. “The American River is a death trap for fall run salmon” because of high water temperatures. Source: http://water4fish.org/res/pdf/salmon_status_and_needs_2011.pdf
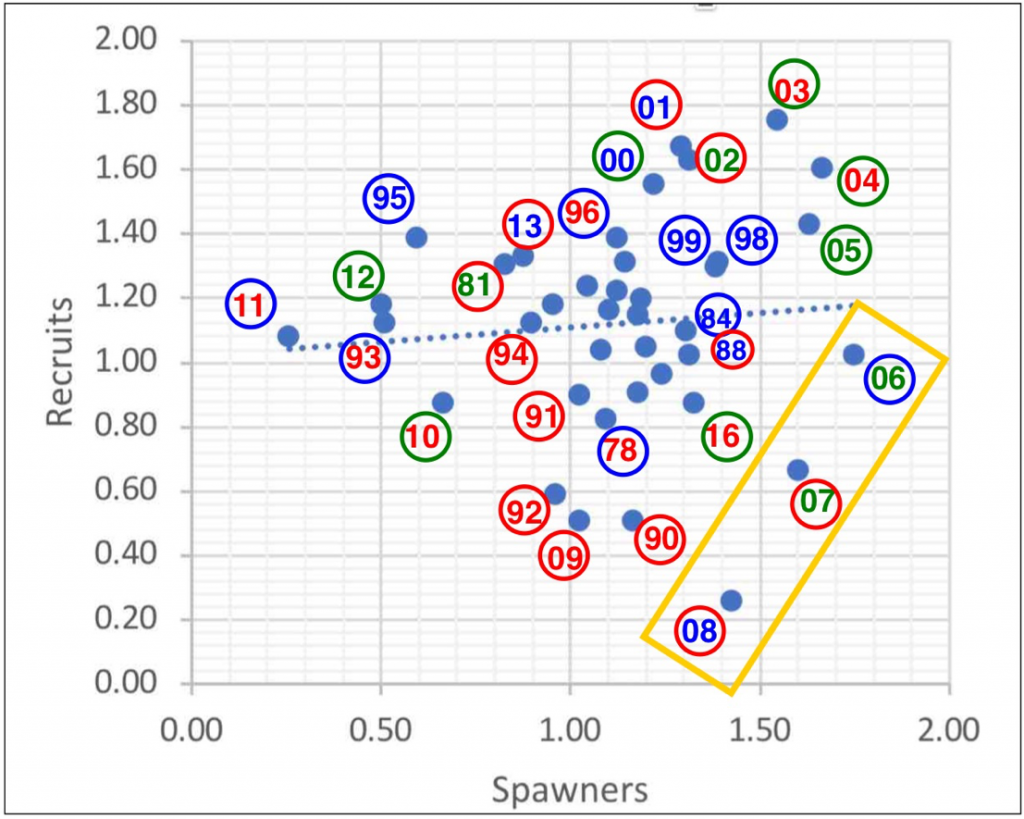
Figure 4. Recruits (escapement in numbered year) per spawners (escapement three years earlier) for years 1978 to 2016 (log10 transformed). Red number denotes rearing conditions in a dry water year two years earlier. Red circle denotes dry water year in spawning year. Green denotes normal water year. Blue denotes wet water year. For example: Spawning year 2011 had dry rearing conditions in 2009, wet year during its spawning run in 2011, and the lowest number of parents in 2008. Orange rectangle represents years having poor ocean rearing conditions. Note that for recruit years 00-04, hatchery smolts were trucked to Bay acclimation pens (1998-2002), whereas in 03 to 05 they were trucked to Bay for direct release or to Delta pens.
Another Fall-Run Salmon Crash – Bad Ocean Conditions Again? Or Bad River/Delta/Bay Conditions?

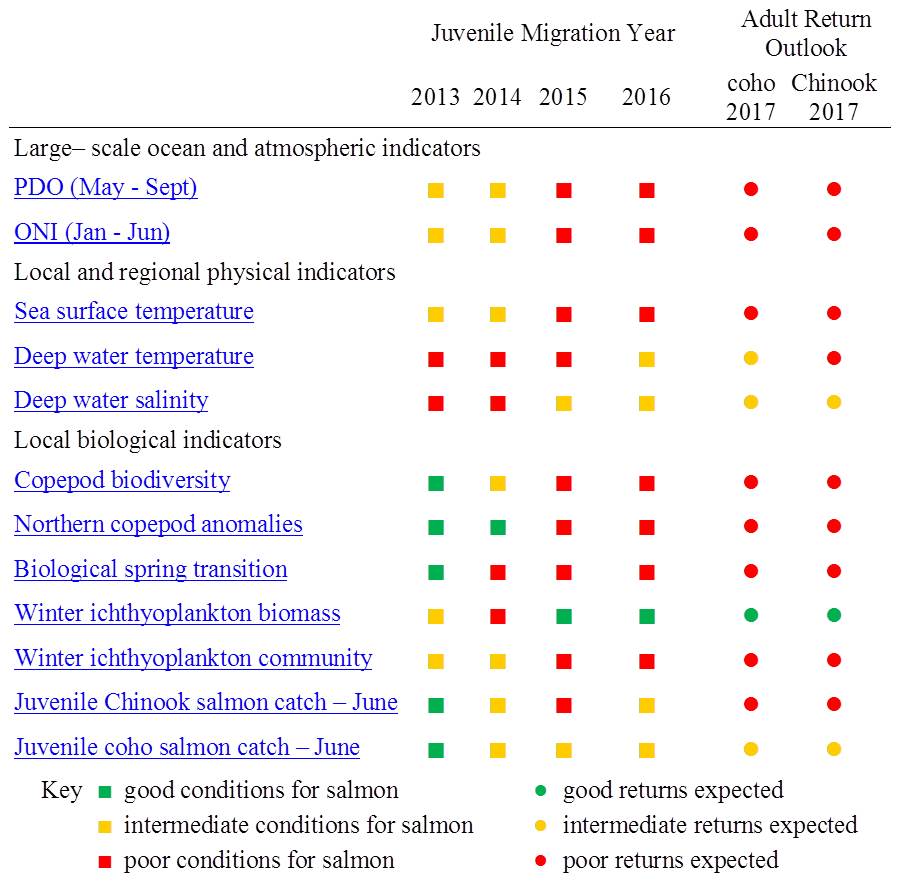
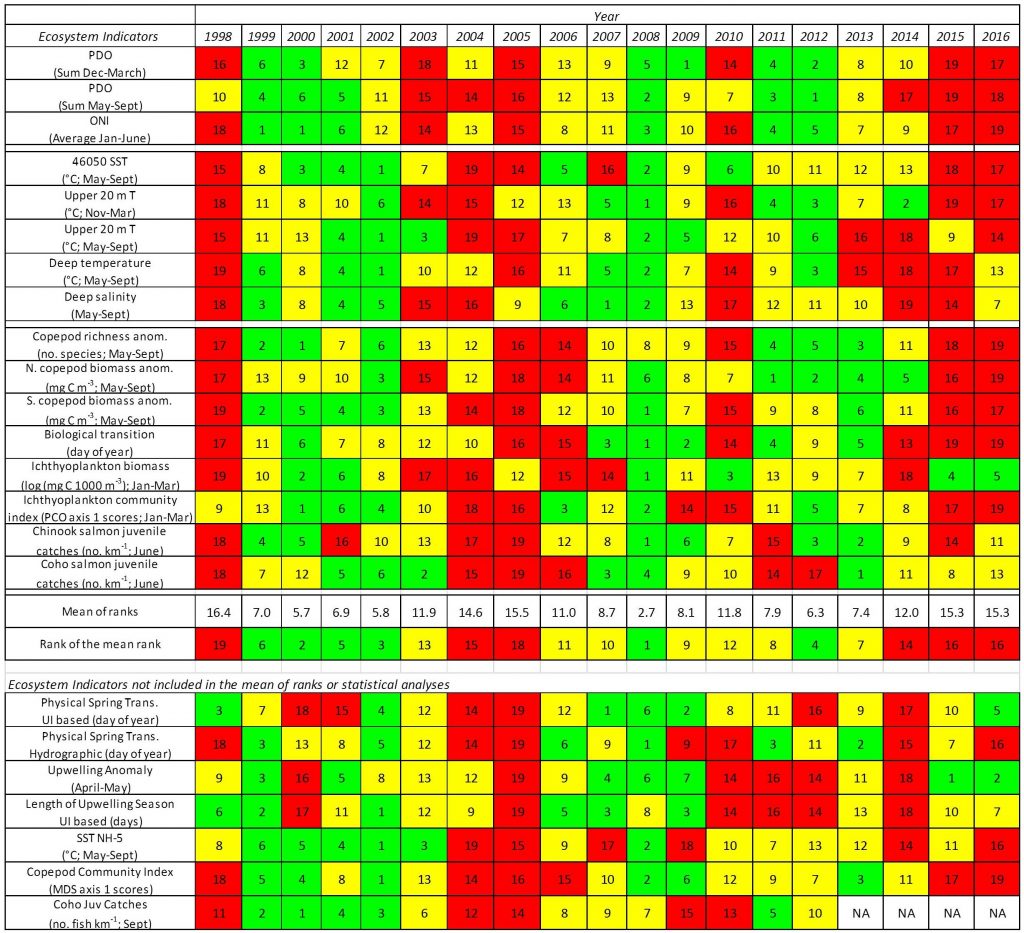
NOAA Fisheries’ Northwest Fisheries Science Center states on its website1: “Similar to 2015, many of the ocean ecosystem indicators suggest 2016 to be another poor year for juvenile salmon survival, the second consecutive year of poor ocean conditions. The PDO2 was strongly positive (warm) throughout 2016, coinciding with the continuing of the anomalously warm ocean conditions in the NE Pacific initiated by the “The Blob” that began in the fall of 2013. Strong El Niño conditions at the equator also persisted throughout 2015 until May of 2016. Sea surface and upper 20 m water temperatures off Newport Oregon remained warmer than usual (+2°C) throughout most of 2016 continuing two consecutive years of anomalously warm ocean conditions.” See Figures below and at end for more details from NMFS presentation.

Mother Nature has once again dealt California salmon a deadly set of circumstances. There is not much that can be done at this point, because much of this bad hand has already been played during the 2012-2016 drought and the bad ocean conditions in 2015 and 2016. Reduction of the 2017 sport and commercial fisheries has been prescribed again to save the patient. Cutting salmon harvest is like applying a tourniquet to an amputation, yet it is necessary. Have we not learned to better prepare for such circumstances?

Once again, the blame for poor resource management is being shifted to poor ocean conditions. Evidence clearly indicates that poor inland river, Delta, and Bay conditions were also a major factor in the poor survival of salmon during the recent drought. Furthermore, evidence indicates that the fall-run hatchery salmon populations that make up most of the commercial and sport fishing catch were sustained through the drought by the transport of hatchery smolts to the Bay avoiding the poor river and Bay-Delta conditions. There was very poor survival of smolts released near upriver hatcheries during the drought compared to smolts trucked to the Delta or the Bay. This is strong evidence that the rivers and Delta are the key factors in Central Valley salmon viability.3

The same circumstances occurred in the 2004-2008 period, leading to the 2008 “salmon crash”. First came a sequence of drier years, 2001-2005; two bad ocean years, 2004 and 2005; then a flood year 2006; followed by drought years 2007 and 2008. The salmon populations did recover with better runs in 2012 and 2013 because of normal-wet river conditions in 2010-2012 and good ocean condition in 2010-2013, but the runs have since declined sharply, beginning in 2014 and culminating in the expected 2017 crash. So far, the 2017 fishery is better than expected because of the expanded hatchery transport efforts in 2014. The prognosis is not as good for the wild salmon that were not trucked to the Bay.

Declining runs in the drought years 2014 and 2015, poor young production from 2013-2015, and the poor run of two-year-old (jacks) from brood-year 2014 in 2016 are indicators of a population crash. The brood-year 2014 jacks were the consequence of cumulative bad conditions: (1) in their spawning run (summer-fall 2014), (2) during incubation and first year rearing-emigration (winter-spring 2015), (3) during their first two summers in the ocean (2015-2016), and (4) poor conditions during their run from the ocean in summer-fall 2016 from the drought hangover. Three-year-olds from the 2014 brood year are also expected to return in poor numbers in 2017, because of droughts during their parents’ spawn, poor river rearing conditions (2015), and then poor ocean conditions in 2015 and 2016.

The prognosis for brood-years 2015-2017 (2018-2020 runs) is not good for some of the same reasons, especially the expected poor numbers of spawners. These runs will carry hangovers from poor river and ocean conditions in 2015 and 2016.

One thing is lessening the overall effect on fisheries: trucking hatchery smolts to the Bay. While that is not helping the wild salmon populations in the Central Valley, or those hatchery populations not included in the trucking program, it is helping.

What can be done to improve all the salmon populations in the Central Valley?

  1. Reduce harvest of adults in ocean and rivers (being implemented).
  2. Increase hatchery production (take more eggs and rear more smolts).
  3. Diversify hatchery smolt production by rearing some fry in natural floodplain habitats.
  4. Increase hatchery smolt survival by trucking and barging to the Bay and pen acclimating in the Bay.
  5. Improve migration and pre-spawn holding conditions for wild and hatchery adult spawners by maintaining spring-fall migration conditions (flow and water temperatures) in lower rivers and spawning reaches.
  6. Maintain adequate water levels and water temperatures to sustain eggs and embryos until hatching and emergence.
  7. Provide optimum flows and water temperatures in rearing areas for growth and survival (minimize predation).
  8. Provide flow pulses to attract spawners to spawning rivers below major rim dams.
  9. Provide winter and spring flow pulses to stimulate juvenile emigration and to provide floodplain rearing opportunities.
  10. Limit South Delta exports during late fall to spring peak emigration periods.

With so many factors potentially affecting salmon survival and production, it is hard to say which of these prescriptions will be most effective. We should focus on doing them all, at least in this plentiful water year (2017).

Ocean condition indicators 1999-2016. Source: see footnote 1.
Red = poor conditions. Green = good conditions. Yellow = intermediate conditions.

MWD’s Dreams: a Nightmare for Fish

The Metropolitan Water District of Southern California, commonly known as MWD, recently released a series of information papers on the California WaterFix (Delta Tunnels). In this first in a series of posts I address MWD’s “assessment” of what will happen to the Bay-Delta environment and fish community if the WaterFix is built and operated.

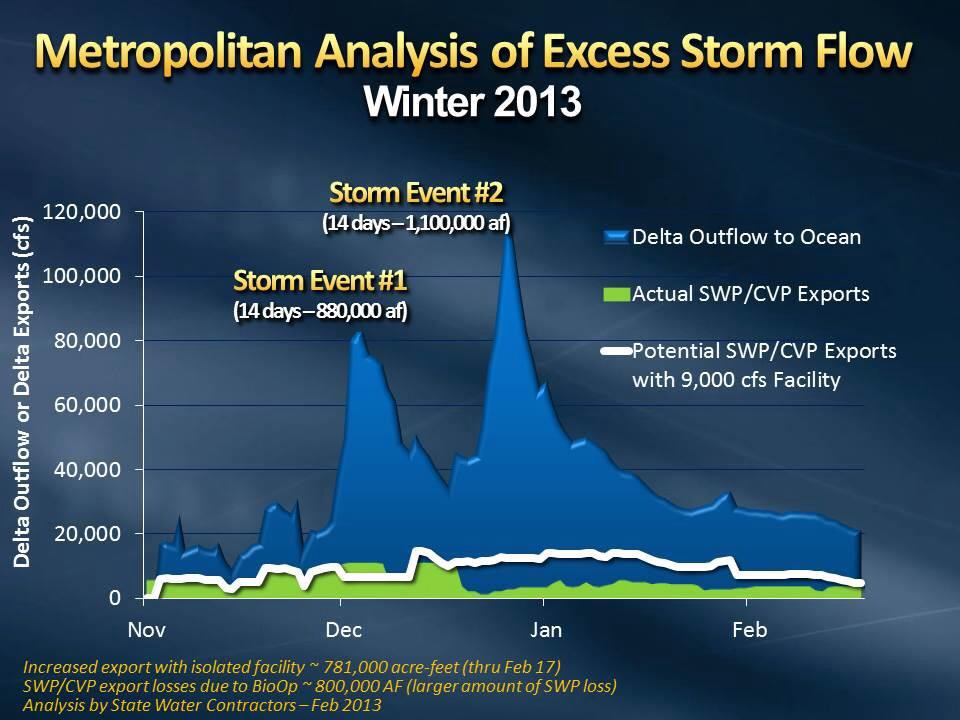
One figure from MWD’s papers demonstrates the primary flaw in its assessment.

This key figure from the MWD’s papers accurately portrays the WaterFix’s potential “benefit.” But it leaves out the back story. The “uncontrolled” winter flows from Mother Nature’s few-and-far-between miracle rain events in drought years like 2013, as portrayed in the figure, were long ago allocated to the Bay-Delta as a small compensation for all the water taken from potential Bay inflow not shown in the chart.1 The proposed new WaterFix exports shown by the white line would take a good-sized bite out of what was left for the Bay. The proposed Sites Reservoir would take another large bite.

What is not shown is that this increase in export water would come from un-dammed tributaries to the Sacramento River such as Cow, Cottonwood, Battle, Deer, and Mill creeks, and the partially dammed Yuba and Cosumnes rivers. Most of the total inflow to the Valley from the storms shown on this graph was captured and stored in the large reservoirs on the main rivers (Sacramento, San Joaquin, Feather, American, Mokelumne, Stanislaus, Tuolumne, Merced, and Trinity), before it ever got to the Delta. Diversions to storage and exports from the Valley captured over 20 million acre-ft in Water Year 2013, including carryover storage.

It is true that exports from the south Delta were only about 2 million acre-ft for water year 2013: export water rights are among the last in line, especially in very dry years. About 2 million acre-ft, roughly the same amount of water as exports, flowed to the Bay from the uncontrolled winter flow. The other Delta outflow for the year was water that was released from storage to repel salinity and thus keep water for exports and Delta farming fresh enough to use.

The caption at bottom left of the figure attributes the loss of 800,000 acre-ft to biological opinions for fish, and suggests that WaterFix would “recover” these “losses.” The “loss” is not real and “recovery” of this water would only be possible at the further expense of fisheries already in collapse. The present (and past) restrictions on exports are needed to protect (1) the tens of millions of young hatchery and wild salmon and steelhead moving from rivers to the Bay-Delta and ocean during the flow pulses, and (2) the spawning runs of Delta and longfin smelt, which are also keyed to the flow pulses. Screening the WaterFix intakes is not going to protect the flow needs of the fish that depend wholly on the storm flows moving through the Delta to the Bay and ocean.

  1. Past water rights and water quality control plans, as well as various water project operating agreements, recognized the important role played by uncontrolled Delta inflows and outflows. Qualifiers to such agreements commonly stated that further allocation or access to these uncontrolled would not be made without careful review of the environmental consequences.

Are Hot Rivers in Summer the New Norm?

The much anticipated salmon season opener on the Sacramento River will be a bust, just as it was last year.

USA Fishing reports on July 15, 2017: “The Central Valley rivers open to salmon fishing on Sunday July 16th. The good news is that reservoirs are full and we have cold water and much higher releases than we have seen (for the opener) in years.”

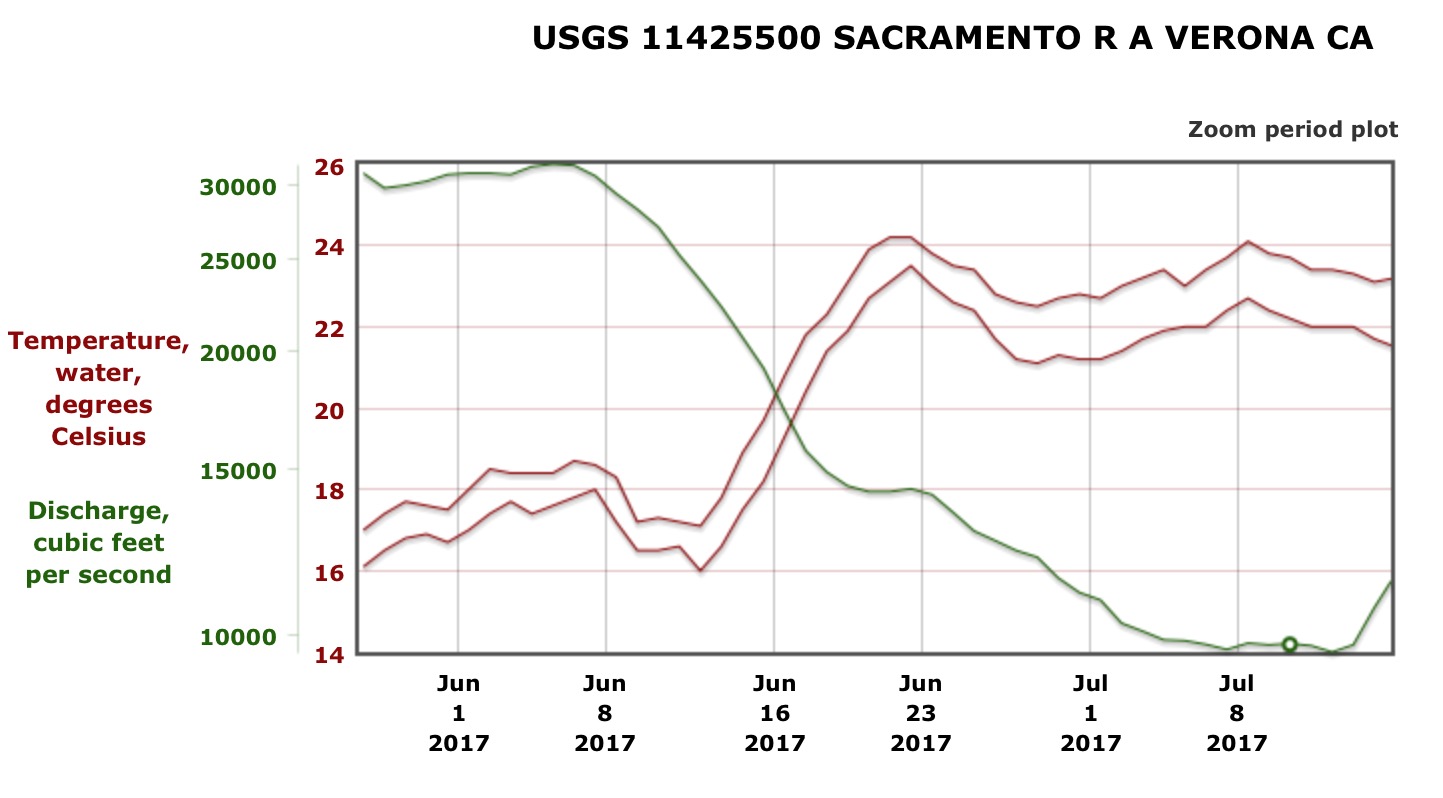
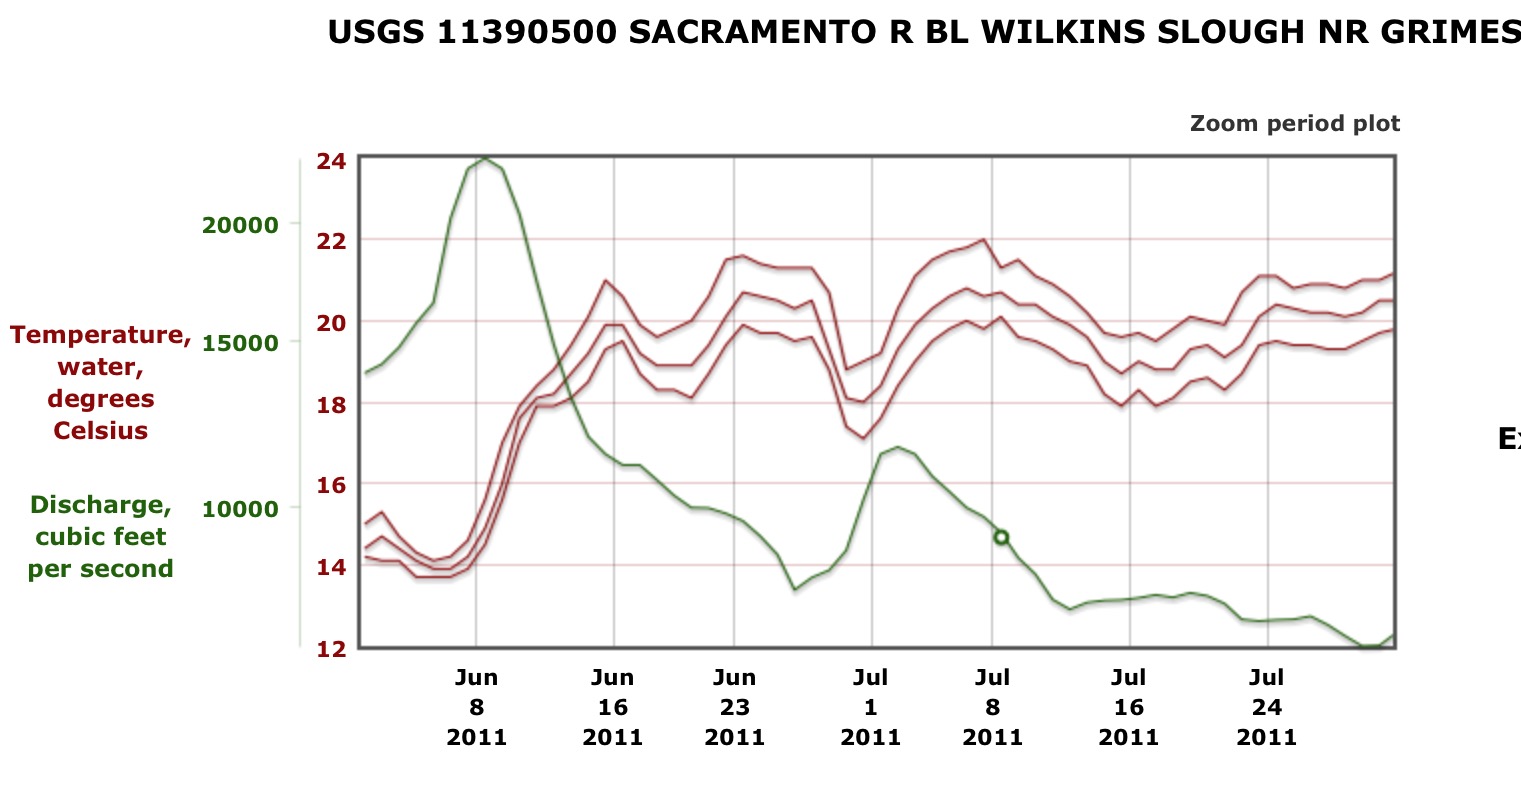
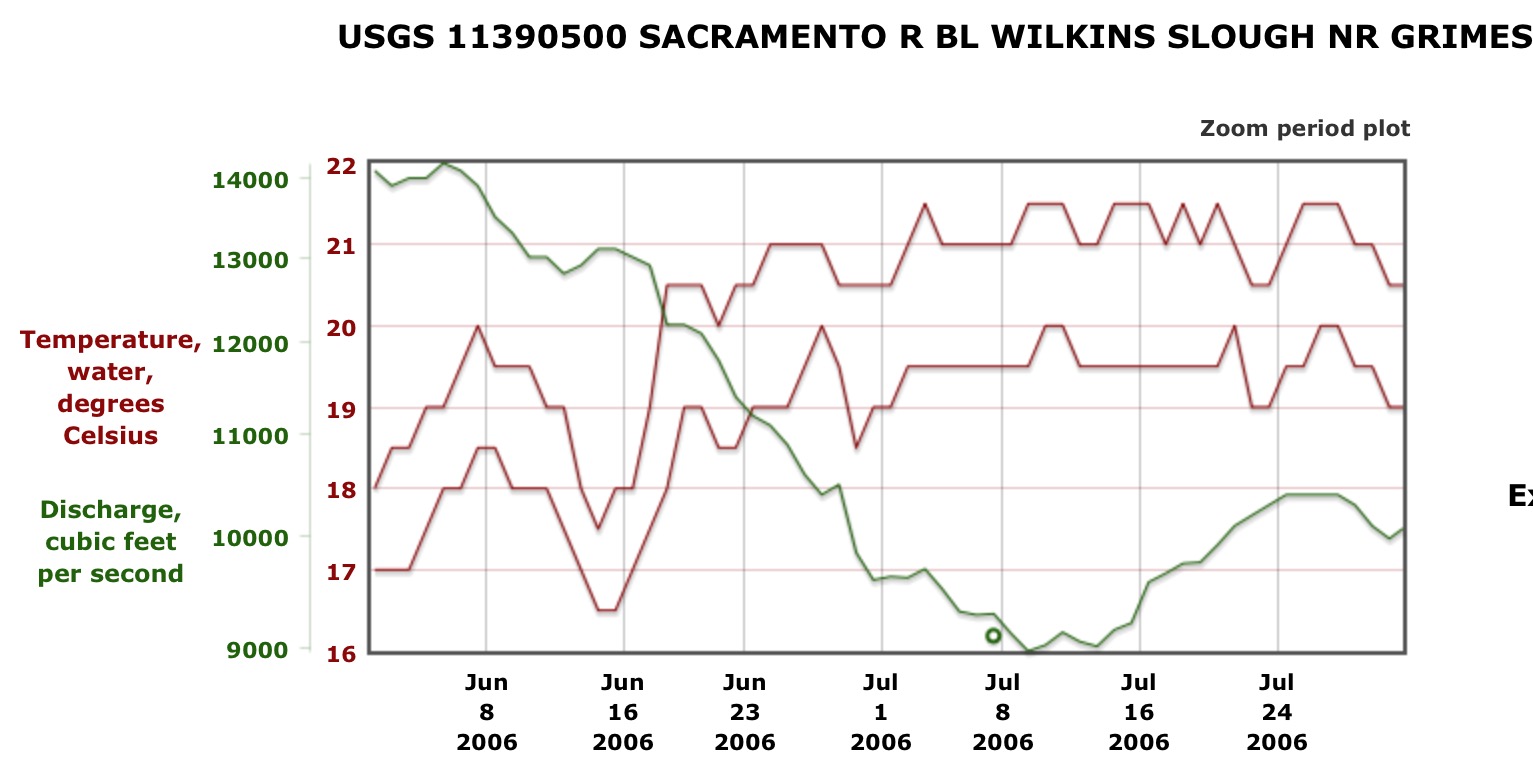
The sad news is that despite record inflow to reservoirs, the “new norm” in the lower Sacramento River is low water, high water temperatures, and no salmon during summer. This “new norm” is a consequence of the fact that federal and state regulators have changed the rules as they are applied on the ground, with little or no public input. Federal EPA and State water quality standards are no longer being enforced. The summer 68oF limit for the lower Sacramento River between Red Bluff and the Delta no longer applies. The “new norm” is 72-75oF (22-24oC), as is evident in Figures 1 and 2, below. This new norm is in direct contrast to 2006 and 2011, the last two wet years (Figures 3 and 4). The apparent reason is an absolute prioritization of using Shasta Reservoir storage for water contractors and winter-run salmon. Fall-run salmon, the backbone of ocean and river salmon fishing alike, no longer rate protection. Shasta Reservoir is just about full, but the Bureau of Reclamation is using none of the water stored there to maintain water temperatures in 200 miles of the lower Sacramento River.

Why are flows and water temperatures important in the lower 200 miles of the Sacramento River? In spring, millions of upper river hatchery and wild salmon and steelhead smolts pass through the lower river on their way to the ocean. Also in spring, white and green sturgeon spawn and rear in the lower river. Adult winter-run and spring-run salmon also pass upstream through the lower river during the spring on their way to upper river and tributary spawning grounds. In summer, adult fall-run salmon begin their upstream run in July, with a peak in August-September. The lower river is home to rearing juvenile salmon, steelhead, and sturgeon all summer; high water temperatures and low flows are detrimental to their survival and favorable to predators. High water temperatures and low flows in the river also increase the likelihood of higher water temperatures and lower flows through the Delta to the Bay, leading to poorer survival of longfin smelt, Delta smelt, and other native Delta fishes.

Figure 1. Water temperature (daily high and low) and flow at Wilkins Slough of lower Sacramento River, June-July 2017. Source for all figures: https://waterdata.usgs.gov/nwis/

Figure 2. Water temperature (daily high and low) and flow at Verona of lower Sacramento River, June-July 2017.

Figure 3. Water temperature (daily high, median, and low) and flow at Wilkins Slough of lower Sacramento River, June-July 2011.

Figure 4. Water temperature (daily high and low) and flow at Wilkins Slough of lower Sacramento River, June-July 2006.

Delta Status End of June 2017

Despite the fact that it is a record wet year with abundant spring snowmelt, early summer conditions in the Delta in 2017 are not looking good.  Rapidly falling Delta inflows and a late June heat wave have led to salt water intrusion and extremely warm water temperatures detrimental to salmon and smelt throughout the Delta.

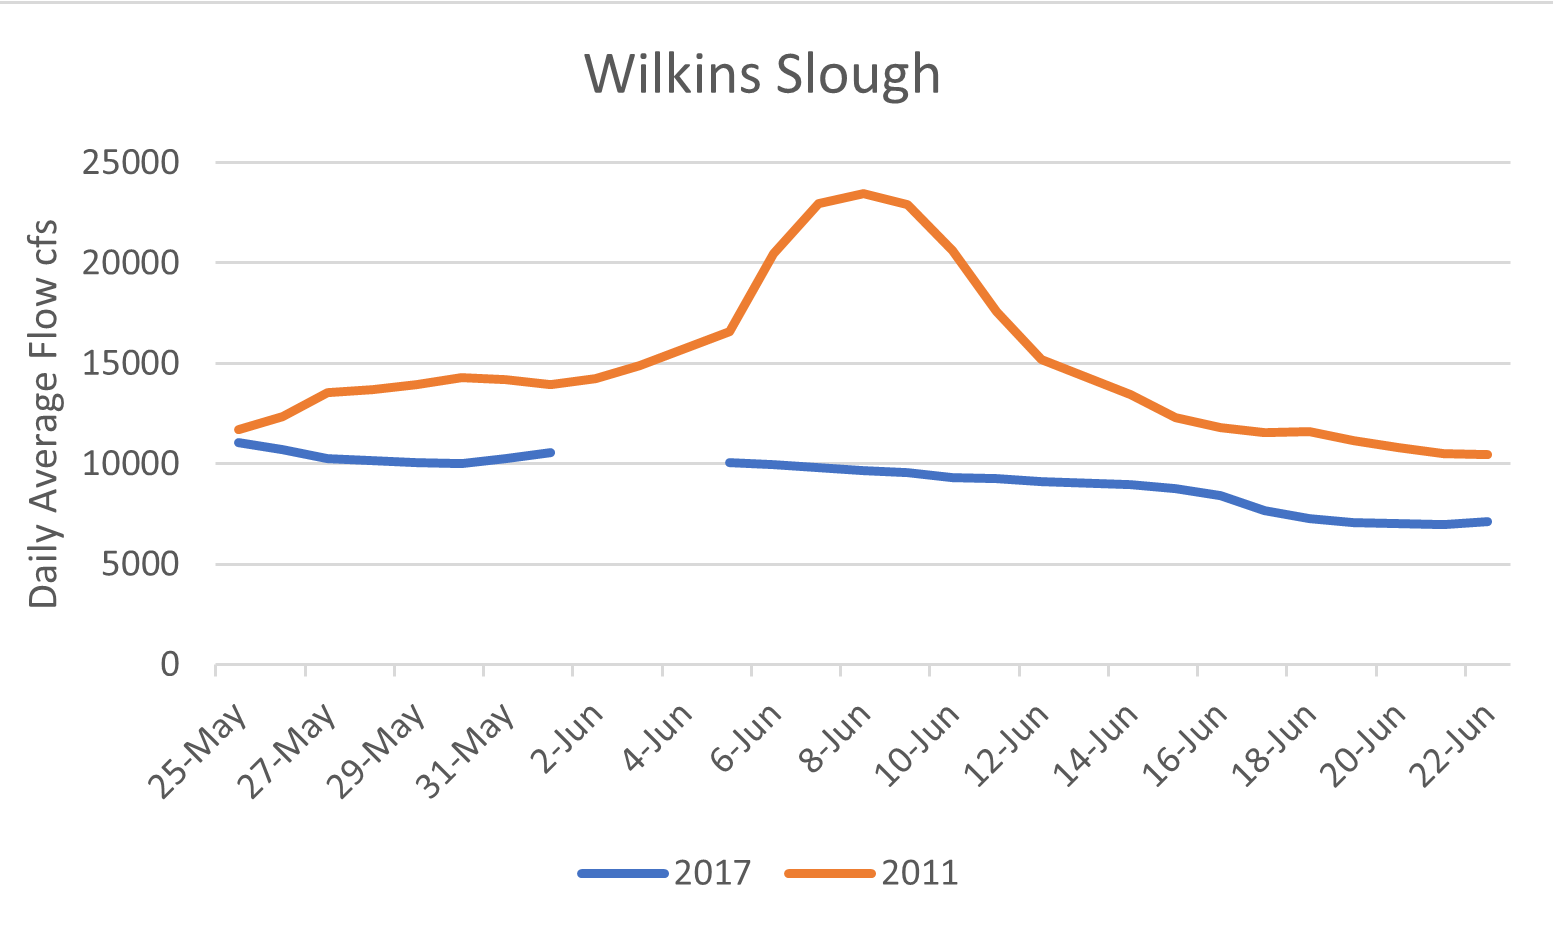
Notably, lower Sacramento River flows at Wilkins Slough upstream of the mouth of the Feather River are down about a third compared to the last Wet year, 2011 (Figure 1).  Flow is only about 7000 cfs and water temperatures are 73-75°F, well above the water quality standard of 68°F.  Winter-run and spring-run adult salmon will not move up the river at these temperatures.  Why is flow so low?  Good question.  Shasta is nearly full but releases are down about a third for a wet year at 8000 cfs.  In contrast, the San Joaquin River flow coming into the Delta near Stockton is 13,000-15,000 cfs, with water temperatures of 71-73°F.

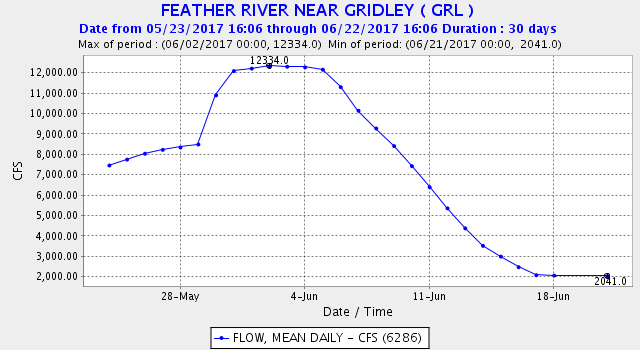
Feather River flow contributions to the Sacramento River are very low (Figure 2).  Yuba and American River flow contributions remain strong at about 4000 cfs each.

Overall Delta outflow in late spring 2017 is lower than Wet year 2011 (Figure 3).  Delta inflow is approximately 34,000 cfs, with about equal contribution from the Sacramento and San Joaquin rivers. Delta exports have been maximum through June at 11,400 cfs.  With in-Delta use taken into account, Delta outflow is estimated at 19,000-21,000 cfs. (Note: USGS measured outflow about 14,000 cfs with tides taken into account on June 22.)

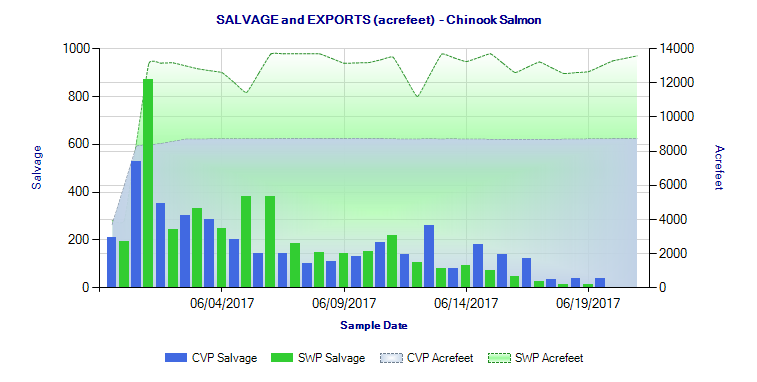
With sharply falling Delta inflow and outflow, high exports, and the heat wave, the Delta is unusually warm at 72-75°F. Such temperatures are detrimental to juvenile smelt, salmon, and sturgeon survival.  Juvenile salmon have been present in the Delta well into June on their seaward migrations (Figure 4).

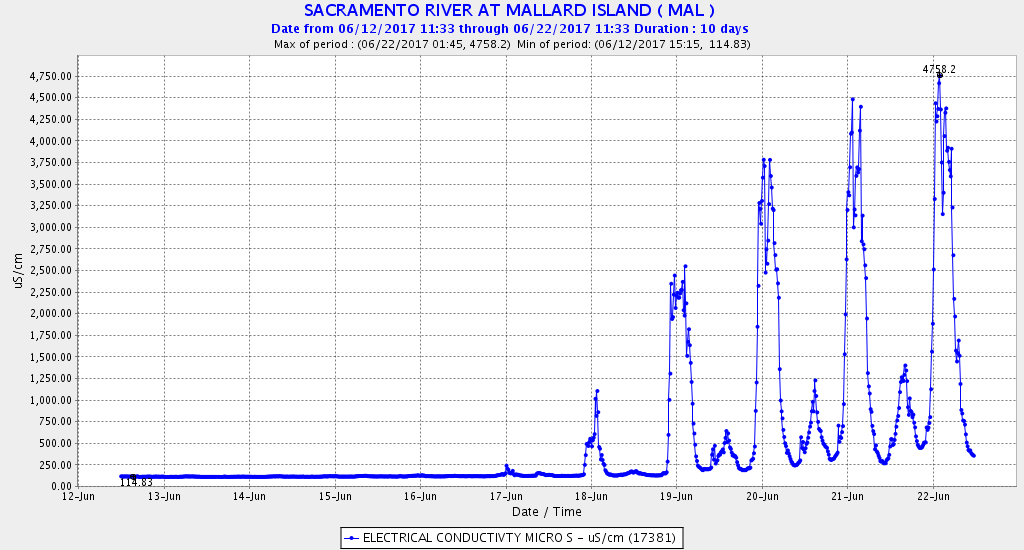
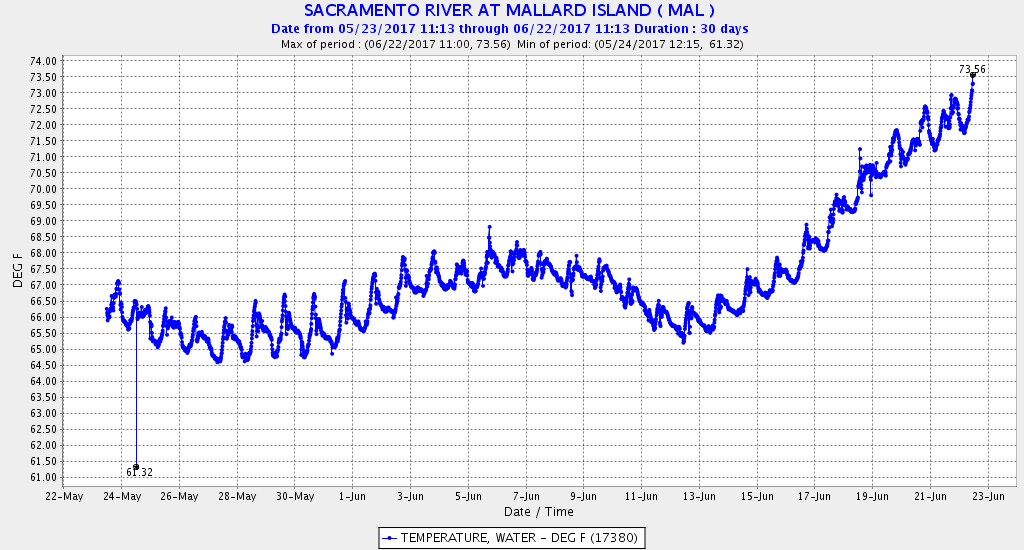
 With falling Delta inflow and high exports, the Delta is stagnating and salt water is intruding at the west end at Chipps Island (Figure 5).  The Low Salinity Zone with the few Longfin and Delta smelt that are left is moving into the Delta on incoming tides.  The water temperature at the head of the LSZ is already 72°F (Figure 6).  Higher temperatures would be very detrimental to surviving smelt and seaward-moving juvenile salmon.  The further east the LSZ moves, the warmer it usually becomes.

There is a consistent late spring pattern in the operation of State Water Project and Central Valley Water Project in which they cut reservoir releases while exporting the remnant freshwater pool in the Delta.  Even in this very wet year we are again witnessing this water supply control strategy.  The problem is the rivers get too warm even to the point of violating water quality standards.  With less water and warmer water entering the Delta, the Delta also becomes too warm.  Delta water quality standards and endangered species permits are supposed to keep this from happening.  Come July 1, conditions will only get worse, especially as snowmelt declines and San Joaquin flows drop sharply.

What can be done?  Both Shasta and Oroville reservoir releases are lower than normal.  Just keeping their cold-water releases near normal and allowing the flows to pass through the Delta would nearly fix the problem.  Exports in the 1970’s and 1980’s were limited to 6000-9000 cfs in June-July of Wet years.  Reducing the present export level of 11,000 cfs would also help.  These would be very reasonable actions given present water supplies in the Central Valley.

Figure 1. Flow in the lower Sacramento River at Wilkins Slough in late spring of 2011 and 2017.

Figure 2. Lower Feather River flow at Gridley upstream of the mouth of the Yuba River.

Figure 3. Delta outflow in late spring 2011 and 2017.


Figure 4. Salmon salvage at Delta fish facilities in June 2017. Source: https://www.wildlife.ca.gov/Conservation/Delta/Salvage-Monitoring

Figure 5. Salinity (EC) at Mallard Island gage near Chipps Island (eastern end of Suisun Bay) in June 2017.

Figure 6. Water temperature at Mallard Island gage near Chipps Island (eastern end of Suisun Bay) in June 2017.