Over the past few months, I wrote posts on the status of specific runs of salmon in rivers throughout the Central Valley. In this post, I describe the overall status of salmon runs and the general actions to take to increase both escapement and fish available for commercial and sport harvest.
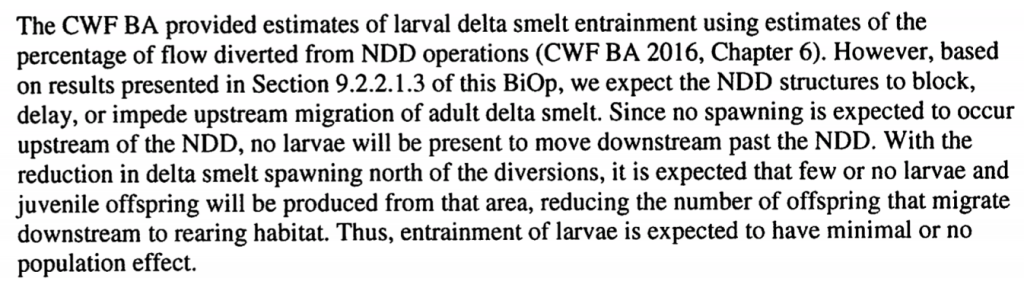
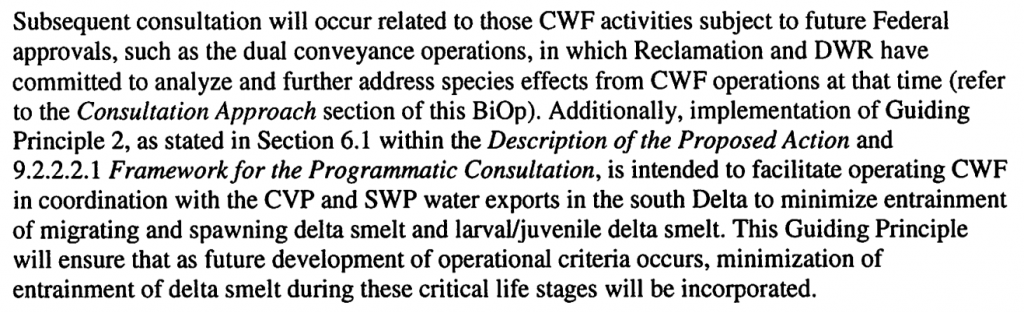
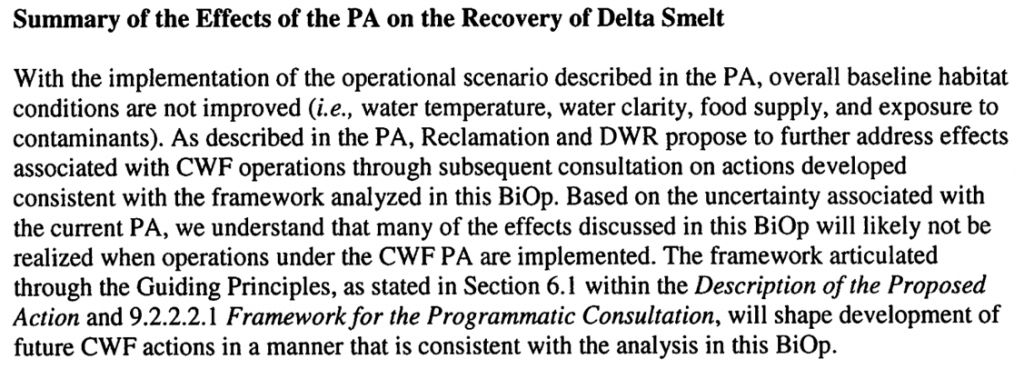
It was just over a decade ago that there were nearly one million adult salmon ascending the rivers of the Central Valley (Figure 1). At the same time, there were a millions more Central Valley salmon being harvested each year in sport and commercial fisheries along the coast and rivers of the Central Valley. Improvements in salmon management in the decade of the 1990s by the Central Valley Project Improvement Act, CALFED, and other programs had paid off handsomely with strong runs from 1999 to 2005. New and upgraded hatcheries, along with trucking hatchery smolts to the Bay, significantly increased harvest and escapement to spawning rivers.
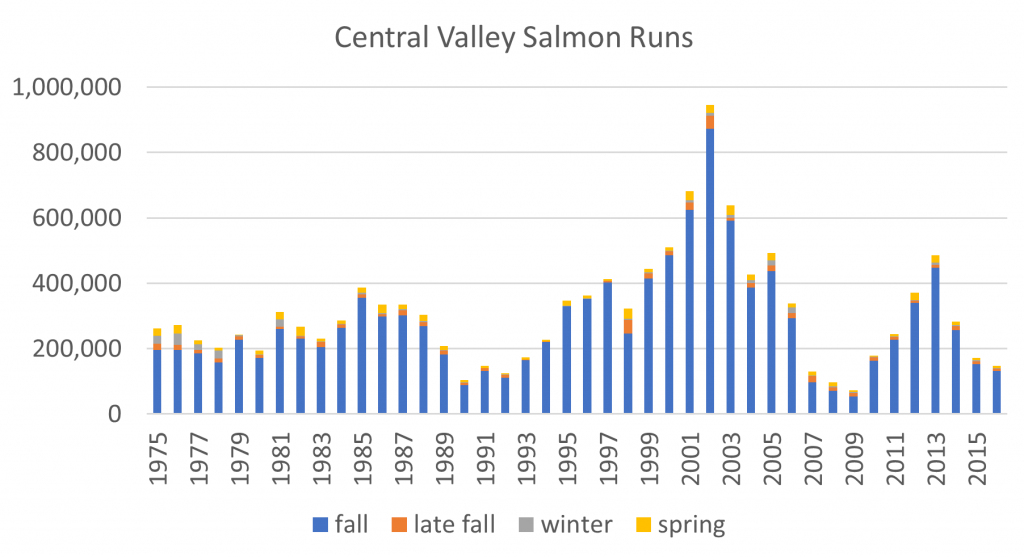
Figure 1. Central Valley salmon runs from 1975 to 2016 including fall, late fall, winter, and spring runs. Source of data: CDFW GrandTab.
By 2008-2009, escapement had fallen by over 90% to a mere 70,000 spawners of the four races of salmon. Fishery harvests were greatly restricted by 2008. The winter run, the most threatened of the four runs fell from 17,296 to 827 spawners in just five years. Drier years from 2001-2005, poor ocean conditions in 2004-2005, record-high Delta water diversions, and the 2007-2009 drought were contributing factors in the declines. Impacts to coastal communities and the fishing industries were severe.
Extraordinary recovery measures included closing fisheries and trucking most of the hatchery smolt production to the Bay or Delta. Federal salmon biological opinions (2009, 2011) limited winter-spring water-project exports from the Delta. Hundreds of millions of new dollars were spent on habitat and fish passage improvements in the Valley to increase salmon survival and turn around the declines in runs. A look at Figure 1 indicates that these efforts proved effective in limiting run declines from the 2012-2015 drought compared to the 1987-1992 and 2007-2009 droughts.
However, the prognosis for the future is again bleak, especially for wild, naturally produced salmon. The consequences of the 2012-2015 drought have not fully played out. Once again, projected runs are low, and harvests are likely to be restricted. Actions are needed to minimize long-term effects and to help bring about recovery of wild salmon productivity and fisheries in general.
Actions for 2018:
- Reduce harvest: Sadly but necessarily, the Pacific Fisheries Management Council and states are likely to take this first step of– restricting the 2018 harvest in the ocean and rivers to protect wild runs.
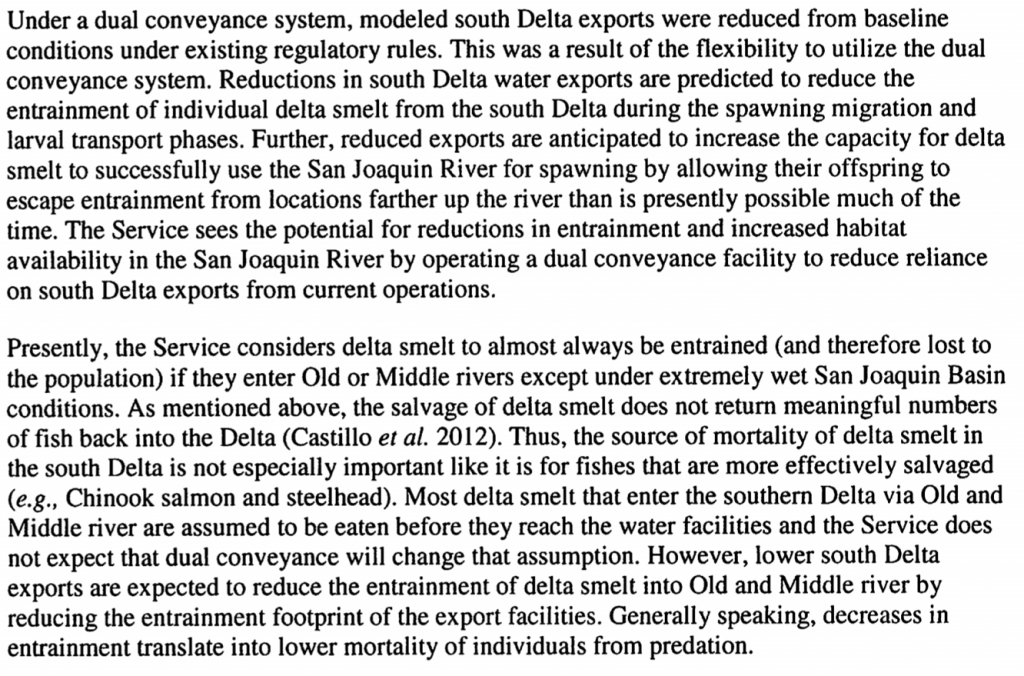
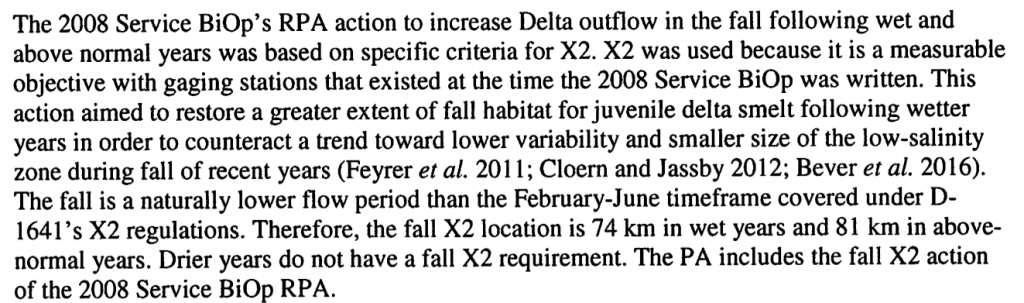
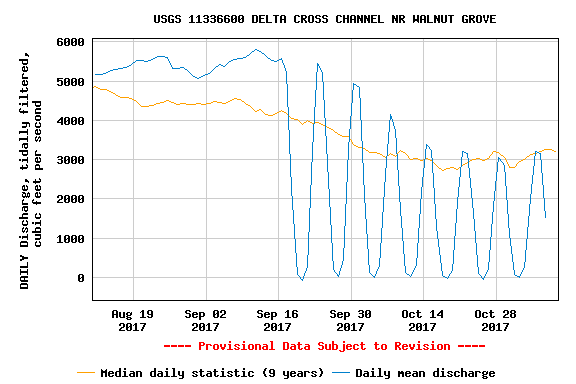
- Improve spawning, rearing, and migrating conditions: Sadly, this past year’s rearing and migrating conditions in the Sacramento River were unnecessarily compromised. Water temperature at Red Bluff reached above the 56oF prescribed in the biological opinion and Basin Plan. The higher temperatures resulted from low Shasta Reservoir releases (less than 5000 cfs – Figure 2) despite a virtually full Shasta Reservoir. The low flow and higher water temperatures likely affected salmon egg incubation, rearing, and emigration-immigration success. Reservoir releases will be necessary to meet flow and temperature targets in all Central Valley rivers and the Delta.
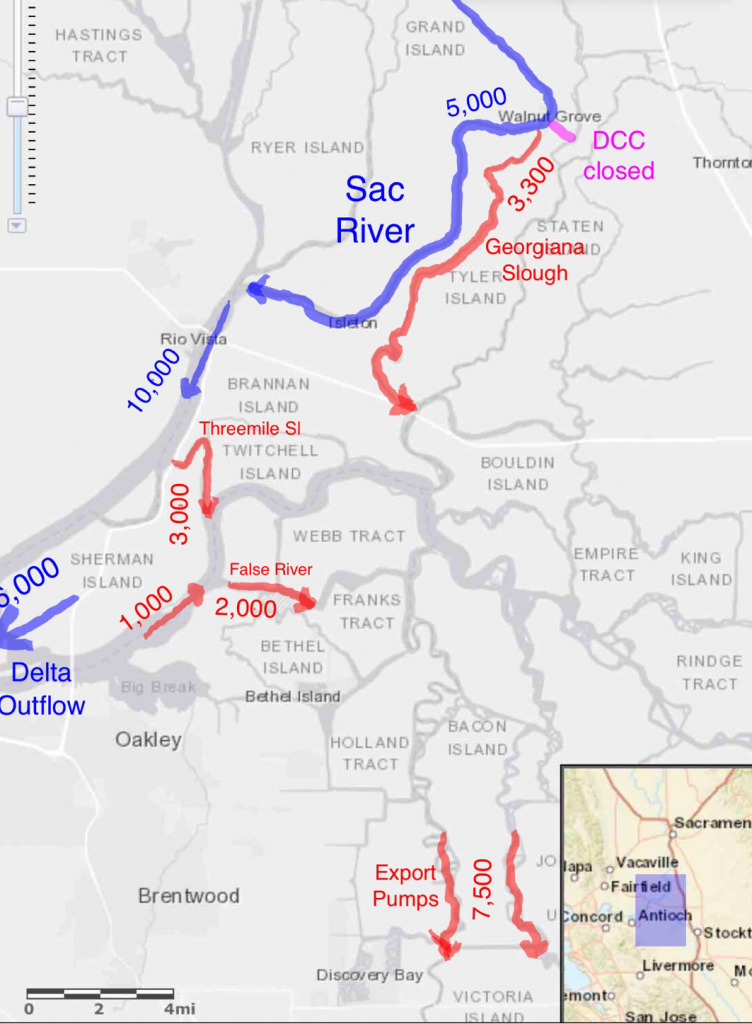
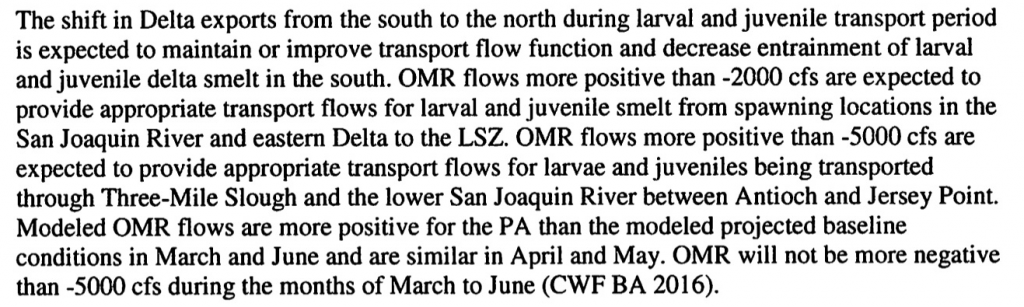
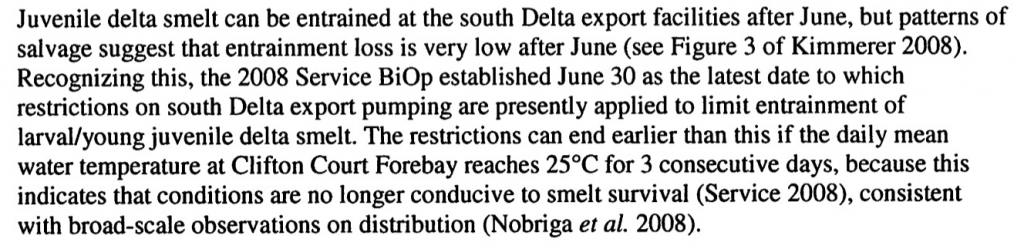
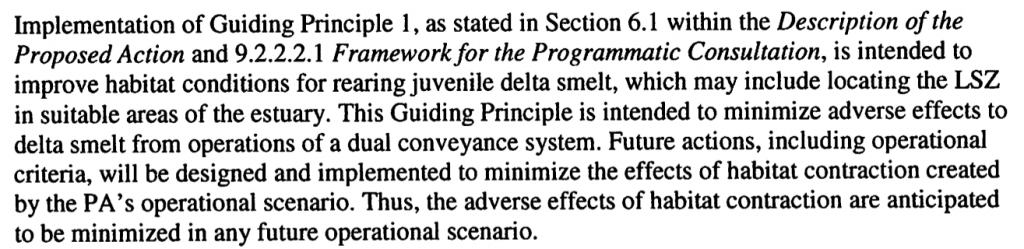
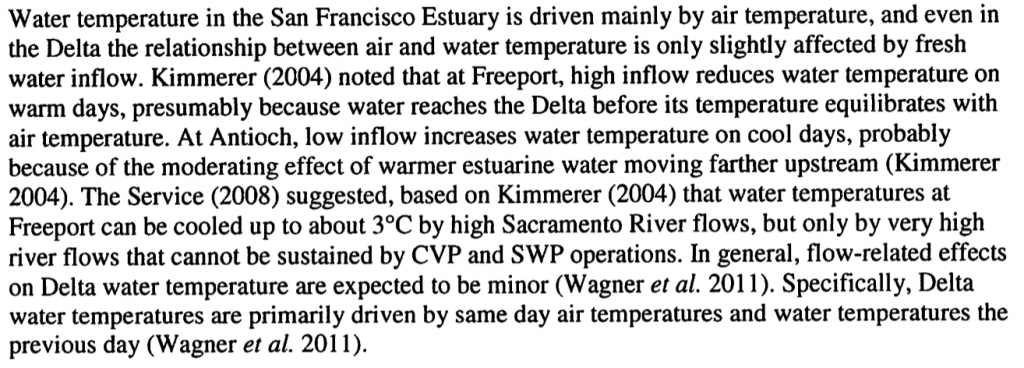
- Limit Delta exports: Delta exports this past spring reached unprecedented highs not seen in recent decades, resulting in high salmon salvage rates at the Delta fish facilities (Figure 3).1 With high water supplies from this past wet water year 2017, there will be high exports again unless there are some constraints. If anything, winter-spring exports should be reduced to allow salmon to recover. April-May exports should be reduced, like they were in the 1990’s and 2000’s, to 1500 cfs.
Near term actions over the coming year:
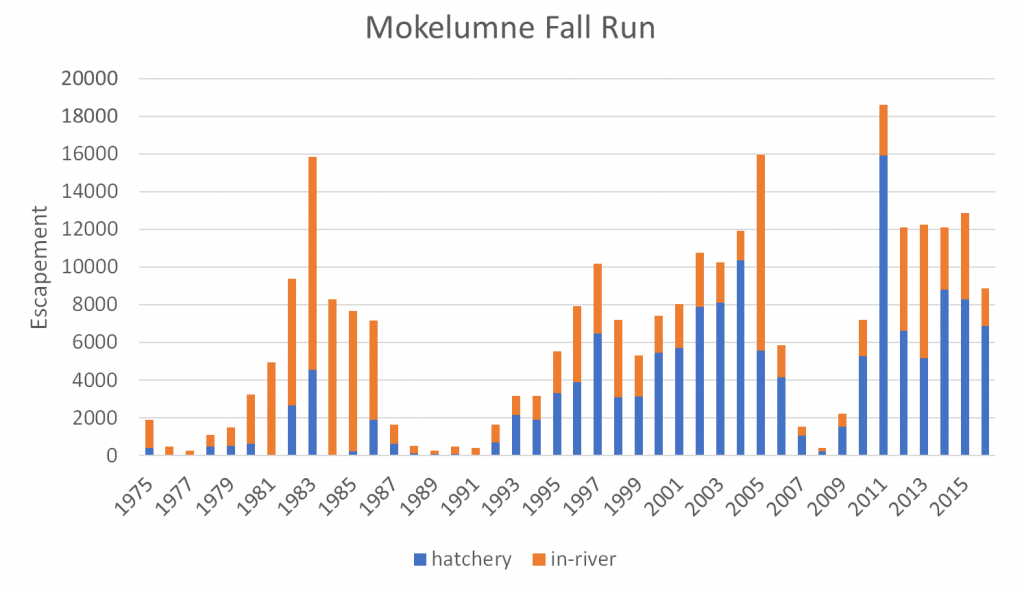
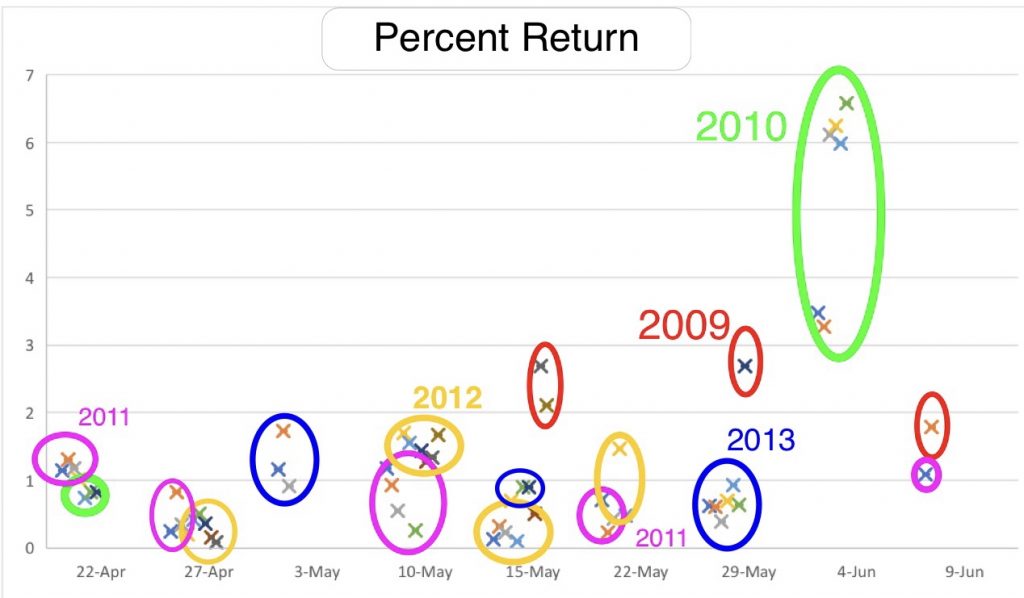
- Transport hatchery smolts to Bay: The transport of millions of fall-run smolts from state hatcheries on the Feather, American, and Mokelumne rivers to the Bay provides higher rates of escapement and contributions to the fishery and low rates of straying. Barge transport to the Bay offers potentially lower rates of predation and straying for federal hatcheries near Redding.
- Raise hatchery fry in natural habitats: Recent research indicates that rearing hatchery fry in more natural habitat conditions increases growth rates, survival, and contributions to escapement and fisheries. Raising hatchery fry in rice fields is one potential approach.
- Restore habitats damaged by recent record high flows in salmon spawning and rearing reaches of the Central Valley rivers and floodplains: In nearly every river, habitats were damaged by the winter 2017 floods, requiring extraordinary repairs and maintenance to ready them again to produce salmon.
- Take further actions to enhance flows and water temperatures to enhance salmon survival throughout the Central Valley: Actions may include higher base flows, flow pulses, or simply meeting existing target flow and temperature goals.
In conclusion, managers should take immediate actions to minimize the damage to salmon runs from the recent drought and floods, using this past year’s abundant water supply. They should avoid efforts to exploit the abundant water in storage for small benefits to water supply at the expense of salmon recovery, and should make every effort to use the water in storage for salmon recovery.
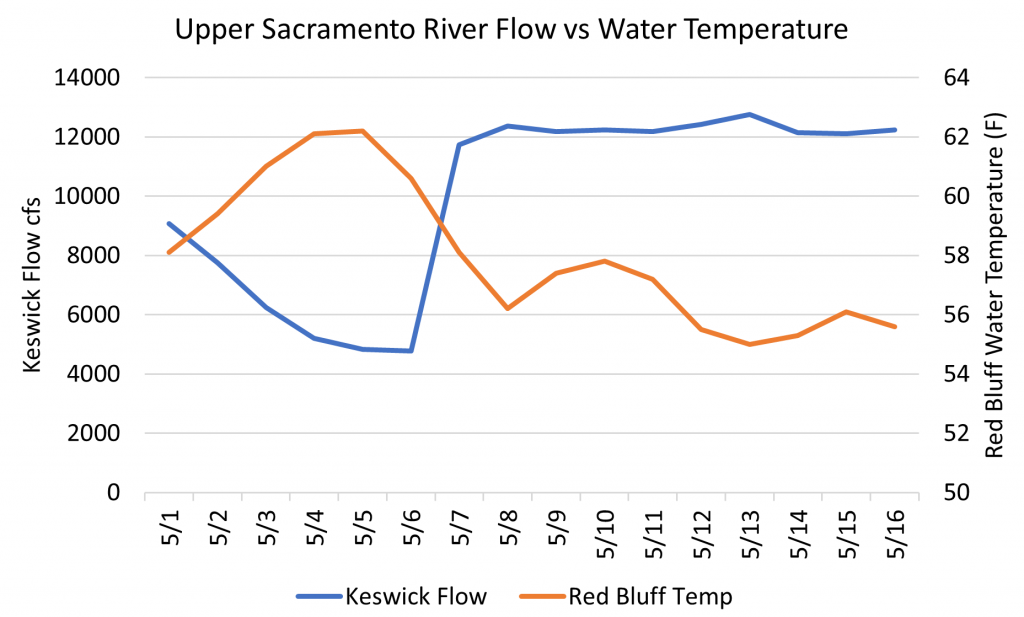
Figure 2. Upper Sacramento River flows and water temperatures in May 2017. The target water temperature for Red Bluff is 56oF. Source of data: USBR.
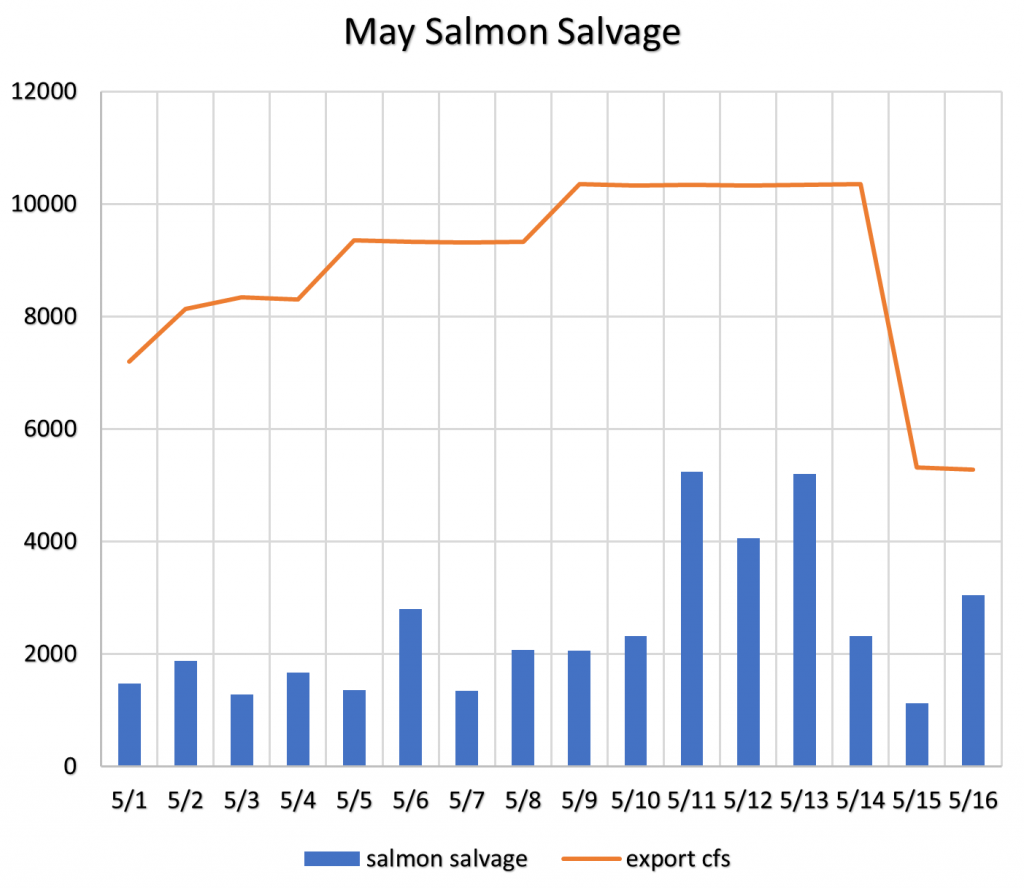
Figure 3. Export rate and young salmon salvage at South Delta federal and state export facilities in May 2017. The target export rate limit for May should be 1500 cfs. Source of data: USBR.