White Sturgeon Update
River and Bay/Delta water conditions during the Strawberry Moon make or break white sturgeon broodyear strength in the Central Valley. White sturgeon spawn in April and May in a one-hundred-mile reach of the lower Sacramento River between Red Bluff and Knights Landing. Sturgeon eggs and newly-hatched larvae need cool water 60-65oF to survive. Within a few weeks of spawning, juvenile sturgeon actively migrate downstream to the Delta during June as river flows drop and water temperatures increase. If flows are too low and water temperatures too high, the juvenile sturgeon cannot survive the journey to the Delta. Water conditions in the lower river and Delta during June determine the survival rates of juvenile sturgeon and whether they even make it to the Delta and eventually the Bay.
While only a portion of the adult white sturgeon spawn each year, a higher proportion of the adult sturgeon likely make the spawning journey from the Bay in the wetter years. Sporadic recruitment in wetter years is likely a function of high river flow attraction and good spawning and early rearing/emigration conditions (higher streamflow and lower water temperatures). Thus, wetter years are the key, and the wettest years like 2023 are best.
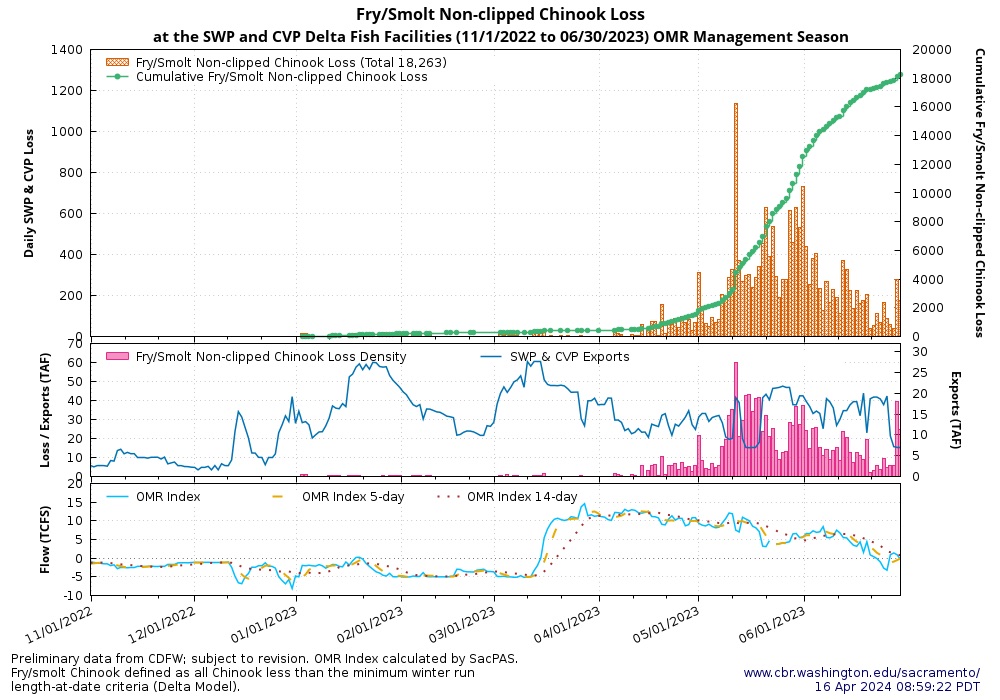
There is a paucity of information on the distribution and abundance of early life stages of white sturgeon in the Sacramento River. The best indicator of broodyear recruitment is the summer salvage numbers at the Delta pumping plants of the State Water Project (SWP) and Central Valley Project (CVP). In summer 2023, white sturgeon salvage numbers were consistent and relatively high (Figure 1) compared to other years. Export rates were also high – at maximum levels because of abundant available water (see Figure 1). Salvage numbers were also higher in 2023 than previous very wet years (2011 and 2017) that had similar high summer export levels (Figure 2).
In contrast, no juvenile sturgeon were salvage in summer of drought year 2022 (Figure 3). Conditions during the spawning and post-spawn periods in spring of drought years are simply too poor for any meaningful juvenile production. Flows in April-May 2022 were only a quarter of the 2023 flows (Figures 4 and 5). Water temperatures reached lethal levels (68oF) at the beginning of May 2022 compared to the beginning of June in 2023.
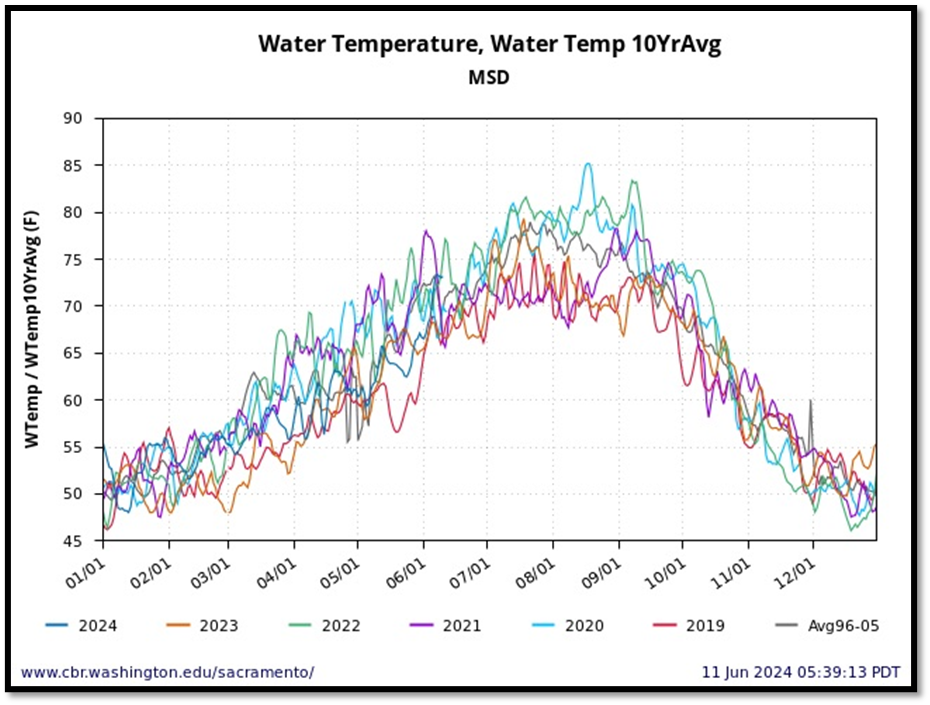
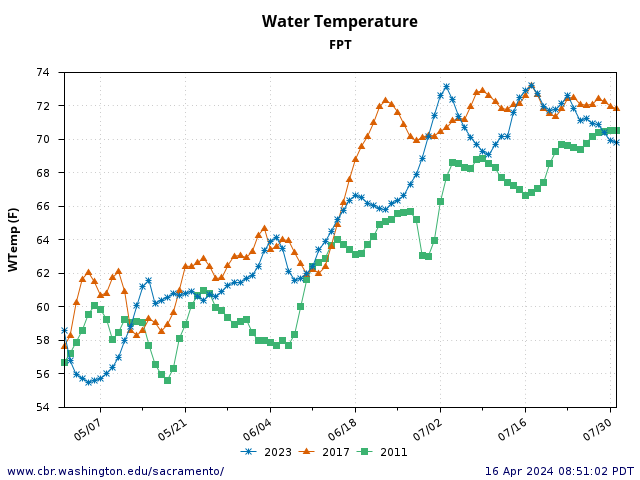
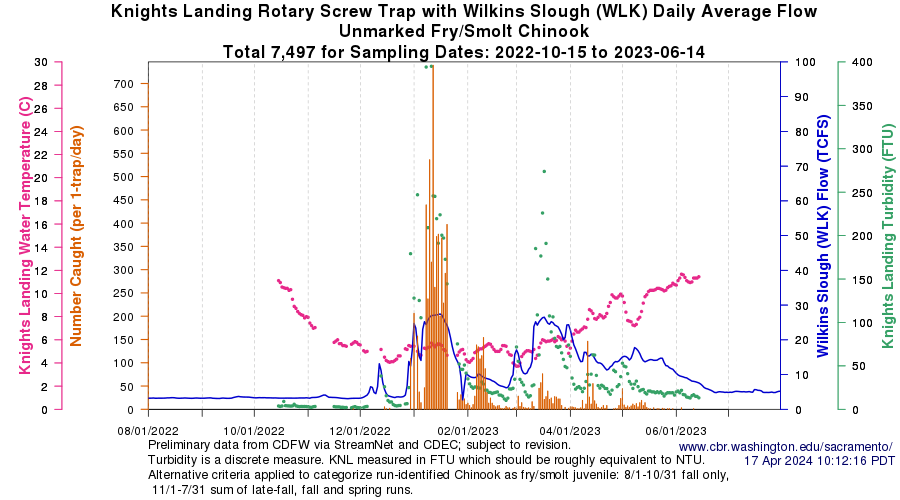
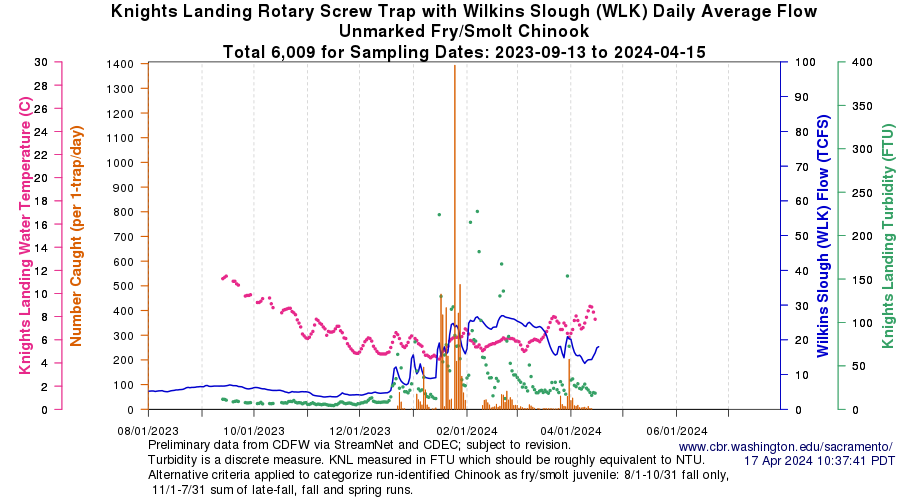
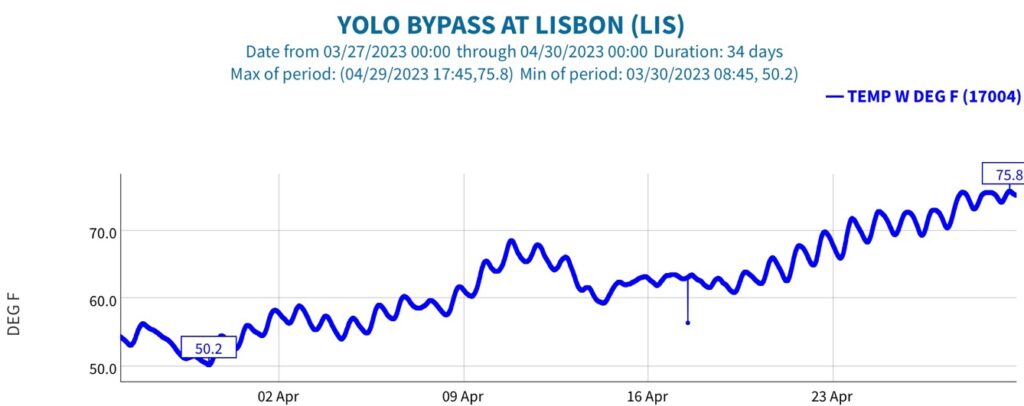
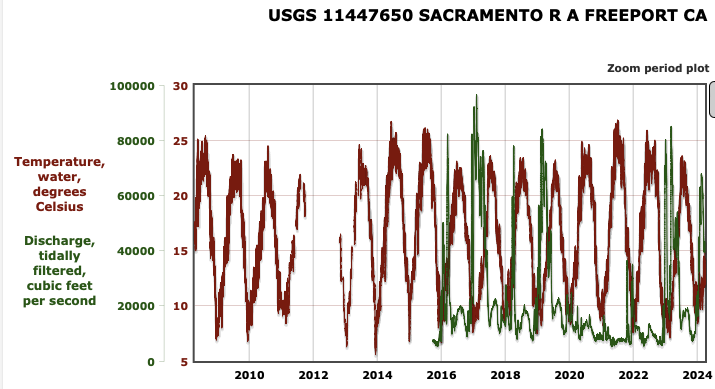
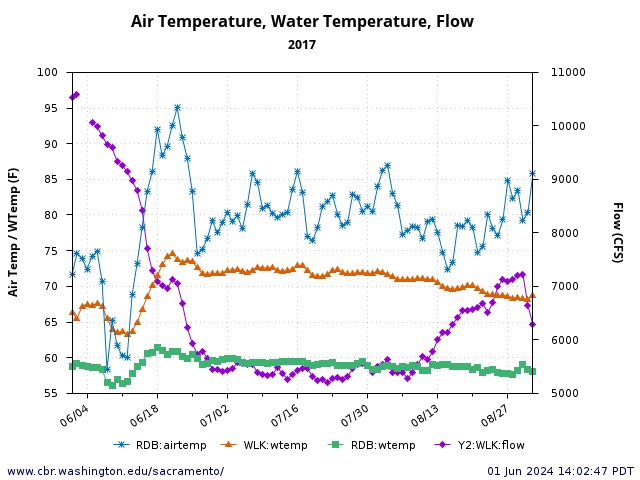
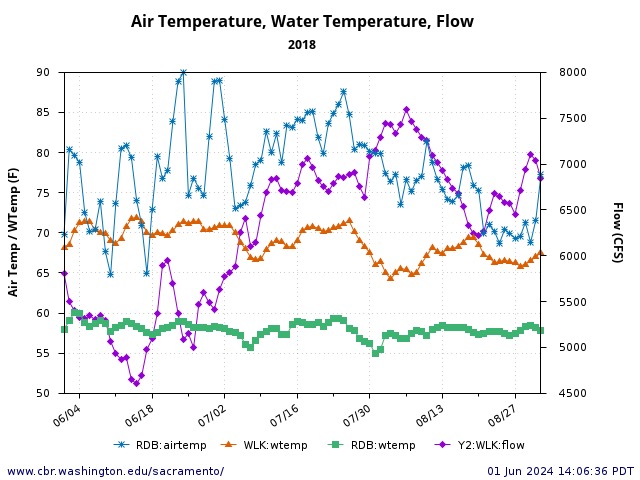
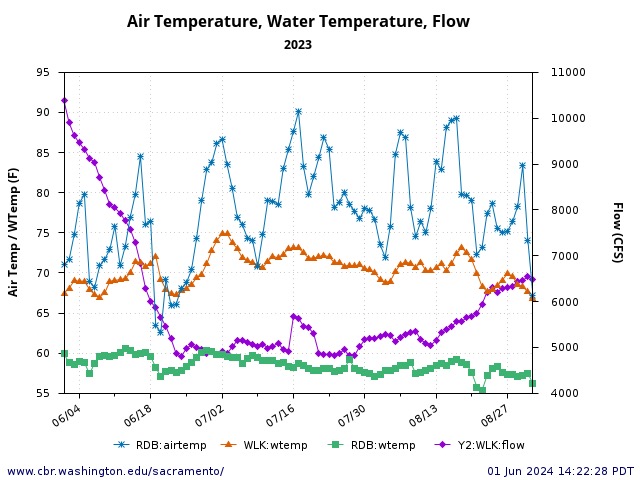
Basically, May and June water temperatures need to be cool 60-68oF for the juvenile sturgeon to grow and survive (Figure 6). Optimum conditions are provided in a wet year like 2023 (Figure 7), when water temperatures in June are in the mid 60s in the lower Sacramento River as it passes into the Delta (at Freeport). In an above normal water year like 2024, flows are too low and water temperatures exceed 70oF in June (Figure 7). In a drought year like 2022, May water temperatures in the lower Sacramento River during heat waves exceed 70oF and June water temperatures exceed 75oF (Figure 8). Young sturgeon can not survive such high water temperatures.[1]
These basic relationships bring us to the conclusion that recruitment of young sturgeon into the population only comes in wetter years. The sturgeon inherently know this, and most choose not to undergo a spawning trek except in wet years.
Thus, it is important to provide the best conditions possible in wet years to maximize sturgeon recruitment that may only be possible in only two or three years per decade.
Wet Year Prescriptions
- In the April-May spawning season in the lower Sacramento River, maintain flows and water temperatures lower than 65oF. Note this is generally possible in wet years (see Figures 5 and 6), but may require a small amount of reservoir storage releases or a limitation on irrigation deliveries.
- In June, when juvenile sturgeon emigrate to the Delta and Bay, maintain flows and water temperatures lower than 68oF, with an added flow pulse to stimulate and support emigration, as well as freshening of the Delta.
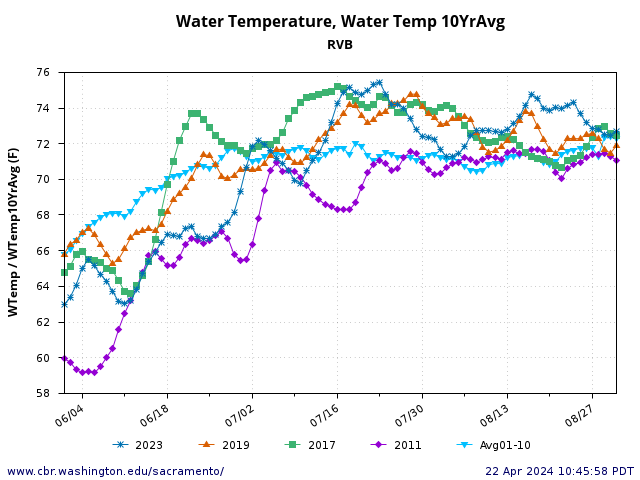
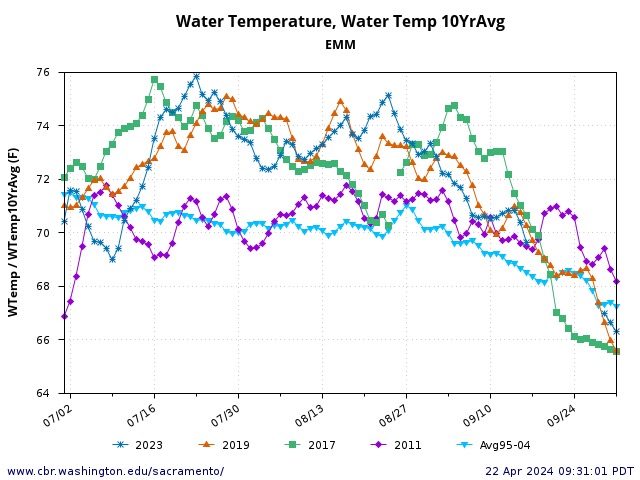
- Maintain higher flows in the lower Sacramento River in June and July nearer historical levels to support juvenile sturgeon emigration (Figures 9 and 10). Maintain water temperatures no higher than 72oF in the north, central, and west Delta channels (Figures 11 and 12).
- Limit combined south Delta exports from SWP and CVP pumping plants to 6000 cfs in June and 9000 cfs in July, as once prescribed in State Board’s D-1485 water quality objectives. Limit opening the Delta Cross Channel in June and selectively in July (when juvenile sturgeon migration into the Delta is at a minimum). Once the migration into the Delta is complete, opening the DCC is advised to promote westward flow toward the Bay from the central and west Delta.
- Sturgeon “salvaged” at the south Delta fish facilities (Figure 1) should be transported to an appropriate location in the Bay.
Above Normal Year Prescriptions
In above normal years such as 2024, prescriptions should be a close as possible to wet year prescriptions in the hope that some recruitment is possible for the broodyear.
Conclusion
A 2019 scientific paper on the white sturgeon population in the Central Valley [2] suggested: “that population growth was most influenced by the survival of sexually mature adults, and low levels of exploitation are needed to maintain a stable population.” This conclusion points to harvest and recent Bay die-offs of adult sturgeon in controlling the population level.
While this may be partially correct in pointing to the fishery and habitat degradation as the largest problems facing the white sturgeon population, my conclusions here point to the ultimate control being (1) lack of juvenile recruitment except in the wettest years and (2) limits on recruitment in some wet years. High juvenile recruitment in 2023 under a very low adult population level points to recruitment being most important in the long run and best explains the long-term decline in the white sturgeon population.
White sturgeon were recommended for listing under the state endangered species act in June 2024,[3] prompted by low population levels and recent adult die-off’s in San Francisco, San Pablo, and Suisun bays. It would be unfortunate if improving juvenile recruitment were not included in any actions taken to bring about recovery.
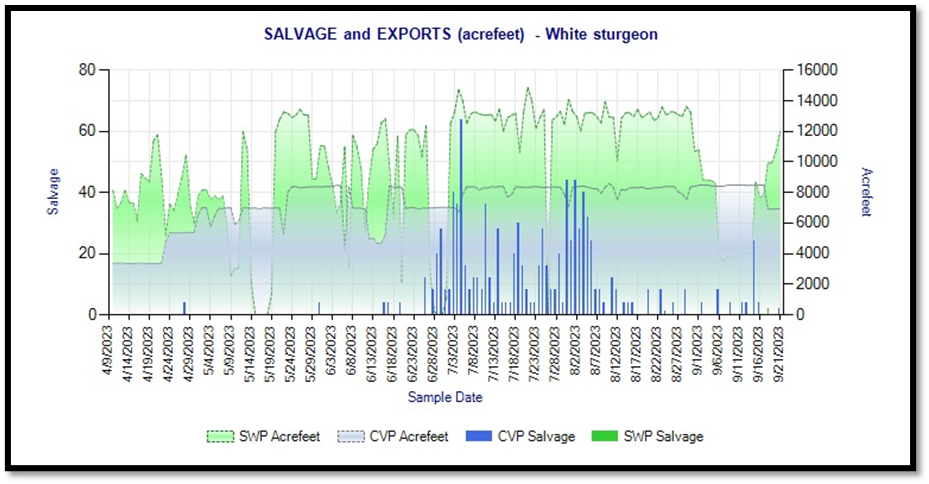
Figure 1. Salvage of juvenile white sturgeon at south Delta fish facilities with export rates in wet year 2023. Maximum export rates are approximately 11,400 cfs or 23,000 acre-ft per day.
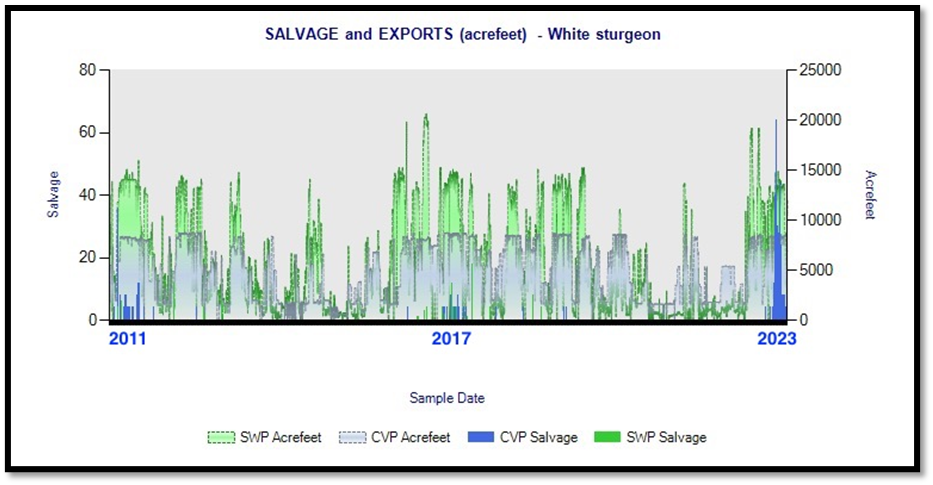
Figure 2. Salvage of juvenile white sturgeon at south Delta fish facilities with export rates 2011-2023. Three wet years noted.
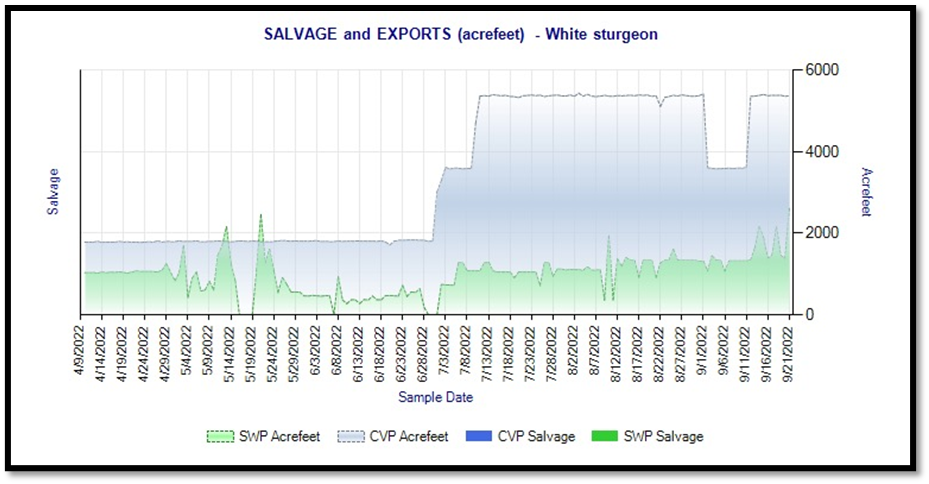
Figure 3. Salvage of juvenile white sturgeon at south Delta fish facilities with export rates in drought year 2022.
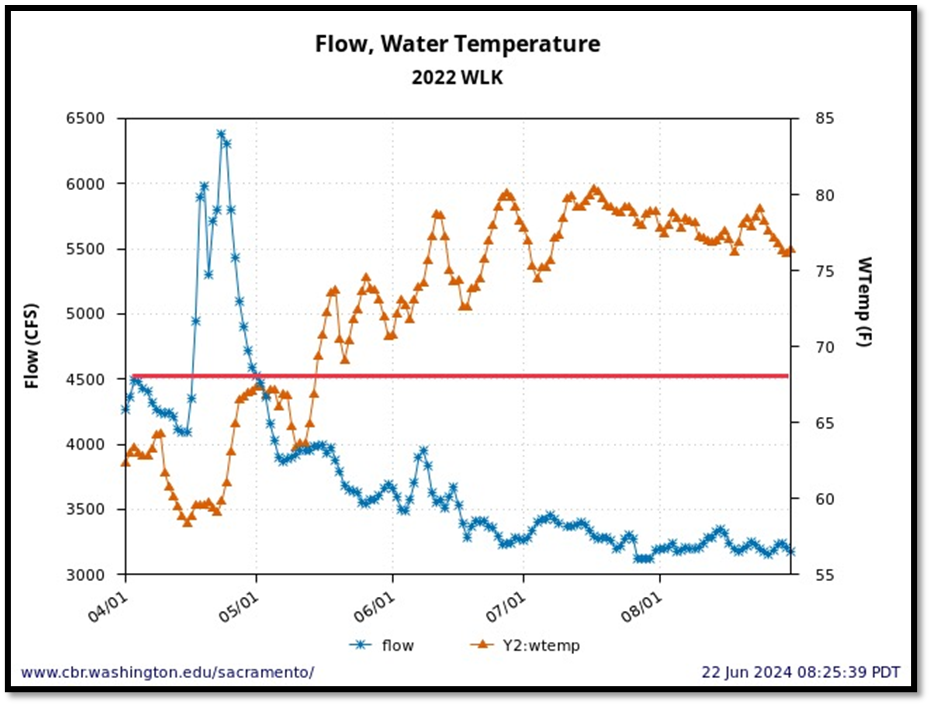
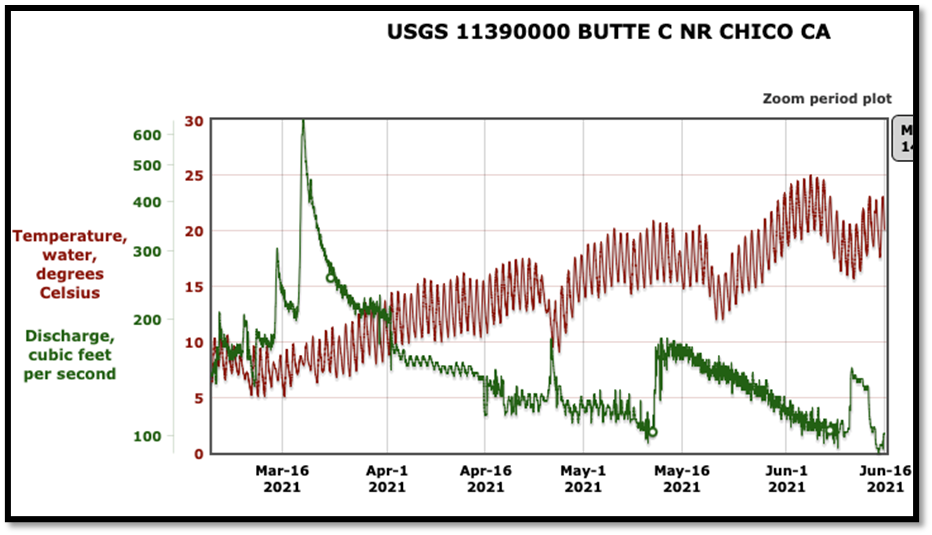
Figure 4. Flows and water temperature in the lower Sacramento River below Wilkins Slough (RM 120) April-August of drought year 2022. Water quality objective of 68oF noted as red line.
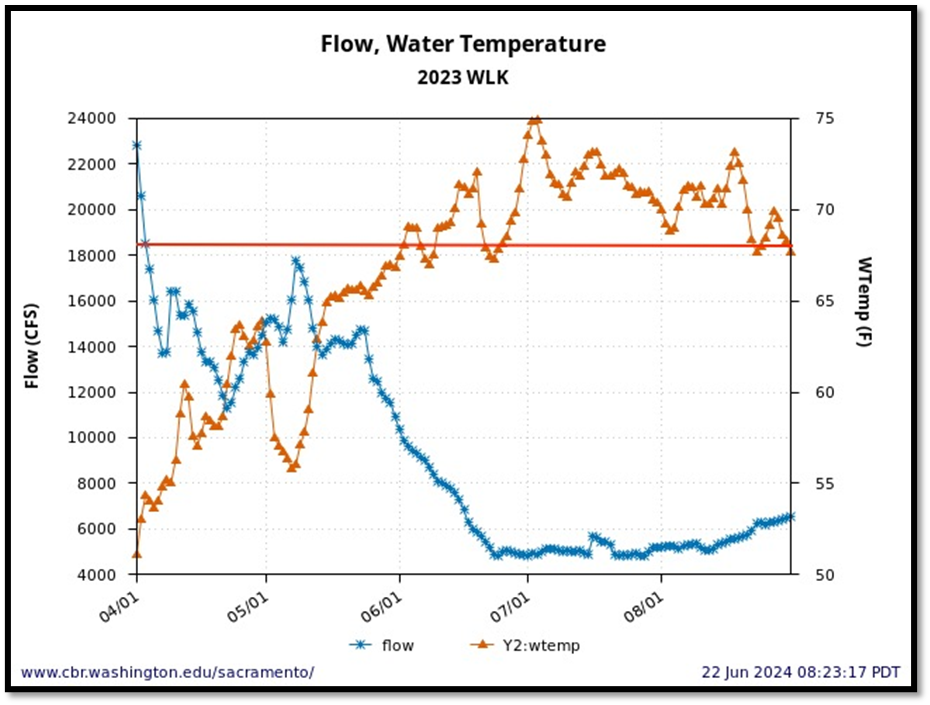
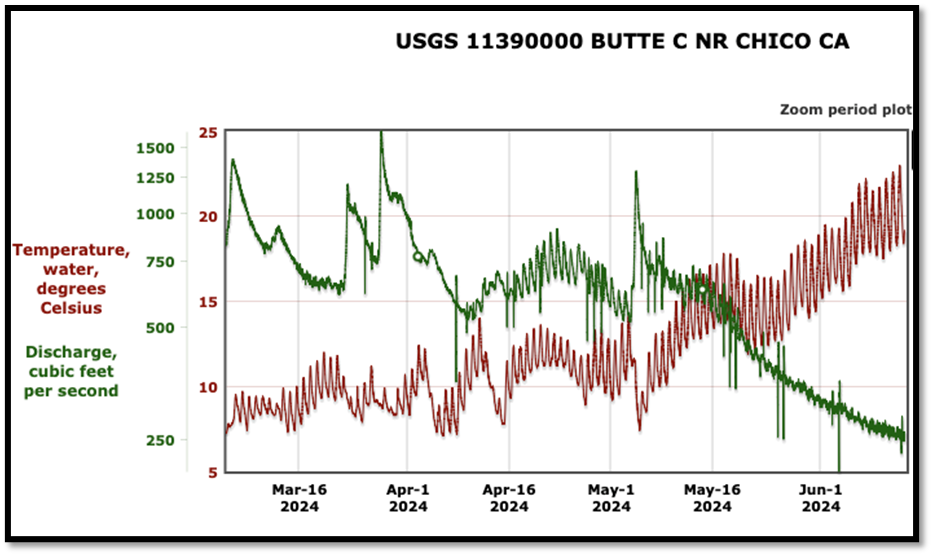
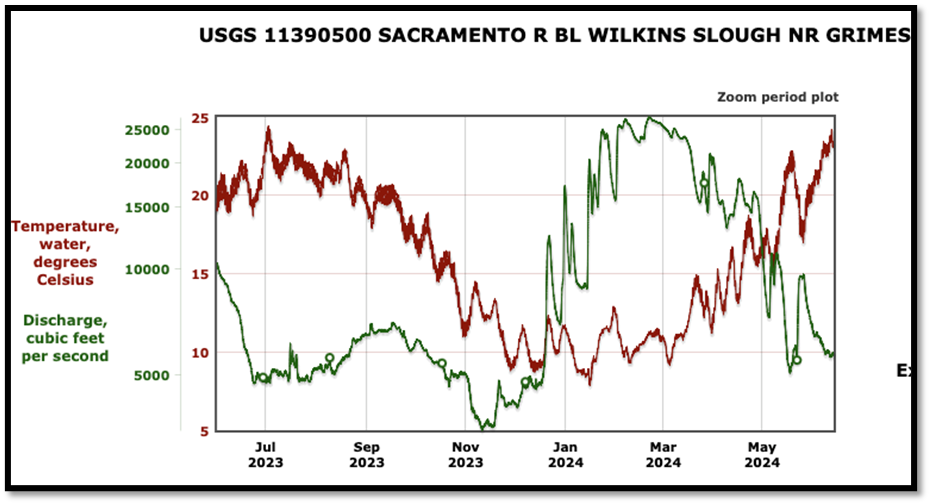
Figure 5. Flows and water temperature in the lower Sacramento River below Wilkins Slough (RM 120) April-August of wet year 2023. Water quality objective of 68oF noted as red line.
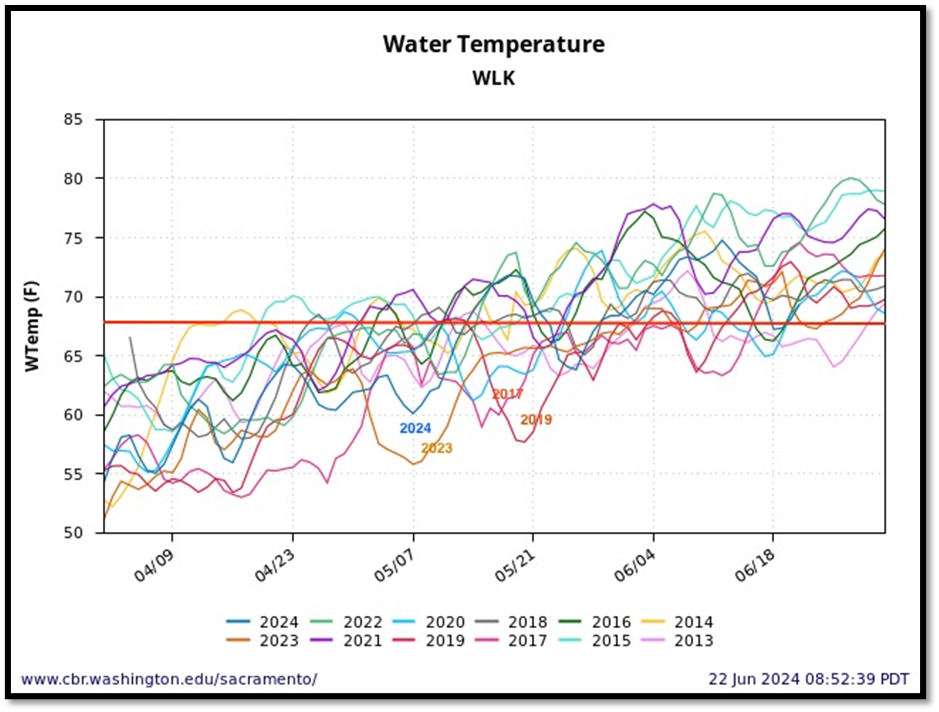
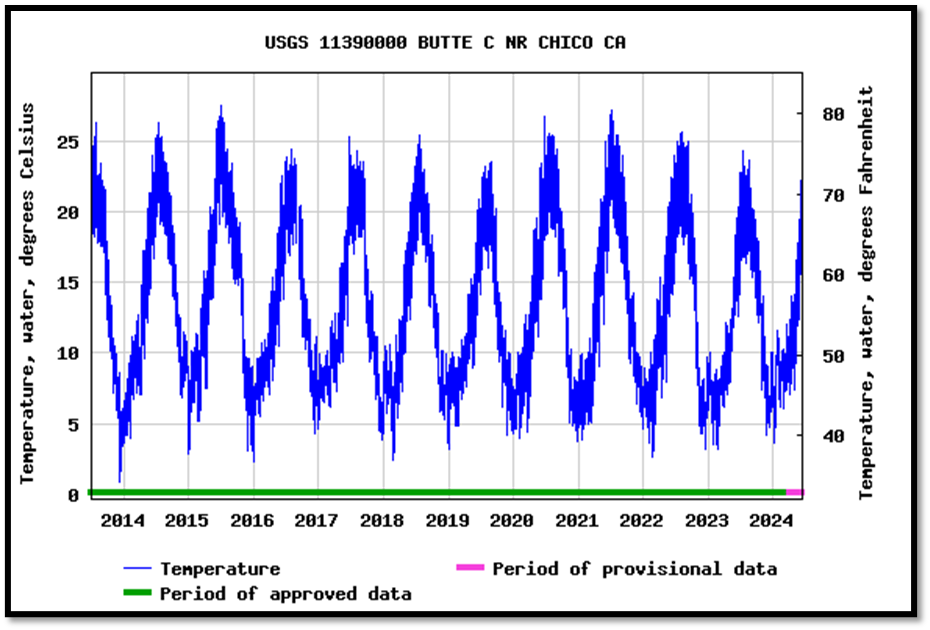
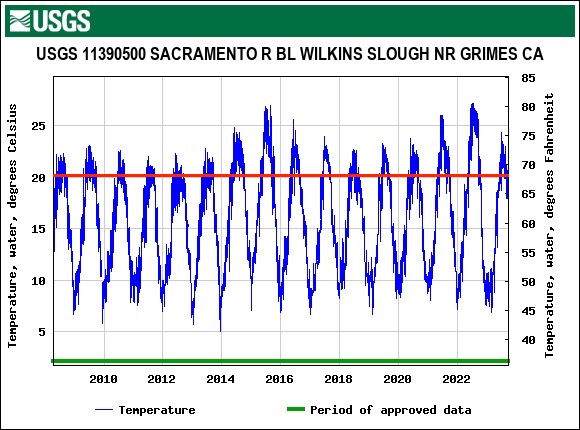
Figure 6. Water temperature at Wilkins Slough gage April-June 2013-2024. Three wet years and above normal 2024 noted. Also noted in red line is the 68ºF water quality objective.
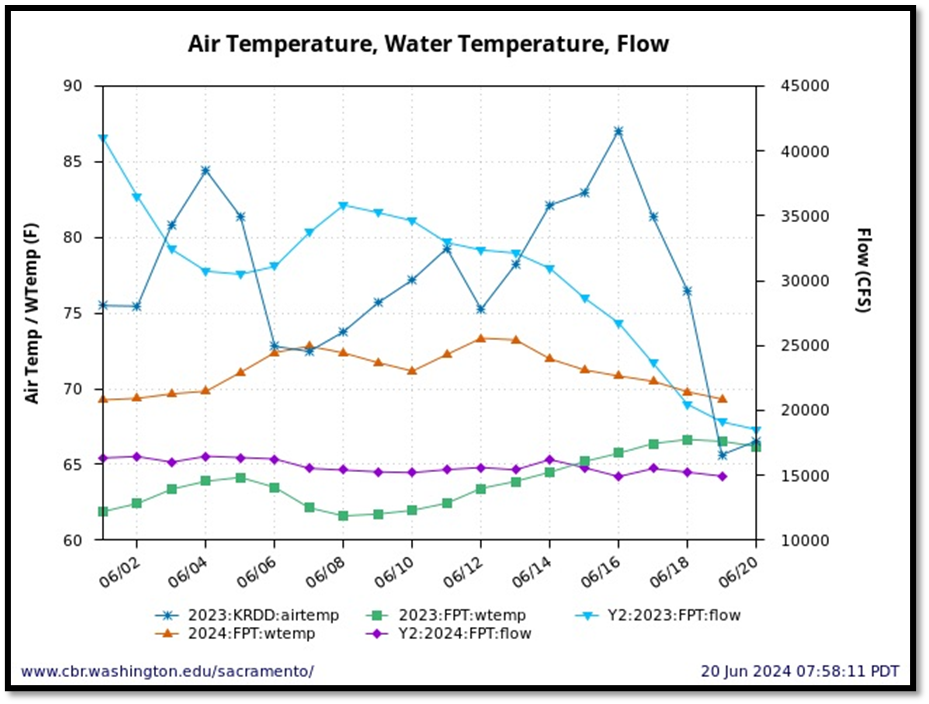
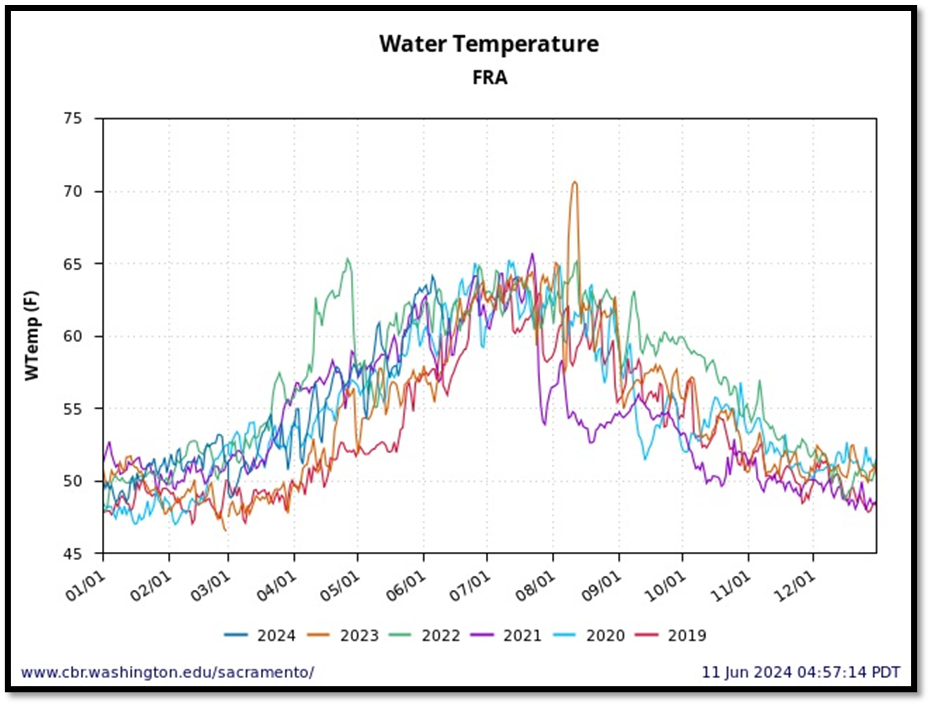
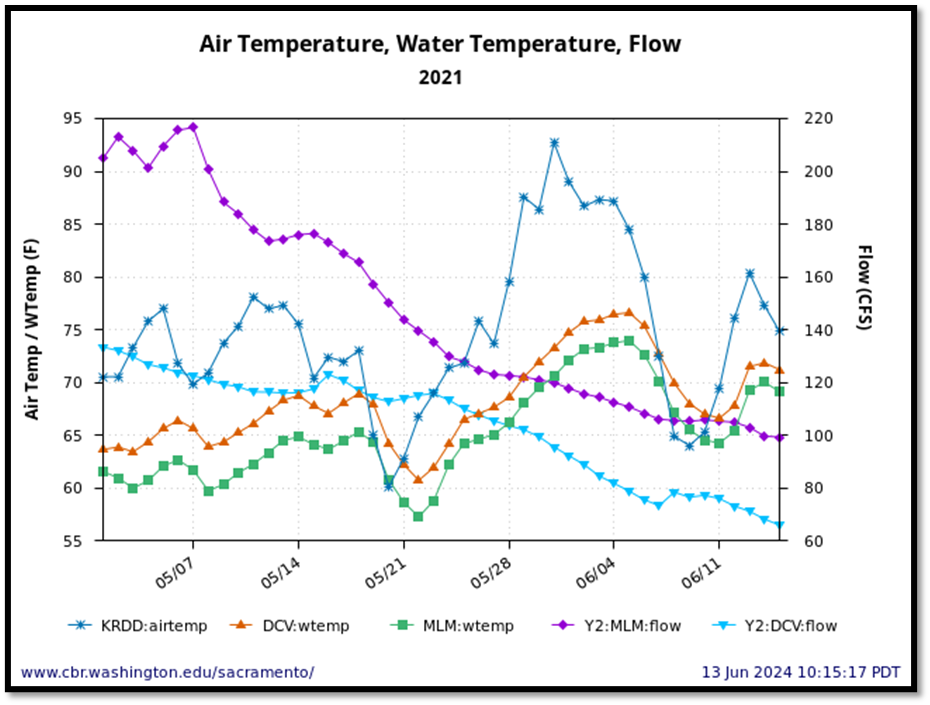
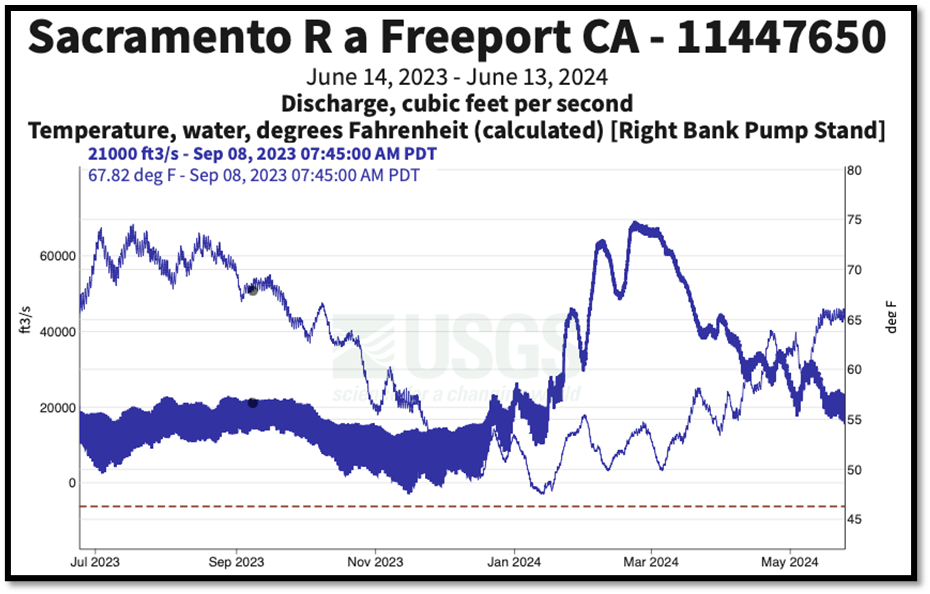
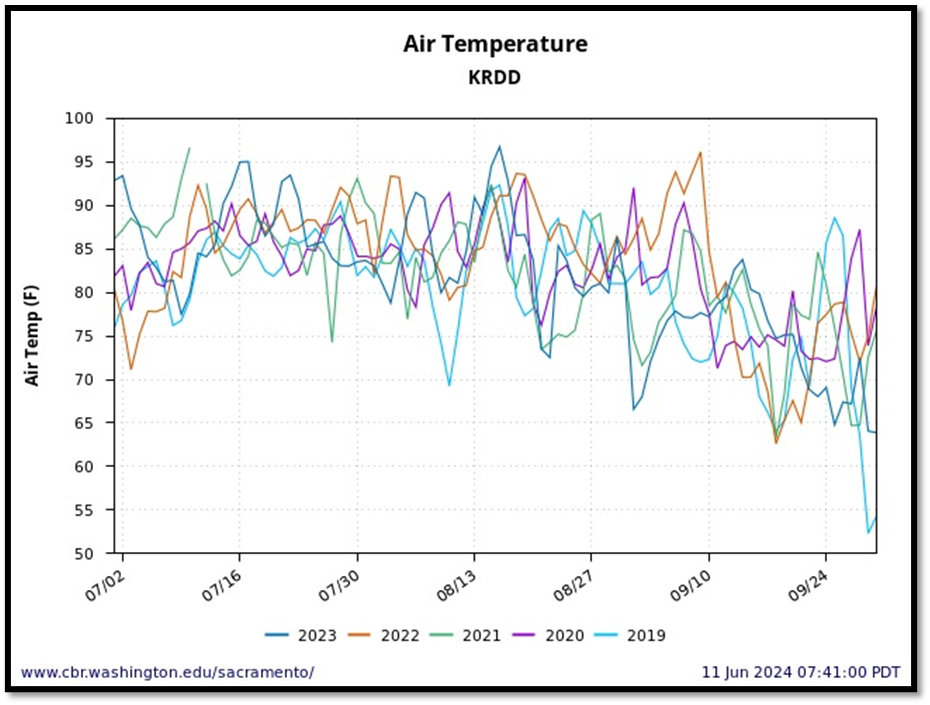
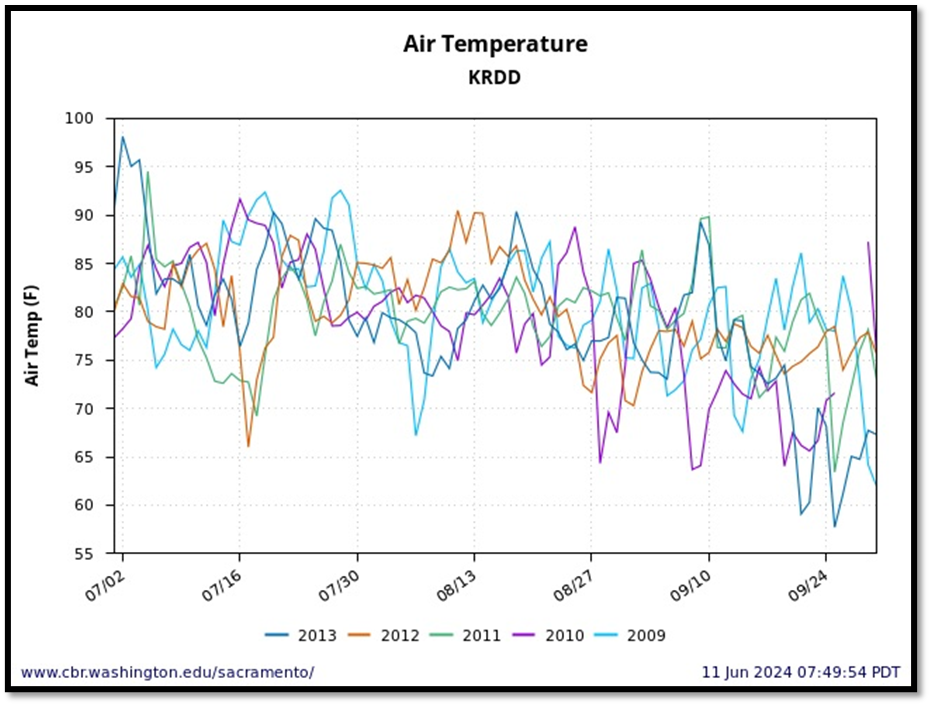
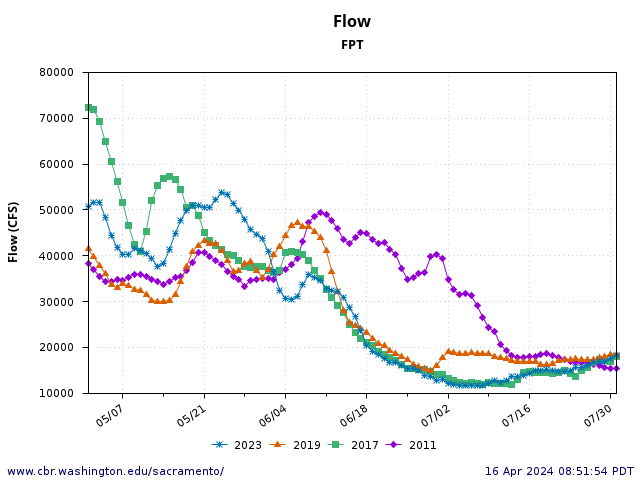
Figure 7. Comparison of June 2023 and 2024 Freeport gage water temperatures and flows with 2023 Red Bluff air temperature.
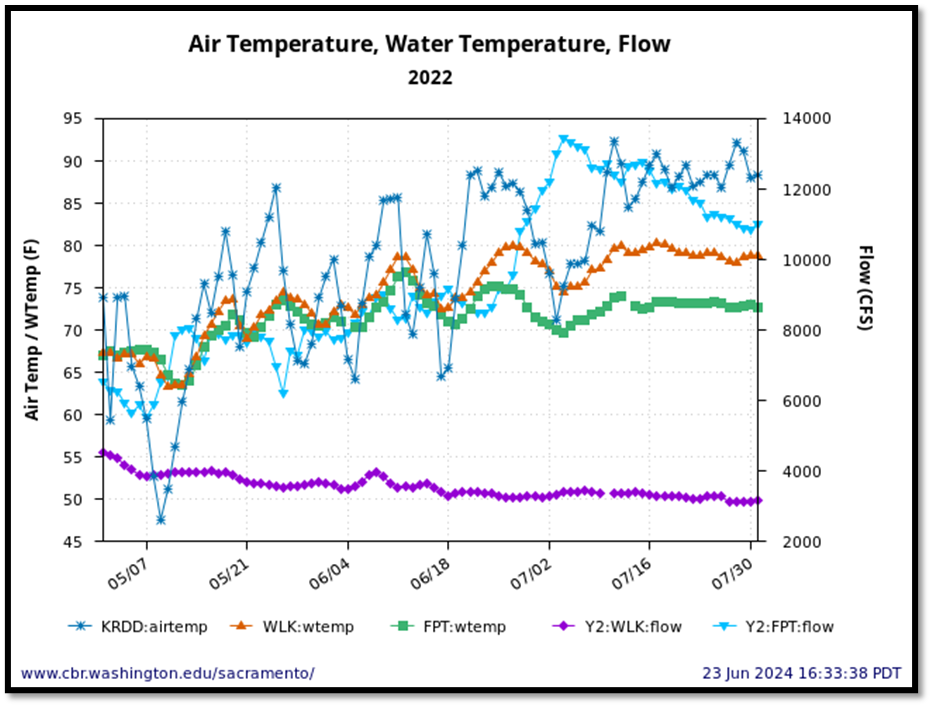
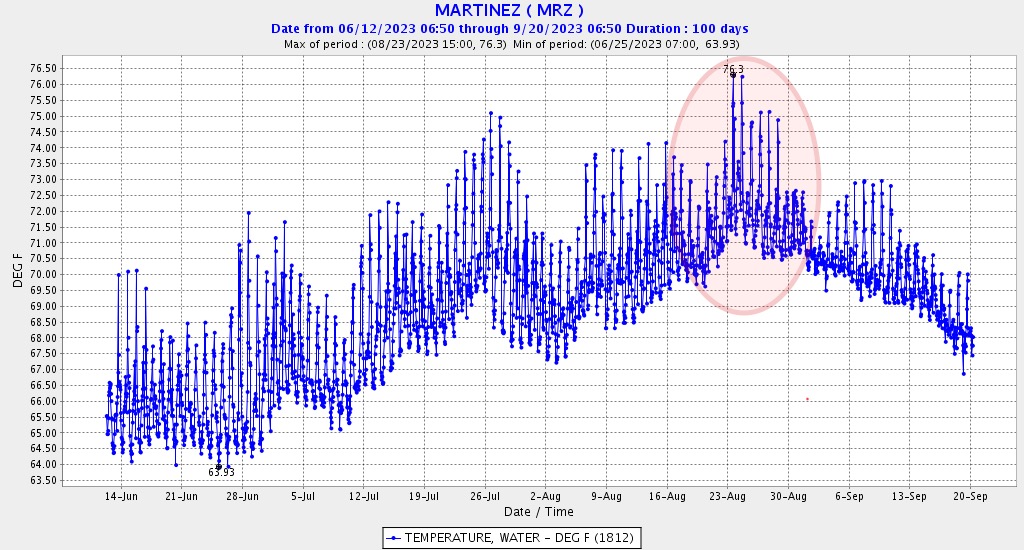
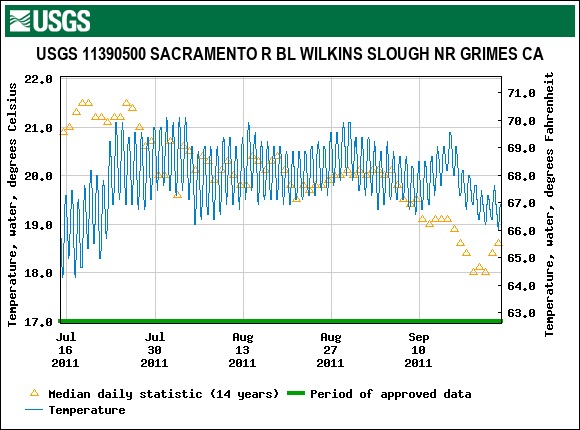
Figure 8. Comparison of May-July 2022 Freeport (RM 50) and Wilkins Slough (RM 130) gages Sacramento River water temperatures and flows with 2022 Red Bluff air temperature.
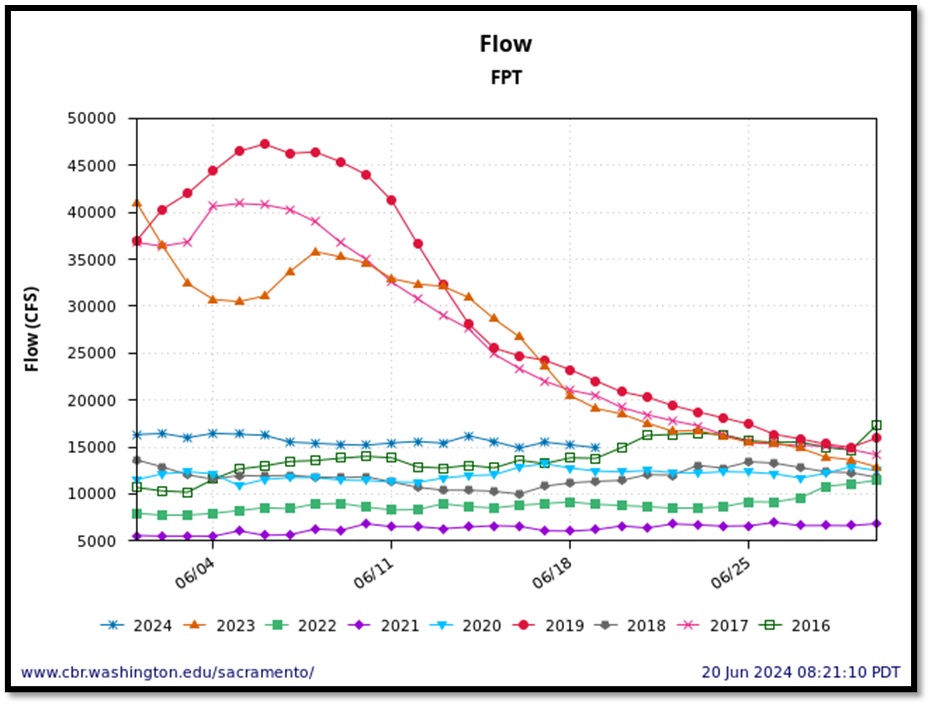
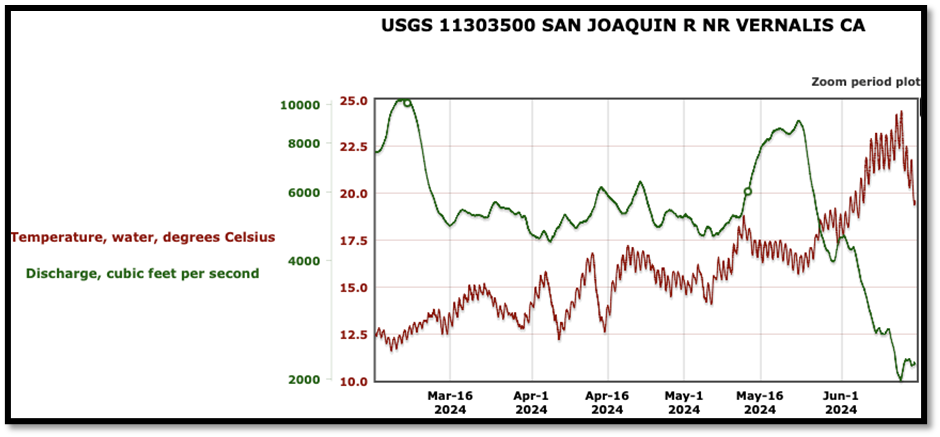
Figure 9. Comparison of May-June 2016-2024 Freeport (RM 50) Sacramento River streamflows. Red years are wet years. Year 2024 is above normal. Years 2021 and 2022 are critically dry years. Years 2016, 2018, and 2020 are below normal years.
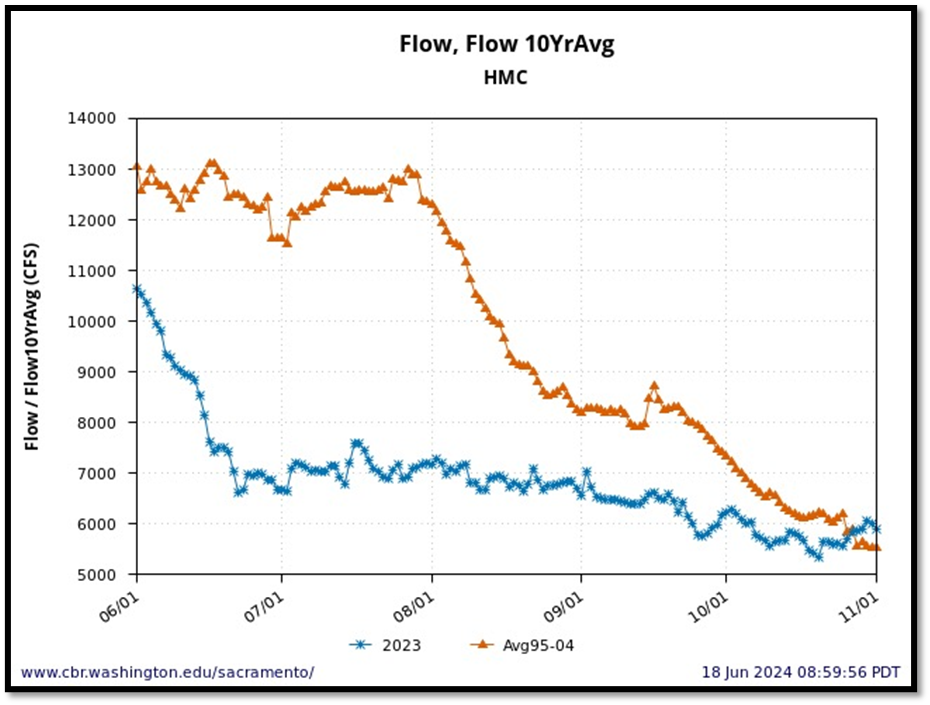
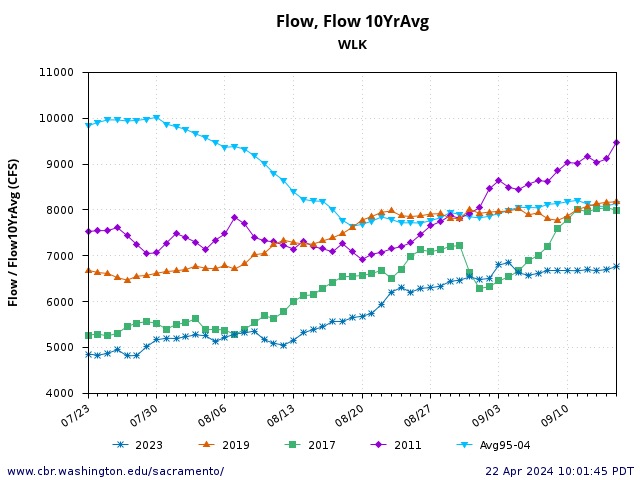
Figure 10. Flows and water temperature in the lower Sacramento River at Hamilton City (RM 146) June-October of wet year 2023 and average for years 1995-2004. Note summer historical flows were higher than in recent wet year. Flows were historically higher to maintain water quality objective of 56-68ºF in lower 100 miles of river upstream of the Delta.
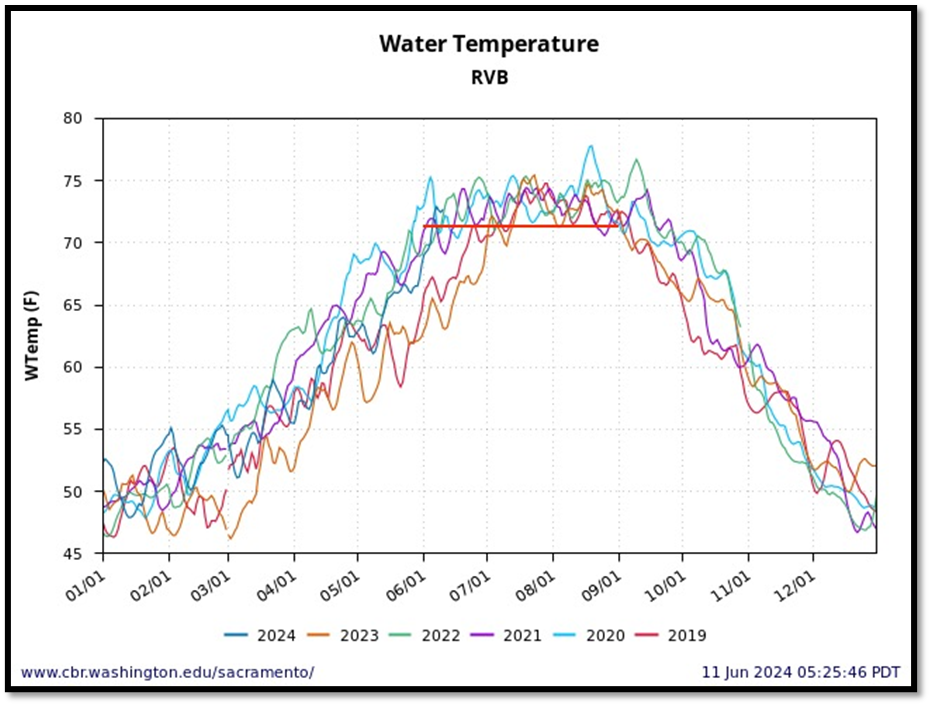
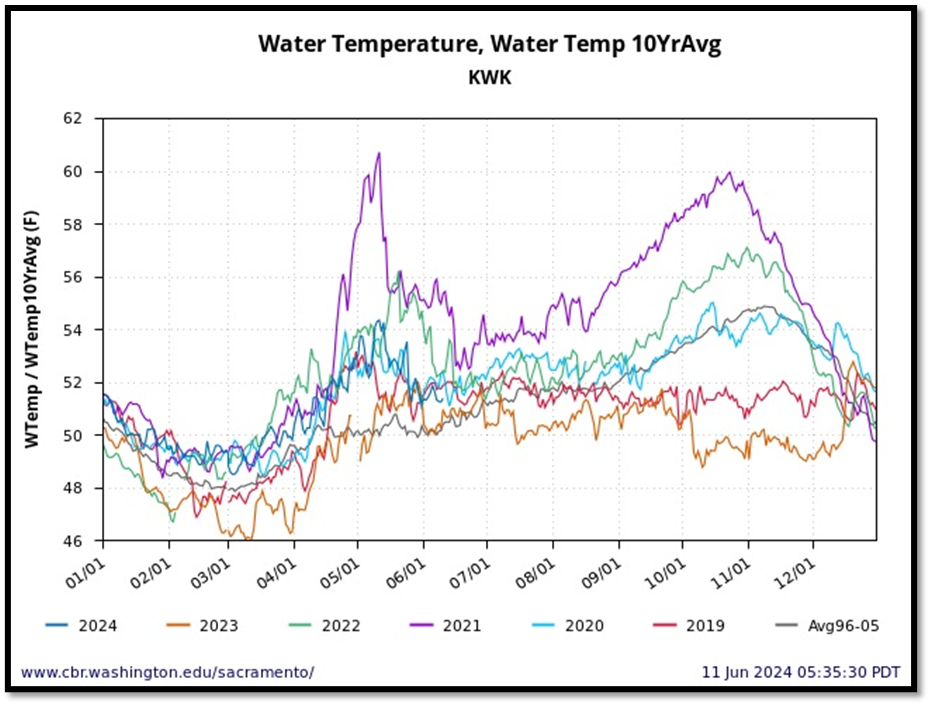
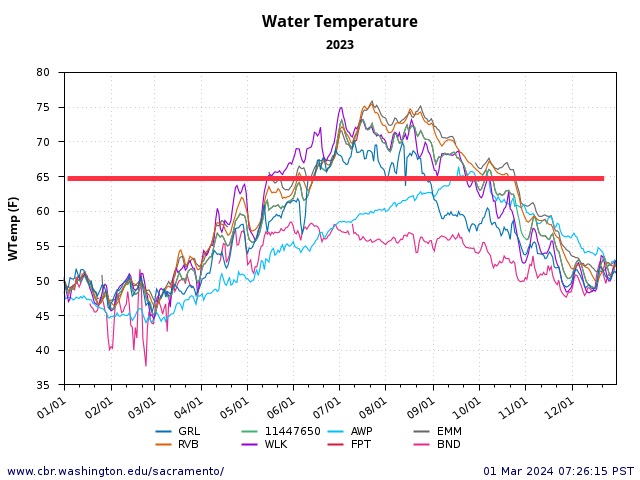
Figure 11. Water temperatures at Rio Vista Bridge in north Delta 2019-2024. Red line denotes recommended summer water quality standard to protect white sturgeon.
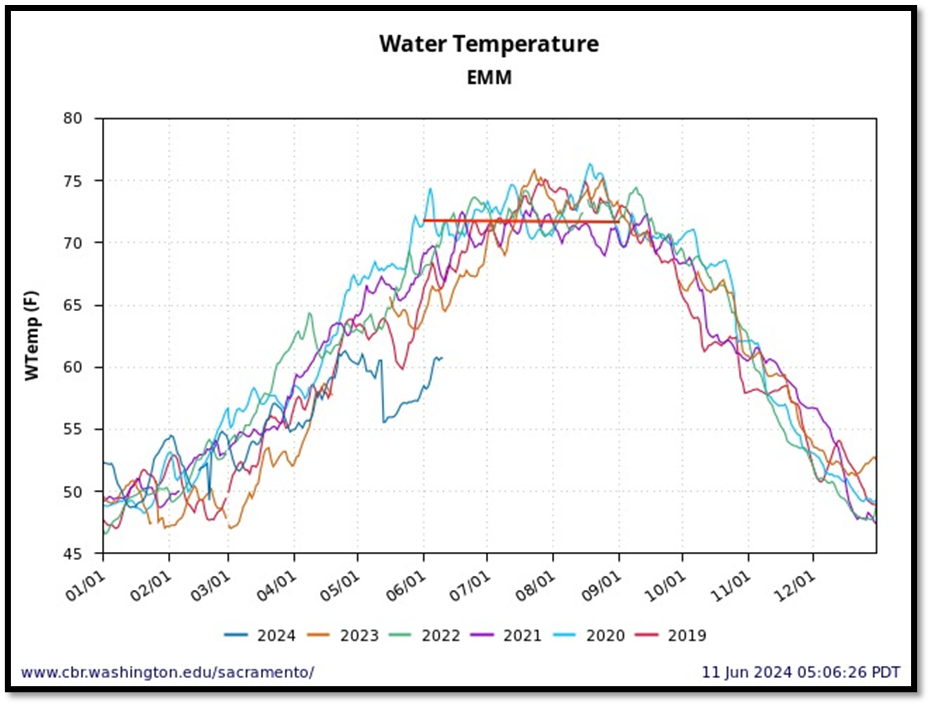
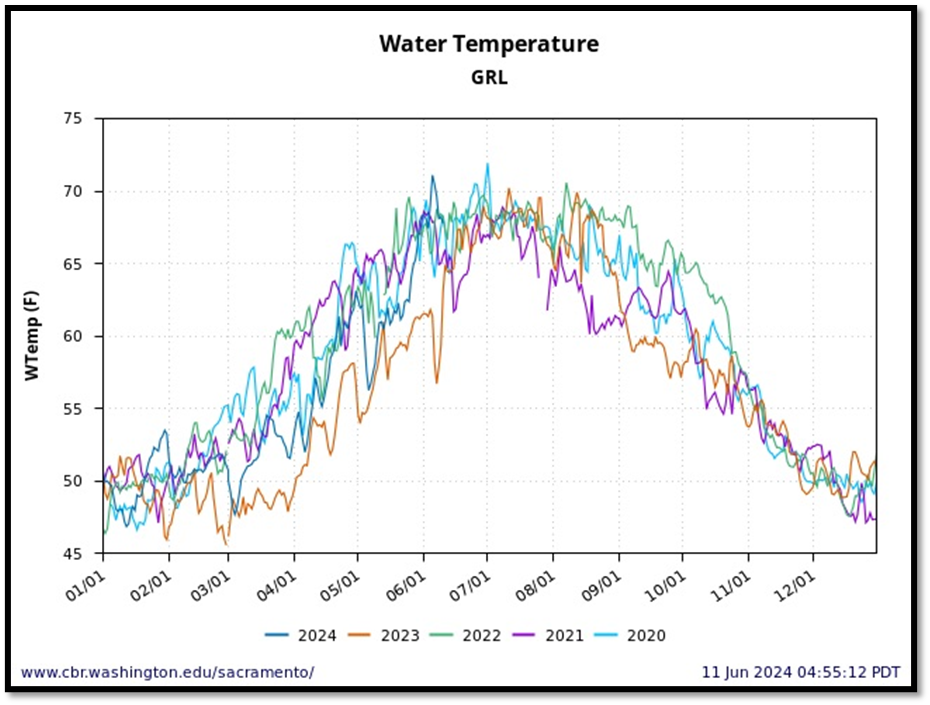
Figure 12. Water temperatures at Emmaton in west Delta 2019-2024. Red line denotes recommended summer water quality standard to protect white sturgeon.
* The Strawberry Moon (or Planting Moon) is the given name of the June full moon.
[1] https://calsport.org/fisheriesblog/?p=938
[2] Blackburn et al. (2019). Available at: https://afspubs.onlinelibrary.wiley.com/doi/abs/10.1002/nafm.10316
[3] https://calmatters.org/environment/2024/06/white-sturgeon-gains-california-protection-species/